This paper is available online free of all access charges (see http://jxb.oxfordjournals.org/open_access.html for further details)
RESEARCH PAPER
Visualization of specific repetitive genomic sequences with
fluorescent TALEs in Arabidopsis thaliana
Satoru Fujimoto1, Shigeo S. Sugano2,3, Keiko Kuwata4, Keishi Osakabe5 and Sachihiro Matsunaga1,*
1 Department of Applied Biological Science, Faculty of Science and Technology, Tokyo University of Science, Noda, Chiba 278–8510, Japan
2 Graduate School of Science, Kyoto University, Kyoto 606–8502, Japan 3 PRESTO, JST, Saitama 332-0012, Japan
4 Institute of Transformative Bio-Molecules, Nagoya University, Nagoya 464–8601, Japan 5 Faculty of Bioscience and Bioindustry, Tokushima University, Tokushima 770–8513, Japan *Correspondence: [email protected]
Received 10 August 2016; Accepted 15 September 2016 Editor: Chris Hawes, Oxford Brookes University
Abstract
Live imaging of the dynamics of nuclear organization provides the opportunity to uncover the mechanisms respon-sible for four-dimensional genome architecture. Here, we describe the use of fluorescent protein (FP) fusions of transcription activator-like effectors (TALEs) to visualize endogenous genomic sequences in Arabidopsis thaliana. The ability to engineer sequence-specific TALEs permits the investigation of precise genomic sequences. We could detect TALE-FP signals associated with centromeric, telomeric, and rDNA repeats and the signal distribution was consistent with that observed by fluorescent in situ hybridization. TALE-FPs are advantageous because they permit the observation of intact tissues. We used our TALE-FP method to investigate the nuclei of several multicellular plant tissues including roots, hypocotyls, leaves, and flowers. Because TALE-FPs permit live-cell imaging, we success-fully observed the temporal dynamics of centromeres and telomeres in plant organs. Fusing TALEs to multimeric FPs enhanced the signal intensity when observing telomeres. We found that the mobility of telomeres was different in sub-nuclear regions. Transgenic plants stably expressing TALE-FPs will provide new insights into chromatin organization and dynamics in multicellular organisms.
Key words: Centromere, chromatin, fluorescent protein, genome editing, live cell imaging, rDNA, telomere, transcription
activator-like effector.
Introduction
Genome organization is a dynamic process that influences gene expression, genome maintenance, and responses to environmental stimuli in many organisms (Kurz et al., 1996;
Franklin and Cande, 1999; Cobbe and Heck, 2000; Misteli, 2007). Fluorescent in situ hybridization (FISH) is a powerful tool for determining the spatial organization of specific DNA sequences on chromosomes or in nuclei (Hans de Jong et al., 1999). Although FISH is, in principle, capable of detecting
any specific sequence, it cannot provide information about chromatin dynamics, because FISH requires the fixation of cells and a high-temperature treatment for hybridization. To visualize chromatin organization without fixation and hybridization, several in vivo imaging techniques have been developed. The first report describing in vivo imaging of chro-matin used DNA-binding domains of bacterial transcrip-tion factors, such as the lac repressor (LacI) or tetracycline
This is an Open Access article distributed under the terms of the Creative Commons Attribution License (http://creativecommons.org/licenses/by/3.0/), which permits unrestricted reuse, distribution, and reproduction in any medium, provided the original work is properly cited.
© The Author 2016. Published by Oxford University Press on behalf of the Society for Experimental Biology.
repressor (TetR) systems (Robinett et al., 1996; Kato and Lam, 2001; Matzke et al., 2005). After repeats of the cog-nate DNA sequences recognized by these transcription fac-tors are introduced into specific genomic regions, the nuclear localization of these regions can be observed by expressing GFP-tagged transcription factors. Using this system, the rela-tionship between chromatin conformation, gene expression (Rosin et al., 2008) and DNA damage (Hirakawa et al., 2015) have been examined in plants.
However, as the preceding method requires the random insertion of exogenous DNA into the genome, it is not amena-ble to in vivo imaging of specific genomic loci. In order to solve this problem, an in vivo imaging strategy that made use of zinc-finger domain containing proteins was developed (Lindhout et al., 2007). These domains contain a DNA-binding motif whose specificity can be engineered and that have previously been used for genome editing. Engineered zinc-finger domains have been used to detect endogenous centromere sequences (Lindhout et al., 2007). However, because each modular zinc-finger protein recognizes a DNA triplet with context-dependent interactions between neighbouring zinc-fingers, engineering proteins to recognize specific sequences can be challenging (Gaj et al., 2013). By contrast, TALEs contain a DNA binding domain comprising repeats of an approxi-mately 34 amino acid-long DNA recognition module. Each module robustly recognizes a single nucleotide (Boch et al., 2009; Moscou and Bogdanove, 2009). In human and mouse cultured cells, TALE-FPs (also known as TGV, TALEColor, and dTALE) have been successfully used for the visualization of chromatin (Ma et al., 2013; Miyanari et al., 2013; Thanisch et al., 2014). Furthermore, transiently expressed TALE-FPs (TALE-light) have previously been used to analyse chromatin dynamics in Drosophila melanogaster (Yuan et al., 2014). Here we present stable transgenic lines expressing TALE-FPs for centromeric, telomeric, and rDNA sequences and analyse the dynamics of these sequences in the nuclei of plant organs.
Materials and methods
Plasmid construction
TALEs were assembled in pZHY500 by Golden Gate assembly using the TAL effector toolbox (Cermak et al., 2011) obtained from Addgene. The target sequences are provided in Supplementary Table S1 at JXB online. pCE1.2iFok was used for the construction of TALE-fluorescent protein (FP) fusion expression cassettes. pCE1.2iFok was obtained by cloning the expression cassette, the 2xCaMV35S pro-moter with the omega enhancer—the FokI nuclease domain—and the Arabidopsis HSP18.2 gene terminator into the pCR8/GW/TOPO TA Cloning vector (ThermoFisher Scientific). The assembled TALEs were cloned into N-GFP, N-Venus, N-tdTomato, or pCE-N-3xGFP. pCE-N-FPs were constructed by modifying pCE1.2iFok, including replacement of the promoter region with a nuclear localiza-tion signal sequence by AscI and NcoI digeslocaliza-tion and replacement of the FokI domain with sGFP, Venus (Nagai et al., 2002), tdTomato (Shaner et al., 2004) or 3xGFP (Ma et al., 2015) with an In-Fusion HD Cloning kit (Takara Bio Inc.). The sequence of pCE-N-GFP is provided in see Supplementary Fig. S1 at JXB online. The destination vector pGWB-RPS5a was obtained by modification of pGWB501 (Nakagawa et al., 2007). The 1.7-kb SbfI and XbaI fragment contain-ing the RPS5a promoter (Weijers et al., 2001) was inserted into the
SbfI–XbaI site of pGWB501 to yield pGWB-RPS5a. The TALE-FPs were transferred either to pGWB-RPS5a for microscopic observation or to pMDC32 (Curtis and Grossniklaus, 2003) for immunoprecipita-tion with LR clonase (Invitrogen). Details of vector construcimmunoprecipita-tion are shown in Supplementary Fig. S2.
Plant materials and transformation
The plasmids encoding engineered TALE-FP fusions were introduced into Agrobacterium tumefaciens GV3101. Transformation of either A. thaliana accession Col-0 or the KU70 mutant (SALK_123114) (Gámez-Arjona et al., 2010) was performed by the floral dip method (Clough and Bent, 1998). The transformants were selected on solidi-fied 1/2 MS medium containing claforan and hygromycin.
Immunolabelling of TALE-GFP and FISH analysis
Indirect immunofluorescence was performed on root cells or isolated nuclei from leaves as described previously (Fujimoto et al., 2004; Tirichine et al., 2009). CENH3 was detected with rabbit anti-HTR12 antibody (Talbert et al., 2002) (1:1 000) and GFP was detected with either rat anti-GFP antibody (1:200 Bio Academia 1A5) or rabbit anti-GFP antibody (1:200 Invitrogen A11122). The signals were amplified using Alexa 488 anti-rat antibody (1:200, Life Technologies) and Alexa 546 anti-rabbit antibody (1:200, Life Technologies) or Alexa 488 anti-rabbit antibody (1:200, Life Technologies). Cells were counterstained with DAPI in VECTASHIELD anti-fade mounting medium (Vector Laboratories).
FISH was performed essentially as described previously by Shibata and Murata (2004) following immunofluorescence staining. Briefly, probes recognizing 180 bp centromeric repeats or telomeres were synthesized by nick translation using a DIG nick translation mix (Roche Diagnostics). The DIG-labelled probes were visualized using anti-digoxigenin-rhodamine Fab fragments (Roche).
Microscopy
For immunostaining and FISH, we used an upright microscope (BX53, Olympus, Tokyo, Japan) with a ×100 objective (UPLSAPO 100×, Olympus, Tokyo, Japan) and a CCD camera (DOC CAM U3-50S5M-C, Molecular Devices) controlled with MetaVue (Molecular Devices). For live imaging, we used an inverted micro-scope (IX81, Olympus, Tokyo, Japan) equipped with a spinning-disk confocal system (CSU-X disk, Yokogawa Electric, Tokyo, Japan) with ×40, ×60 or ×100 objectives (UPLFLN 40XO, PLAPO 60XO2PH, PLAPO 100XO) and a CMOS camera (Neo 5.5 sCMOS, ANDOR) controlled with MetaMorph (Molecular Devices). GFP and tdTo-mato were excited with 488 nm and 561 nm lasers, respectively. T2 populations were sown on 1/2 MS medium in Petri dishes and grown for 5 d prior to analysis, with the exception of floral organ samples. Flower buds were used for floral organ samples. Whole plants or flo-ral organs were placed between cover slips mounted with water. For time-lapse observation, T2 populations were sown on solidified 1/2 MS medium in glass-bottomed dishes and grown for 7–14 d prior to imaging with confocal microscopy. Images were acquired every 2–5 min using multiple z-planes (0.6–1.0-μm intervals) and 10–20 planes per sample were collected. For higher-resolution imaging, we used a confocal microscope (FV1200, Olympus, Tokyo, Japan) with a ×60 or a ×100 objective (UPLSAPO 60XW, UPLSAPO 100XO) and GaAsP detectors controlled with FluoView (Olympus, Tokyo, Japan). GFP, Venus, and 3xGFP were excited with a 473 nm laser and tdTomato was excited with a 559 nm laser. Images were pro-cessed by Fiji to generate maximum intensity projection images, adjust the contrast, reduce the background, and to add colour.
Tracking analysis
TALE_telo-FP signals were plotted and the centres of the nuclear masses were calculated from the projection images of the time points
(30 min). The mean-squared displacement (MSD) was calculated from the average change in distance between each TALE-FP signal and the nuclear centre of mass over the possible combinations of lag time (Δt). MSD values of the signals were averaged and the standard deviations were presented.
Co-immunoprecipitation and MS analysis
Seedlings of A. thaliana expressing TALE_180-GFP or TALE_ telo C-GFP were used for co-immunoprecipitation. Two grams of 3-week-old seedlings were fixed with 1% formaldehyde for 30 min, ground with a mortar and pestle, and lysed in immunoprecipitation buffer containing 50 mM HEPES-KOH (pH 7.5), 140 mM NaCl, 1 mM EDTA, 1% Triton X-100, 0.1% sodium deoxycholate, 1 mM PMSF, and Complete Protease Inhibitor Cocktail (Roche) (Mérai et al., 2014). The homogenates were filtered through two layers of Miracloth to remove cell debris. The flow-through fraction was soni-cated with Bioruptor UCD-250 for 15 min at the middle intensity (200 W, 15/30 s ON/ OFF cycle) to shear chromatin and debris was then removed by centrifugation at 15 000×g for 30 min. The super-natant was used for immunoprecipitation with GFP trap magnetic beads. Washes were performed with immunoprecipitation buffer. SDS-PAGE was carried out according to the method described by Laemmli (1970). Co-immunoprecipitated samples were dissolved in sample buffer and resolved (~2 cm) using a slab gel. Each lane was divided into six pieces. In-gel digestion was performed according to the method described by Rosenfeld et al.(1992).
Samples were analysed by nano-flow reverse phase liquid chroma-tography followed by tandem MS, using a Triple TOF 5600+ (AB SCIEX, Concord, Canada). A capillary reverse phase HPLC-MS/ MS system composed of an Eksigent Ekspert nano-LC 400 HPLC system (AB SCIEX) connected directly to an AB SCIEX quadrupole time-of-flight (QqTOF) TripleTOF 5600+ mass spectrometer (AB SCIEX) in the trap and elute mode was used to identify the ensemble of proteins present in each sample. In the trap and elute mode, the samples were automatically injected using the Ekspert 400 system into a peptide trap column (ChromeXP, C18-CL, 200 µm I.D. ×0.5 mm, 3 µm particle size, 120 Å pore size, AB SCIEX) attached to a cHiPLC system (AB SCIEX) for desalting and the concentration of peptides. After washing the trap with MS-grade water containing 0.1% tri-fluoroacetic acid and 2% acetonitrile (solvent C), the peptides were loaded into a separation capillary reverse phase column (ChromeXP, C18-CL, 75 µm I.D. ×150 mm, 3 µm particle size, 120 Å pore size, AB SCIEX) by switching the valve. The eluents used were: (A) 100% water containing 0.1% formic acid and (B) 100% acetonitrile contain-ing 0.1% formic acid. The column was developed at a flow rate of 0.5 μl min–1 with the following concentration gradient of acetonitrile: from 2% B to 32% B in 100 min, 32% B to 80% B in 1 min, sustain-ing 80% B for 10 min, from 80% B to 2% B in 1 min, and finally re-equilibrating with 2% B for 15 min. Mass spectra and tandem mass spectra were recorded in positive-ion and ‘high-sensitivity’ mode with a resolution of ~35 000 full-width half-maximum. The nanospray nee-dle voltage was typically 2 300 V in HPLC-MS mode. After the acqui-sition of approximately six samples, TOF MS spectra and TOF MS/ MS spectra were automatically calibrated during dynamic LC-MS and MS/MS autocalibration acquisitions by injecting 50 fmol BSA. The Analyst TF1.6 system (AB SCIEX) was used to record peptide spectra over the mass range of m/z 400–1250, and MS/MS spectra in information-dependent data acquisition over the mass range of m/z 100–1600. For CID-MS/MS, the mass window for precursor ion selection of the quadrupole mass analyser was set to 0.7 ± 0.1 Da. The precursor ions were fragmented in a collision cell using nitrogen as the collision gas. Advanced information-dependent acquisition (IDA) was used for MS/MS collection on the TripleTOF 5600+ to obtain MS/MS spectra for the 20 most abundant parent ions following each survey MS1 scan (250 ms acquisition time per MS1 scan, and typi-cally 100 ms acquisition time per MS/MS). Dynamic exclusion fea-tures were based on m/z value and were set to an exclusion mass width of 50 mDa and an exclusion duration of 12 s.
Searches were performed by using the Mascot server version 2.4.0 (Matrix Science, MA, USA) against the latest Swissprot database for protein identification. Search parameters were set as follows: the enzyme selected was used with three maximum missing cleavage sites, species limited to Arabidopsis thaliana (thale cress), a mass tolerance of 45 ppm for peptide tolerance, 0.1 Da for MS/MS tolerance, fixed modification of carbamidomethyl (C), and variable modification of oxidation (M). The maximum expectation value for accepting indi-vidual peptide ion scores [−10*Log(P)] was set to ≤0.05, where P is the probability that the observed match is a random event. Protein identification and modification information returned from Mascot were manually inspected and filtered to obtain confirmed protein identification and modification lists of CID MS/MS.
Results and discussion
Visualization of endogenous genomic sequences of A. thaliana with fluorescent TALEs
To image endogenous genomic sequences in plant nuclei, we designed a TALE protein fused with a FP (TALE-FP) (Fig. 1A). We first investigated the localization of centromeres by targeting the 180 bp centromeric repeats known as pAL1 (Fig. 1B). This sequence belongs to the major centromeric sat-ellite, forms tandem arrays approximately 2 Mbp in length, and occupies the centromeric regions of all chromosomes in A. thal-iana (Copenhaver et al., 1999; Haupt et al., 2001). Such repeti-tive sequences permit the recruitment of multiple molecules of TALE-FP to the same locus. To construct TALEs that recognize 17 nt of the 180 bp centromeric repeat sequence (TALE_180) (Supplementary Table S1), we cloned DNA encoding these TALEs into a vector with an in-frame fusion to a FP under the RPS5a promoter. A. thaliana was transformed with these con-structs using the floral dip method. Figure 1C (top) shows the root of a transformant stably expressing TALE_180-GFP. Ten discrete signals were usually detected in each nucleus of meris-tematic root cells, each presumably corresponding to one of the 10 centromeres of A. thaliana chromosomes (Fig. 1C).
To address whether the TALE-FP system can be used to visualize other repetitive genomic sequences, we next designed TALEs targeting the C-strand or G-strand of the telomeres, the 18S rDNA, or the 5S rDNA repeats (Fig. 1D–
F; Supplementary Table S1) and fused them to FPs (TALE_ telo C-tdTomato, TALE_telo G-GFP, TALE_18S-Venus, and TALE_5S-GFP, respectively). We detected small, dot-like signals presumably corresponding to telomeres in cells expressing either of the TALE_telo-FP fusions (Fig. 1D). In addition to small dot-like signals, two strong signals were observed in cells expressing TALE_telo G-GFP. We con-structed a transgenic line expressing TALE_telo C-GFP, where we detected only weak signals of TALE_telo C-GFP. Thus, we constructed TALE_telo C-tdTomato, which is a red fluorescent protein that forms tandem dimers, and could detect TALE_telo C-tdTomato signals (Fig. 1D). However, the signal intensity of TALE_telo C-tdTomato was less than that observed in lines expressing TALE_telo G-GFP, despite repeated rounds of selection to isolate transgenic lines with strong expression of the TALE_telo C-tdTomato.
Therefore, to enhance the signal, we constructed a 3×GFP fusion for TALE_telo C visualization. TALE_telo
Fig. 1. Visualization of endogenous genomic sequences with fluorescent TALEs in A. thaliana. (A) Schematic illustration of TALE_180-GFP for centromere visualization of A. thaliana. (B) Schematic illustration of the distribution of repetitive sequences on five chromosomes in A. thaliana. Two TALEs,
recognizing the telomere G strand (TALE_telo_G) and C strand (TALE_telo_C), respectively, were used for telomere visualization. (C) A fluorescent image of the root of a transgenic line stably expressing TALE_180-GFP. The image is a projection image. The root was counterstained with propidium iodide which stains cell walls magenta (top). The left region exhibits a root tip. Two meristematic cells are shown in a magnified image (bottom). (D) Fluorescent images of nuclei expressing TALE_telo_G-GFP (top), TALE_telo_C-tdTomato (middle), and TALE_telo_C-3× GFP (bottom). The distribution of TALE_telo signals in a nucleus is shown in the graph (right). n=33 (TALE_telo G-GFP), 27 (TALE_telo C-tdTomato) and 25 (TALE_telo C-3×GFP). (E) Fluorescent images of nuclei expressing TALE recognizing 18S rDNA with Venus (top). The distribution of TALE_18S-Venus signals in a nucleus is shown in the graph (bottom). n=43. (F) Fluorescent images of nuclei expressing TALE recognizing 5S rDNA with GFP. Arrowheads indicate 5S rDNA signals (top). The distribution of TALE_5S-GFP signals in a nucleus (bottom). n=30. White dot lines indicate nuclear membranes. Scale bars, 5 μm.
C-3×GFP exhibited signal intensities comparable with TALE_telo G-GFP (Fig. 1D). This improvement demon-strated that the use of tandemly repeated FPs, at least up to trimers, is useful to enhance TALE-FP signals. All TALE_ telo-FPs showed signal numbers lower than the expected maximum number (20 signals) per nucleus. Because FISH, using probes directed against telomeric repeats, also shows a similar distribution of signals (Schubert et al., 2012), it is possible that close physical association of telomeres in A. thaliana (Feng et al., 2014) reduces the number of dis-crete signals that were observed, rather than a shortcoming in our method.
We also used fluorescent TALE fusions to observe rDNA repeats. When we visualized the 18S rDNA with TALE_18S-Venus, one to four bright signals were observed around the nucleoli (Fig. 1E). In the case of TALE_5S-GFP-mediated visualization, we observed three to six weak signals in the nuclei (Fig. 1F). This distribution of signal intensity of TALE-FP fusions specific for rDNA is consistent with the fact that 18S rDNA genes are located on chromosomes 2 and 4 (Murata et al., 1997; Fransz et al., 2002) while 5S rDNA genes are near the centromeres of chromosomes 3, 4, and 5 (Murata et al., 1997; Cloix et al., 2000).
Some of our transgenic lines exhibited background fluores-cence in the nucleoli or throughout the cytoplasm which may
have been derived from unbound or off-target TALE-FPs. To combat this, we performed repeated selection to recover lines with an improved signal-to-noise ratio. Transgenic lines with highly expressed and specifically localized TALE_180-GFP were readily recovered but lines expressing TALE_rDNAs with low background were more difficult to acquire.
Confirmation of plant TALE-FP localization by immunofluorescence and FISH
To verify the specific recognition of centromeres and telomeres by TALE-FP, we performed immunofluorescence and FISH to detect the repeat sequences. We analysed the centromere distribution by immunofluorescence using an anti-CENH3 antibody (Fig. 2A) or FISH using a 180 bp repeat sequence as a probe (Fig. 2B). The centromere signals were widely dis-persed and peripherally located in nuclei as reported by FISH (Armstrong et al., 2001). The signals were co-localized with the signals of TALE_180-GFP. The distribution of telomeres was analysed by FISH using the telomere repeat sequence as a probe. FISH experiments previously reported that telomere signals of A. thaliana were mainly clustered around the nucle-olus (Armstrong et al., 2001). TALE_telo G and TALE_telo C signals were also distributed around the nucleolus and merged images showed that TALE_telo-FPs co-localized
Fig. 2. Confirmation of TALE-FP localization by immunostaining and FISH. (A) Fluorescent images of TALE_180-GFP and CENH3 immunostaining in a nucleus of an A. thaliana root cell expressing TALE_180-GFP. (B) Fluorescent images of GFP immunostaining signals and FISH signals targeting 180 bp centromeric repeats in a nucleus of A. thaliana expressing TALE_180-GFP. (C) Fluorescent images of GFP immunostaining signals and FISH signals recognizing telomere repeats in a nucleus of A. thaliana expressing TALE_ telo G-GFP (top) or telo C-3×GFP (bottom). Arrowheads indicate the co-localization of the GFP and telomere signals. (D) Live cell imaging for TALEs recognizing 180 bp centromeric repeats (TALE_180-GFP) and CENH3 (tdTomato). (E) The fluorescent image of a nucleus of living A. thaliana expressing both TALE_180-tdTomato and TALE_telo G-GFP. Numbers in the 180 bp panel denote the rank of the signal intensity. Yellow and red numbers indicate TALE_180-tdTomato signals co-localized with or without TALE_telo G-GFP, respectively. Scale bars in (A)–(E), 5 μm. (F) Distribution of the number of TALE_180-tdTomato signals in a nucleus. n=30. (G) Rank of the signal intensity of TALE_180-tdTomato co-localized with telomere signals. Rank 1 is the strongest signal out of 10 TALE_180-tdTomato signals. n=30.
with the telomeres (Fig. 2C). Taken together, these results suggest that TALE-FPs are capable of performing reliable imaging of endogenous repetitive sequences in plants.
TALE-FPs also permit multiple colour imaging of genomic sequences. For imaging of centromeric DNA and a centromeric protein at the same time, we observed A. thali-ana roots simultaneously expressing CENH3-tdTomato and TALE_180-GFP. In A. thaliana, CENH3 is a centromere-specific histone H3 variant that co-localizes with the 180 bp repetitive sequences of all centromeres (Talbert et al., 2002). Even though TALE_180-GFP co-localizes with CENH3, the signal intensity of TALE_180-GFP is not always consistent with that of CENH3 (Fig. 2D). This difference is presumably because TALE_180-GFP binds to both the core centromeric region as well as the pericentromeric region. Most CENH3 is thought to bind to 180 bp repeats (Nagaki et al., 2003); however, some clusters of 180 bp repeats, particularly those that are long, are not fully occupied by CENH3 (Shibata and Murata, 2004). Previously, the lengths of the 180 bp tandem repeats on each chromosome were estimated to be 2.26 Mbp (chromosome 1) to 1.4 Mbp (chromosome 3) from FISH experiments (Haupt et al., 2001).
Next, we observed cells simultaneously expressing TALE_180-tdTomato and TALE_telo G-GFP. The strong signals associated with TALE_telo G-GFP were partially co-localized with TALE_180-tdTomato (Fig. 2E). The intensity of signals of TALE_180-tdTomato was compared among the nuclei of root meristematic cells. The 180 bp signal intensity observed in centromeres associated with TALE_telo G is rela-tively high compared with those in other centromeres (Fig. 2F, G). Centromeric regions often contain long interstitial tel-omere sequences (ITSs) which consist of imperfect teltel-omere- telomere-like repeats. A. thaliana has 349 kb ITSs within the centromere of chromosome 1 (Richards et al., 1991; Armstrong et al., 2001;
Vannier et al., 2009). Telomere-associated proteins are specific for telomeres versus ITSs, suggesting that ITSs have no func-tional similarity with telomeres (Song et al., 2008; Surovtseva et al., 2009). The TALE_telo localizes not only to telomeres but also ITSs as TALE_telo associates with 2.6 telomeric repeats (Supplementary Table S1). Thus, we conclude that the bright spots observed in cells expressing TALE_telo G are the ITSs on chromosome 1. Moreover, the signals associated with the180 bp repeats of chromosome 1 are larger in area than those for other chromosomes which is consistent with previ-ous studies of the 180 bp centromeric repeats by FISH (Haupt et al., 2001). TALE_telo C and TALE_telo G are targeted to
CCCTAAA and TTTAGGG repeats, respectively. Not only CG but also CHG and CHH are methylated in plant genomes. Furthermore, plant heterochromatin is enriched in methylated cytosines, in particular, methylated CHH (Vaquero-Sedas and Vega-Palas, 2014; Widman et al., 2009). RVD HD shows a pref-erence for cytosines, but not for methylated cytosines (Valton et al., 2012). Therefore, targeting to the interstitial telomere sequences of TALE_telo C seems to be diminished compared with that of TALE_telo G. As a result of the application of different TALE repeats, the pattern of fluorescent signals was different between TALE_telo C and TALE_telo G.
Identification of TALE-GFP binding histones by IP-MS Recently, engineered DNA-binding molecule-mediated chro-matin immunoprecipitation (enChIP) was developed for the purification of specific genomic regions using TALE (Fujita et al., 2013). To confirm that our TALE-GFP fusions specifi-cally interact with centromeres or telomeres, a GFP-trap was used to immunoprecipitate TALE-GFP interacting histones from whole extracts prepared from seedlings. As TALE_telo G exhibited association with ITSs, we used only TALE_telo C for the identification of telomere-associated histones. Mass spectrometry confirmed the presence of various histones (Table 1). Compared with the population of histones asso-ciated with TALE_telo C, TALE_180-assoasso-ciated histones were enriched for CENH3. Furthermore, histone H1 enrich-ment is less for TALE_telo C than for TALE_180. These data suggest that TALE_180 localizes to centromeres. Consistent with this, previous studies demonstrate that histone H1 binds to the compacted nucleosomal arrays of telomeres but with reduced stoichiometry relative to other genomic regions in A. thaliana (Ascenzi and Gantt, 1999).
Live observation of centromere and telomere dynamics in vivo
One of the advantages of plant TALE-FP is that it permits the analysis of chromatin organization in nuclei without dis-rupting the cell wall or permeabilizing the cell membrane dur-ing fixation like FISH. To ascertain whether plant TALE-FP is effective in various organs, we observed the signals of TALE_180-GFP in nuclei of cells in various organs. Clear and distinct fluorescent signals derived from TALE_180-GFP were observed in the nuclei of various organs includ-ing roots, hypocotyls, leaves, and floral organs (Fig. 3A).
Table 1. Histones co-immunoprecipitated with TALE–FPs
Histone TALE_180 TALE_telo C
Peptide hits Unique peptides Peptide hits Unique peptides
H1 34 6 3 1 H2A 61 17 27 10 H2B 83 7 20 4 H3 38 5 26 4 H4 65 8 35 5 CENH3 3 3 0 0
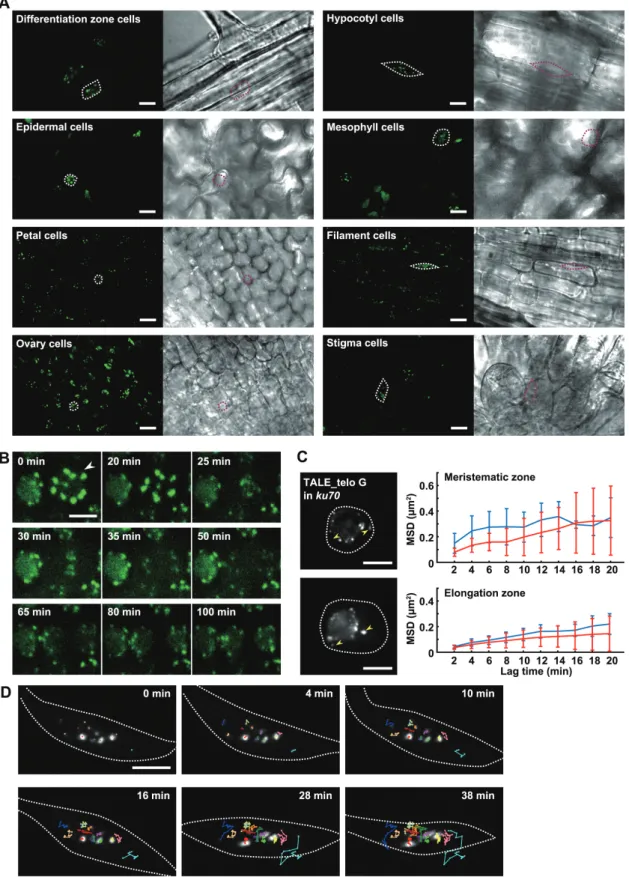
Fig. 3. Live cell imaging of TALE-FPs in living tissues of A. thaliana. (A) Fluorescent images of TALE_180-GFP in nuclei of epidermal cells in the differentiation zone of a root, epidermal cells of a hypocotyl, epidermal cells on the abaxial side of a cotyledon, mesophyll cells of a cotyledon, epidermal cells of a petal, epidermal cells of a filament, epidermal cells of an ovary, and epidermal cells of a stigma. Each right-hand panel shows a phase contrast image. Scale bars, 10 μm. (B) Dynamics of TALE_180-GFP through mitosis in cells of the meristematic region of roots. The fluorescent images are constructed by maximum intensity projection. Arrowheads indicate a mitotic cell. (C) Fluorescent images of TALE_telo G-GFP in cells in meristematic (upper) and elongation (lower) zones of the root expressing TALE_telo G-GFP in ku70 (left). Based on tracking analyses of TALE_telo G-GFP signals, the average of the MSD of each signal from single cells is shown with the standard deviation (right). The red and blue lines indicate signals associated with and without the nucleolus, respectively. White dotted lines indicate nuclear membranes. Yellow arrowheads indicate signals detached from the nucleolus. (D) Telomere dynamics in a root hair cell expressing TALE_telo C-tdTomato in ku70. The white dotted lines indicate nuclear membranes. Tracking lines of each TALE_telo C signal are shown by different colours. The images are constructed by maximum intensity projection. Scale bars in (B)–(D), 5 μm.
The fluorescence intensity of TALE-FP varies across plant organs unlike that observed in animal cultured cells because the nuclear size and morphology can be dynamically changed by endoreduplication and vacuole expansion (Matsunaga et al., 2013). In addition, the intensity of TALE-FP signals is influenced by light scattering and absorption dependent on the imaging depth, unlike the flat cultured cells that adhere to dishes.
Plant TALE-FP also allows tracking of native chromatin mobility in living cells without inserting artificial reporter DNA sequences in the genome. We next analysed the chro-matin dynamics throughout the cell cycle by time-lapse imag-ing of cells expressimag-ing TALE_180-GFP. TALE_180-GFP accumulates at centromeric regions throughout mitosis, albeit at diminished levels from prometaphase to telophase (Fig. 3B;see Supplementary Movie S1 at JXB online). The diminishment on mitotic chromosomes suggests that chroma-tin compaction may prevent the binding of TALE-GFP to its target sequences. As mentioned above, telomeric repeats could be detected using TALE-FP fusions that specifi-cally recognize telomeres but the signal intensity was insuf-ficient for time-lapse imaging. Ku70 mutants of A. thaliana deregulate the control of telomere length resulting in elon-gation of telomeres to 20 kbp (Bundock et al., 2002; Riha et al., 2002). When TALE_telo FPs were expressed in ku70 plants, the signals were stronger than in wild-type plants (Fig. 3C; Supplementary Fig. S3). The signals were observed as distinct puncta around the nucleolar periphery with low observable background signals in the nucleoplasm (Fig. 3C;
Supplementary Fig. S3). This suggests that the elongation of telomeres increases the binding of TALE_telo FPs with tel-omeres which increases the signal-to-noise ratio. Using the ku70 background, the mean-squared displacement (MSD) of telomeres was determined in meristematic cells and cells of the elongation zone of roots. Time-lapse observation of TALE_ telo G-GFP in root cells shows that the movement of telomere signals differed slightly between nuclei. The movement of tel-omere signals was dependent on association with the nucleo-lus (Fig. 3C; Supplementary Fig. S3; Supplementary Movie S2). Observation of TALE_telo C-tdTomato in a nucleus of a root hair cell demonstrates that the mobility of each tel-omere was different. In addition, a few teltel-omeres temporarily formed a cluster (Fig. 3D; Supplementary Movie S3), dem-onstrating the telomere association described in Fig. 1D. To our knowledge, this is the first report of telomere dynamics in living plants.
Here, we report for the first time the successful construction of stable transgenic lines to visualize endogenous genomic loci in a living multicellular organism using TALE-FPs. These stable lines do not need the injection of TALE-FPs and retain the signal intensity even after long time-lapse observation fol-lowing repeated cell divisions during organ development and differentiation. This method overcomes the limitations of previous chromatin analyses by FISH, such as the fixation of nuclei, hybridization with DNA probes, and permeabilization of cell walls. The observation of plant TALE-FPs without the isolation or squashing of nuclei enables us to analyse chroma-tin dynamics in three- or four-dimensions in several organs
while retaining plant morphology. The convenient distribu-tion of seeds of stably transgenic lines will contribute to pro-gress in the analyses of chromatin dynamics in the nuclei of multicellular organs and tissues. Therefore, plant transgenic lines expressing TALE-FPs will be a powerful tool to inves-tigate spatiotemporal chromatin organization during various events including development, fertilization, environmen-tal responses, and microbe interaction. Further refinement of genome visualization with genome editing techniques in plants will permit the monitoring of single loci, mutation sites, and nucleotide polymorphisms which is essential for epigenetic analyses and molecular breeding.
Supplementary data
Supplementary data can be found at JXB online.
Figure S1. Nucleotide sequence of pCE-N-GFP.
Figure S2. Construction of TALE-FP expression vector.
Figure S3. Maximum intensity projections of TALE_telo G-GFP.
Table S1. Target sequences of TALE-FP.
Movie S1. Time-lapse observation of 180 bp repeats through mitosis every 5 min in root meristematic cells.
Movie S2. Time-lapse observation of telomere repeats in a root elongation zone cell.
Movie S3. Time-lapse observation of telomere repeats in a root hair cell.
Acknowledgements
We thank Fukashi Shibata (Ehime University) for technical advice for FISH experiments and Yoshie Hayashi for technical assistance. This work was supported by CREST grants from the Japan Science and Technology Agency (to SM); Grants-in-Aid for Scientific Research from the Ministry of Education, Culture, Sports, Science and Technology and the Japan Society for the Promotion of Science (grant numbers JP25120726, JP26291067, JP15H05962, JP15H05955 to SM).
References
Armstrong SJ, Franklin FC, Jones GH. 2001. Nucleolus-associated telomere clustering and pairing precede meiotic chromosome synapsis in Arabidopsis thaliana. Journal of Cell Science 114, 4207–4217.
Ascenzi R, Gantt JS. 1999. Subnuclear distribution of the entire complement of linker histone variants in Arabidopsis thaliana. Chromosoma 108, 345–355.
Boch J, Scholze H, Schornack S, Landgraf A, Hahn S, Kay S, Lahaye T, Nickstadt A, Bonas U. 2009. Breaking the code of DNA binding specificity of TAL-type III effectors. Science 326, 1509–1512. Bundock P, van Attikum H, Hooykaas P. 2002. Increased telomere length and hypersensitivity to DNA damaging agents in an Arabidopsis KU70 mutant. Nucleic Acids Research 30, 3395–3400.
Cermak T, Doyle EL, Christian M, Wang L, Zhang Y, Schmidt C, Baller JA, Somia NV, Bogdanove AJ, Voytas DF. 2011. Efficient design and assembly of custom TALEN and other TAL effector-based constructs for DNA targeting. Nucleic Acids Research 39, e82.
Cloix C, Tutois S, Mathieu O, Cuvillier C, Espagnol MC, Picard G, Tourmente S. 2000. Analysis of 5S rDNA arrays in Arabidopsis thaliana: physical mapping and chromosome-specific polymorphisms. Genome Research 10, 679–690.
Clough SJ, Bent AF. 1998. Floral dip: a simplified method for
Agrobacterium-mediated transformation of Arabidopsis thaliana. The Plant Journal 16, 735–743.
Cobbe N, Heck MM. 2000. Review: SMCs in the world of chromosome biology—from prokaryotes to higher eukaryotes. Journal of Structural Biology 129, 123–143.
Copenhaver GP, Nickel K, Kuromori T, et al. 1999. Genetic definition and sequence analysis of Arabidopsis centromeres. Science 286, 2468–2474.
Curtis MD, Grossniklaus U. 2003. A gateway cloning vector set for high-throughput functional analysis of genes in planta. Plant Physiology 133, 462–469.
Feng S, Cokus SJ, Schubert V, Zhai J, Pellegrini M, Jacobsen SE. 2014. Genome-wide Hi-C analyses in wild-type and mutants reveal high-resolution chromatin interactions in Arabidopsis. Molecular Cell 55, 694–707.
Franklin AE, Cande WZ. 1999. Nuclear organization and chromosome segregation. The Plant Cell 11, 523–534.
Fransz P, De Jong JH, Lysak M, Castiglione MR, Schubert I. 2002. Interphase chromosomes in Arabidopsis are organized as well defined chromocenters from which euchromatin loops emanate. Proceedings of the National Academy of Sciences, USA 99, 14584–14589.
Fujimoto S, Matsunaga S, Yonemura M, Uchiyama S, Azuma T, Fukui K. 2004. Identification of a novel plant MAR DNA binding protein localized on chromosomal surfaces. Plant Molecular Biology 56, 225–239. Fujita T, Asano Y, Ohtsuka J, Takada Y, Saito K, Ohki R, Fujii H. 2013. Identification of telomere-associated molecules by engineered DNA-binding molecule-mediated chromatin immunoprecipitation (enChIP). Scientific Reports 3, 3171.
Gaj T, Gersbach CA, Barbas CF. 2013. ZFN, TALEN, and CRISPR/ Cas-based methods for genome engineering. Trends in Biotechnology 31, 397–405.
Gámez-Arjona FM, López-López C, Vaquero-Sedas MI, Vega-Palas MA. 2010. On the organization of the nucleosomes associated with telomeric sequences. Biochimica et Biophysica Acta 1803, 1058–1061. Hans de Jong J, Fransz P, Zabel P. 1999. High resolution FISH in plants—techniques and applications. Trends in Plant Science 4, 258–263. Haupt W, Fischer TC, Winderl S, Fransz P, Torres-Ruiz RA. 2001. The centromere1 (CEN1) region of Arabidopsis thaliana: architecture and functional impact of chromatin. The Plant Journal 27, 285–296.
Hirakawa T, Katagiri Y, Ando T, Matsunaga S. 2015. DNA double-strand breaks alter the spatial arrangement of homologous loci in plant cells. Scientific Reports 5, 11058.
Kato N, Lam E. 2001. Detection of chromosomes tagged with green fluorescent protein in live Arabidopsis thaliana plants. Genome Biology 2, RESEARCH0045.
Kurz A, Lampel S, Nickolenko JE, Bradl J, Benner A, Zirbel RM, Cremer T, Lichter P. 1996. Active and inactive genes localize preferentially in the periphery of chromosome territories. The Journal of Cell Biology 135, 1195–1205.
Laemmli UK. 1970. Cleavage of structural proteins during the assembly of the head of bacteriophage T4. Nature 227, 680–685.
Lindhout BI, Fransz P, Tessadori F, Meckel T, Hooykaas PJ, van der Zaal BJ. 2007. Live cell imaging of repetitive DNA sequences via GFP-tagged polydactyl zinc finger proteins. Nucleic Acids Research 35, e107. Ma H, Naseri A, Reyes-Gutierrez P, Wolfe SA, Zhang S, Pederson T. 2015. Multicolor CRISPR labeling of chromosomal loci in human cells. Proceedings of the National Academy of Sciences, USA 112, 3002–3007.
Ma H, Reyes-Gutierrez P, Pederson T. 2013. Visualization of repetitive DNA sequences in human chromosomes with transcription activator-like effectors. Proceedings of the National Academy of Sciences, USA 110, 21048–21053.
Matsunaga S, Katagiri Y, Nagashima Y, Sugiyama T, Hasegawa J, Hayashi K, Sakamoto T. 2013. New insights into the dynamics of plant cell nuclei and chromosomes. International Review of Cell and Molecular Biology 305, 253–301.
Matzke AJ, Huettel B, van der Winden J, Matzke M. 2005. Use of two-color fluorescence-tagged transgenes to study interphase chromosomes in living plants. Plant Physiology 139, 1586–1596. Mérai Z, Chumak N, García-Aguilar M, et al. 2014. The AAA-ATPase molecular chaperone Cdc48/p97 disassembles sumoylated centromeres, decondenses heterochromatin, and activates ribosomal
RNA genes. Proceedings of the National Academy of Sciences, USA 111, 16166–16171.
Misteli T. 2007. Beyond the sequence: cellular organization of genome function. Cell 128, 787–800.
Miyanari Y, Ziegler-Birling C, Torres-Padilla ME. 2013. Live visualization of chromatin dynamics with fluorescent TALEs. Nature Structural & Molecular Biology 20, 1321–1324.
Moscou MJ, Bogdanove AJ. 2009. A simple cipher governs DNA recognition by TAL effectors. Science 326, 1501.
Murata M, Heslop-Harrison JS, Motoyoshi F. 1997. Physical mapping of the 5S ribosomal RNA genes in Arabidopsis thaliana by multi-color fluorescence in situ hybridization with cosmid clones. The Plant Journal 12, 31–37.
Nagai T, Ibata K, Park ES, Kubota M, Mikoshiba K, Miyawaki A. 2002. A variant of yellow fluorescent protein with fast and efficient maturation for cell-biological applications. Nature Biotechnology 20, 87–90.
Nagaki K, Talbert PB, Zhong CX, Dawe RK, Henikoff S, Jiang J. 2003. Chromatin immunoprecipitation reveals that the 180-bp satellite repeat is the key functional DNA element of Arabidopsis thaliana centromeres. Genetics 163, 1221–1225.
Nakagawa T, Suzuki T, Murata S, et al. 2007. Improved gateway binary vectors: high-performance vectors for creation of fusion constructs in transgenic analysis of plants. Bioscience, Biotechnology, and Biochemistry 71, 2095–2100.
Richards EJ, Goodman HM, Ausubel FM. 1991. The centromere region of Arabidopsis thaliana chromosome 1 contains telomere-similar sequences. Nucleic Acids Research 19, 3351–3357.
Riha K, Watson JM, Parkey J, Shippen DE. 2002. Telomere length deregulation and enhanced sensitivity to genotoxic stress in Arabidopsis mutants deficient in Ku70. The EMBO Journal 21, 2819–2826.
Robinett CC, Straight A, Li G, Willhelm C, Sudlow G, Murray A, Belmont AS. 1996. In vivo localization of DNA sequences and visualization of large-scale chromatin organization using lac operator/ repressor recognition. The Journal of Cell Biology 135, 1685–1700. Rosenfeld J, Capdevielle J, Guillemot JC, Ferrara P. 1992. In-gel digestion of proteins for internal sequence analysis after one- or two-dimensional gel electrophoresis. Analytical Biochemistry 203, 173–179. Rosin FM, Watanabe N, Cacas JL, et al. 2008. Genome-wide transposon tagging reveals location-dependent effects on transcription and chromatin organization in Arabidopsis. The Plant Journal 55, 514–525. Schubert V, Berr A, Meister A. 2012. Interphase chromatin organisation in Arabidopsis nuclei: constraints versus randomness. Chromosoma 121, 369–387.
Shaner NC, Campbell RE, Steinbach PA, Giepmans BN, Palmer AE, Tsien RY. 2004. Improved monomeric red, orange and yellow fluorescent proteins derived from Discosoma sp. red fluorescent protein. Nature Biotechnology 22, 1567–1572.
Shibata F, Murata M. 2004. Differential localization of the centromere-specific proteins in the major centromeric satellite of Arabidopsis thaliana. Journal of Cell Science 117, 2963–2970.
Song X, Leehy K, Warrington RT, Lamb JC, Surovtseva YV, Shippen DE. 2008. STN1 protects chromosome ends in Arabidopsis thaliana. Proceedings of the National Academy of Sciences, USA 105, 19815–19820.
Surovtseva YV, Churikov D, Boltz KA, Song X, Lamb JC, Warrington R, Leehy K, Heacock M, Price CM, Shippen DE. 2009. Conserved telomere maintenance component 1 interacts with STN1 and maintains chromosome ends in higher eukaryotes. Molecular Cell 36, 207–218. Talbert PB, Masuelli R, Tyagi AP, Comai L, Henikoff S. 2002. Centromeric localization and adaptive evolution of an Arabidopsis histone H3 variant. The Plant Cell 14, 1053–1066.
Thanisch K, Schneider K, Morbitzer R, Solovei I, Lahaye T, Bultmann S, Leonhardt H. 2014. Targeting and tracing of specific DNA sequences with dTALEs in living cells. Nucleic Acids Research 42, e38. Tirichine L, Andrey P, Biot E, Maurin Y, Gaudin V. 2009. 3D fluorescent in situ hybridization using Arabidopsis leaf cryosections and isolated nuclei. Plant Methods 5, 11.
Valton J, Dupuy A, Daboussi F, Thomas S, Maréchal A, Macmaster R, Melliand K, Juillerat A, Duchateau P. 2012. Overcoming
transcription activator-like effector (TALE) DNA binding domain sensitivity to cytosine methylation. The Journal of Biological Chemistry 287, 38427–38432.
Vannier JB, Depeiges A, White C, Gallego ME. 2009. ERCC1/XPF protects short telomeres from homologous recombination in Arabidopsis thaliana. PLoS Genetics 5, e1000380.
Vaquero-Sedas MI, Vega-Palas MA. 2014. Determination of Arabidopsis thaliana telomere length by PCR. Scientific Reports 4, 5540.
Weijers D, Franke-van Dijk M, Vencken RJ, Quint A, Hooykaas P, Offringa R. 2001. An Arabidopsis Minute-like phenotype caused by a semi-dominant mutation in a RIBOSOMAL PROTEIN S5 gene. Development 128, 4289–4299.
Widman N, Jacobsen SE, Pellegrini M. 2009. Determining the conservation of DNA methylation in Arabidopsis. Epigenetics 4, 119–124. Yuan K, Shermoen AW, O’Farrell PH. 2014. Illuminating DNA replication during Drosophila development using TALE-lights. Current Biology 24, R144–145.