講義の内容
• 海洋科学研究に、どのような放射性核
種が取り上げられたか。
• 日本における海洋放射能研究の歴史
• 海洋の物理的循環のトレーサー
• 海洋の生物地球化学的トレーサー
• 福島事故に付いて
海洋の物質の動態の研究で
取り上げられた放射性核種
• 天然の放射性核種 ウラン、トリウム系列核種 238U, 234U, 232Th, 234Th, 228Th, 210Pb, 40K, 226Ra 自然界で生成する放射性核種 3H, 14C, 7Be, 10Be • 人工の放射性核種 大気圏(水圏)核実験起源放射性核種137Cs, 90Sr, plutonium isotopes, 241Am, (3H, 14C)
その他 (再処理廃液、原子力艦廃液、原子炉事故など)
Chemical properties of elements in
the ocean
• Conservative : vertically no change, good correlation with salinity. (longer oceanic residence time: >105 years)
Cs (2.2 nmol/kg), K(10.2 mmol/kg), U(13 nmol/kg) Dissolved form: Cs+, K+, UO
2(CO3)34-
• Slight surface depression (longer oceanic residence time: >106
years)
Sr(90 µmol/kg), Ca(10.2 mmol/kg) Dissolved form: Sr2+, Ca2+
• No-conservative (plutonium isotopes, 241Am) (short
oceanic residence time: 103-104 years)
Nutrient-type: Ag(0.5-35 pmol/kg), I (0.2-0.5 µmol/kg)
Tracers of metal cycling in the
ocean
• Radionuclides reflect behaviors of corresponding
stable elements.
137Cs è Cs, 90Sr è Sr, 60Co è Co
• Advection and diffusion processes è137Cs, 3H
• Mineralization and dissolution è SrSO4, CaCO3
• Biogeochemical processes; biological uptake (organic complexation), sinking of biogenic particle, and
remineralization in deep water due to bacterial
decomposition è Th isotopes, Pu isotopes, 241Am
Cs – clay mineral interaction in coastal water Cs – organic matter interaction
137Cs: 1Bq/kg =1.37x10⁹n/kg=2.28 fmol/kg 90Sr: 1Bq/kg =1.31x10⁹n/kg=2.2 fmol/kg
日本における海洋放射能研究
項目 1954 ビキニ環礁の水爆実験 2. 28 Bravo test (15 Mt: 1 MtはTNTで106トン) 1960年代 大規模大気圏核実験によるグローバルフォールアウト 1970年代 主に英国等による放射性廃棄物の海洋投棄 再処理施設などから液体状放射性物質の海洋放出 1993年 ロシア(旧ソ連)による放射性廃棄物の海洋投棄公表 海洋放射能の国際協同調査 2011年 福島事故による海洋放射能汚染
ビキニ環礁における核実験による周辺海域の放射能汚染 2000 cpm/L ≈ 440 Bq/L 440 kBq m-3 最大:7025 cpm/l ≈ 1.5 kBq/l 1.5 MBq m-3 海洋放射能調査 (1954年5月から7月, 俊鶻丸 航海) 当時は核種分析はできなかった。
137Cs (red) Bq m-2; 239,240Pu (blue) mBq m-2 気象研究所で観測された 137Cs and 239,240Pu降下量の時間変化I 137Cs 降下量 東京で福島事故の 直後に観測された 月間降下量
降下量の観測値、地表の沈着量、海洋の存在量に基づいて評
価された、1970年1月時点で10度メッシュごとの137Cs降下量
Aoyama et al., KEK meeting 2004
Unit : Bq m-2
北半球の 137Cs 総降下量
大気圏実験により北太平洋に降
下した
137
Cs の総量
• 1970年時点の北太平洋の
137Csの総量
290 PBq (=10
15Bq)
• 2000年代初頭の北太平洋の
137Csの総
量 (観測値から推定)
85 PBq
(放射壊変のみでは約
145PBq)
Estimated by Aoyama西部北太平洋亜熱帯循環表面水の137Cs濃度の時間変動
(Aoyama, M., Hirose, K. , TheScientificWorldJOURNAL, 4, 200-215, 2004 and update) Area 2 0.1 1 10 100 1950 1960 1970 1980 1990 2000 2010 1 3 7Cs / B q m -3 Year 137 Cs 濃度 Bq m -3
Sellafield (英国)核燃料再処理工場から放射性廃液のアイリッシュ海
への放出の歴史
137Csの年間最大放出は1975年にあった (5.23 PBq)。
最大 137Cs濃度は1974年にアイリッシュ海で観測された( 200 kBq m-3)
日韓露日本海協同調査
• 発端
1993年にロシア政府により、放射性廃棄物
の日本海等への投棄の実態が明らかにされた
。また、海洋投棄が実施された。
• 海産物の放射能汚染の懸念⇒海洋調査が必要
問題点
: 放射性物質の投棄海域がロシア
の経済水域であった
.
⇒ロシアとの協同調査が不可欠である。
結果の信頼性を担保するためには国際機関
(
IAEA
海洋環境研究所)の参加が不可欠で
ある
。
日本海の放射性廃棄物 投棄海域 総量 液体廃棄物 443 TBq 固体廃棄物 141 TBq 1994-5年 協同調査が実施 される。 放射性廃棄物の他 90Sr 燃料電池の 落下事故が起って いる。 1987.8 25 PBq 1997.8 1.3 PBq ●
第2回日韓露協同調査(オホーツク海、太平洋など) 日本側調査母体 海上保安庁水路部 気象研究所 水産庁中央水産研究所 日本原子力研究所 日本分析センター 韓国 韓国放射線安全院 韓国海洋開発研究所 ロシア 極東水理研究所 タイフーン研究所 IAEA モナコ海洋環境研究所
Vertical distribution of 137Cs
Concentration in radioactivity dumping areas in the Sea of Japan
Vertical distribution of plutonium
Concentration in radioactivity dumping areas in the Sea of Japan
Hirose et al., J. Environ.Radioact., 43, 1-13 (1999)
海洋の物理的循環のトレーサー
• 海洋の物理的測定(海流の流向・流速、
水温、塩分など)で分からない、長期に
わたる循環を知るためには、水と同じ動
きをする放射性物質が有効である。
• この目的のためには、海水中の保存性
分としての挙動を示す放射性核種であ
る必要がある。 例:
137Cs,
3H
Water collection on board Research Vessel in JMA Aフレーム Injection of 100 L
GoFlow Type sampler
Seawater sampling:
Large-volume sampling (more than 100 L)
Water sampling using a Rosette
Multi-bottle sampler
To collect water samples of each 20 liters from 36 different depth layers
Formation of bottom water In the North Atlantic
Direct evidence using tritium data for throughflow from the Pacific into the Indian Ocean. R.A. Fine, Nature, 315, 478 (1985).
First estimation by Wyrtki 2 Sv Following estimation 0 – 20 Sv This estimation 5 Sv 1 Sv (Sverdrup) = 106 m3s-1
Temporally integrated estimate of the Indonesian throughflow using tritium
Jean-Baptiste et. al.,Geopys. Res. Lett., 31,L21310
Estimation from Tritium budget Flow: 8.6 ±4 Sv
QoutIout(1989) – QinIin (1989-t)exp(-λt) = 0
J. Candela, “Meduterranean Water and Global Circulation”, Ocean circulation & climate, Vol. 77 of International Geophysics Series, Eds G. Siedler, J. Church, J. Gould, Acdemic Print, Spain, 2001.
北太平洋のそれぞれの海域の表面水の 137Cs濃度の時間変動
南太平洋のそれぞれの海域の表面水の 137Cs濃度の時間変動
è
ç
世界の海洋における表面水中の of 137Csの滞留半減時間 (2006 Revised) Effective half-life±1σ* Area Boxes 137Cs North Pacific 01-05 14 ± 3 Equatorial Pacific 06-07 23 ± 12 South Pacific 08-12 26 ± 11 All Pacific 01-12 21 ± 9 North Indian 15 20 ± 2+ South Indian 16-17 22 ± 6+ All Indian 15-17 20 ± 2+ North Atlantic 25+28 19 ± 4++ Central Atlantic 29 24 ± 6++ South Atlantic 30 20 ± 6++ All Atlantic 25-30 20 ± 3++ All Oceans 20 ± 10
Data in Red: This study
+: IAEA, Worldwide marine radioactivity studies (WOMARS) Radionuclide levels in oceans and seas, IAEA-TECDOC-1439, 104, 2005.
++: Povinec et al., 90Sr, 137Cs and 239,240Pu concentration surface water time series in the Pacific and Indian Oceans - WOMARS results, Journal of
Environmental Radioactivity 81 (1), 63-87, 2005. 60o N 60o S 30o S 0o 30o N 90o E 60o W 90o W 120o W 150o W 180o 150o E 120o E 15.4y 15.7y 17.9y 14.7y 31.0y 10.9y 13.9y 11.9y 30.3y 16.5y 33.0y 35.8y
100 1000 10000 -60 -40 -20 0 20 40 60
Temporal variation of 137Cs inventory
in the Pacific Ocean: decay corrected in 2003
1960s_corrected 1970s_corrected 1980s_corrected 1990s_corrected 2003 1 3 7 C s i n v e n t o r y / B q m -2 Latitude N Level of Fallout 137Cs 137 C s In ve nt ory (Bq m -2 ) 太平洋の137Csインベントリーの時間変化 (放射壊変は2003年に補正、インベントリー:単位 面積当りの水柱の総量)
福島事故以前の太平洋における
137
Cs濃度の空間分布
Fig. S1. 3-‐D 137Cs in the Pacific Ocean before Fukushima accident in 2011
Subduction of 137Cs
137Cs Bq m-3
南太平洋(30S)の海水中 137Cs 濃度の鉛直断面
2003-2004年みらいの航海で得られた。
Aoyama et al., Prog. Oceangr., 89, 7-16 (2011) Povinec et al., Prog. Oceangr., 89, 17-30 (2011)
熱塩循環:海水の密度変化により駆動される世界規模の海水の流れ. 海 水の密度は水温と塩分により決まる.
世界の海洋の熱塩循環:海洋のコンベアーベルト
気候変動(温暖化) ⇒ 海洋表層温度及び淡水化の増大 ⇒ 深層水形成の低下 ⇒ 海洋コンベアーベルトの停止 ⇒ 気候変動へフィードバック放射性セシウムの太平洋における
輸送の可能な経路
(最新の知見)
Fig. S2 Possible pathway of 137Cs in the Pacific Ocean
Biogeochemical Processes
• To know export flux
and mineralization
processes in the
twilight zone.
• To formulate
biogeochemical
processes for
modeling.
•
⇒
Future work
Plutonium as a biogeochemical
tracer:
Research on plutonium in the ocean
until the 1980s
• Level of
239,240Pu concentrations in the
oceanic waters
• Global distribution of
239,240Pu concentrations
in seawater
• Vertical distribution of
239,240Pu concentrations
in the open ocean water column
• Inventory of
239,240Pu in the water column
•
239,240Pu in sediment trap samples
Geographical distribution of 239,240Pu concentrations in surface
water
Miyake and Sugimura, 1976
Miyake et al., Pap. Meteor. Geophys., 39, 95-113 (1988)
Hirose and Aoyama, J. Environ. Radioactivity, 69, 53-60 (2003) )
North Pacific South Pacific
239,240Pu inventory in the Pacific water columns
Plutonium in sediment trap
samples
• Detection of plutonium in deep
sediment trap samples
Livingston and Anderson, Nature, 303, 228-230 (1983)
• Verification of rapid sinking processes
• Estimation of residence time of
plutonium in surface waters using
sediment trap data
Speciation of plutonium in
seawater
• Plutonium have several valence states in
natural waters. ⇒ Pu(III), Pu(IV), Pu(V),
Pu(VI)
• Complexation of plutonium with ligands
depends on the valence state. Pu(III), Pu(IV)
⇒strong complex; Pu(V), Pu(VI) ⇒ weak
complex
• Chemical form of plutonium in seawater
Dissolved form ⇒ Pu(V, VI)
Particulate form ⇒ Pu(III, IV)
The particulate metal concentrations correlate with the concentration of the strong
organic ligand in PM.
Hirose, Sci. Total Environ., 173/174, 195 (1995) Hirose and Aoyama, Anal. Bioanal. Chem. 372, 418 (2002)
Hirose et al., Deep-Sea Res II, 50, 2679 (2003) Hirose, TheScientificWorldJOURNAL, 4, 67 (2004)
Thorium Uranium
Plutonium
Plutonium exists Pu(IV) complex in marine particulates.
Trend of Ocean Plutonium
since 1990
• Analysis of temporal variation of
plutonium concentration in seawater
Surface
Vertical distribution
• Construction of database of plutonium
concentrations in seawater
• Reproduction of plutonium distribution
in the ocean due to OGCM model
The decrease rate of surface Pu differed from region to region.
Construction of database
Hirose and Aoyama,
Deep-Sea Res. II, 50, 2675-2700 (2003) Aoyama and Hirose,
TheScientificWorldJOURNAL, 4 , 200-215 (2004)
Reproduction of vertical distribution of plutonium by a simple scavenging model.
To predict increasing depth of Pu maximum layer.
Hirose, Radioprotection-Colloq., 32, C2-225-C2-230 (1997)
Temporal variations of vertical profiles of 239,240Pu in the North Pacific
Temporal change of Pu Maximum depth
Temporal change of Pu Inventory in water column Temporal change of
Tsumune et al., J. Environ. Radioactivity, 69, 61-84 (2003)
Reproduction of vertical profiles of plutonium from OGCM model
Fukushima Daiichi Nuclear
Power Plant Accident
• Six nuclear reactors exist in this area.
• Explosions due to hydrogen release occurred in outer housing of the first and third reactors. Explosions of the No.1 and No.3 reactors happened on 12 and 14 March, respectively. Explosion due to incomplete cooling of spent fuel pool in the No.4
reactor happened on 15 March. • As a result of meltdown of nuclear
fuels, large amounts of radioactivity have been released in the
atmosphere, which stated on 12 March 2011.
Detection of high radioactivity in seawater 131I 5 132I 2.1 137Cs 1.5 134Cs 1.5 136Cs 0.21 Unit: MBq m-3 Radionuclide concentrations in coastal seawater near
Nuclear reactors
collected in March 21.
First results (Sampling date: March 24) 131I 137Cs 24.9 16.4 30.0 11.2 76.8 24.1 37.3 18.2 54.7 12.7 42.0 12.8 29.0 15.3 39.4 15.2 Unit: kBq m-3
Temporal variation of 137Cs
concentrations in sea areas near Fukushima Daiichi NPP
Radioactivity emitted from
Fukushima Daiichi NPP
• Total amount of radioactivity emitted in the
atmosphere from No. 1, No. 2, and No. 3
reactors. (Major radioactivity emission
occurred in15−16, March 2011.)
640 PBq (Radioactive noble gases、
Radioiodine、Radiocesium and others)
131I 160 PBq (Chernobyl: 1800 PBq)
137Cs 15 PBq (Chernobyl: 86 PBq)
(Japanese government report)
What kinds of radionuclides were
released in atmosphere?
1. Major radionuclides:
Radioactive noble gases 133Xe (half life: 5.25d)
Radioiodine 131I (half life: 8.04d)
132Te-132I (half life: 78h)
Radiocesium 137Cs (half life: 30y)
134Cs (half life: 2.06y)
2. Minor radionuclides:
Radioactive noble gas 85Kr (half life: 10.7y)
Radiosrontium 90Sr (half life: 28.8y) beta emitter 89Sr (half life: 50.5 d)
other gamma emitters (140Ba-140La (12.8d), 129mTe(33.5d)others) alpha emitters :plutonium isotopes
Results of model simulation:
Higher radioactive Deposition occurred In the northern North Pacific.
Takemura et al., Sora 2011
Total amount of the Fukushima-derived
radionuclides injected into ocean via
atmosphere
1. First approximation:a half amount of total
atmospheric release was injected into
ocean.
137Cs: 7.5 PBq
(JAEA)
2. Estimation of IRSN
137Cs: 10 PBq
3. Estimation from marine observed data by
Aoyama
137
Cs: 10-13 PBq
Direct release of radioactive
contaminated water from the
Fukushima Daiichi NPP I
1.concentration in contaminated water: 5.2
TBq m
-3of
131I
flow out period(4/1-6): estimation of total
release(
137Cs 220TBq/day)(TEPCO):
2.7 PBq
131I
0.9 PBq
137Cs
2. First estimation by IRSN
total release of
137Cs
2
.5
PBq
3. Estimation from 137Cs concentrations in seawater and
ocean model(Tsumune et al., 2012)
Direct release of radioactive
contaminated water from the
Fukushima Daiichi NPP
II
• Estimation of direct release of
137Cs:
(Kawamuraet al., J. Nucl. Sci. Technol., 48, 1349–1356 (2011))
•
3.58 PBq
• Second estimation of IRSN:
27
PBq
• Estimation of JCOPE: 14.8 PBq
• Estimation of Sirocco: 4.2 PBq
• Estimation of NOAA: 3.6 PBq
Bailly du Bois et al., J. Environ. Radioact., 114, 71-80 (2012)
福島第一発電所近傍観測結果
64 南放水口および5-‐6放水口近傍の137Cs濃度 南放水口および5-‐6放水口近傍の131I/137Cs比 • 3月26日以降、131I/137Cs比が約8日 間の半減期曲線と一致すること、 濃度も増加を示すことから、港湾 内から外洋への漏洩は3月26日に 開始したことが推察される。 • 3月26日以前に観測された濃度は、 131I/137Cs比のばらつきが大きいこ とから、大気を経由した降雨など によるフォールアウトの影響と考 えられる。 • 4月6日以降、濃度が著しく減少す ることから、漏洩が大幅に減少し 始めたことが推察される。 • 4月23日より濃度の減少は弱まり、 限度濃度(9.E+4Bq/m3)程度の値と なる。 10 100 1,000 10,000 100,000 3/18 3/23 3/28 4/2 4/7 4/12 4/17 4/22 4/27 5/2 5/7 1 3 7Cs (B q/ L) South discharge 5-6 discharge 0.01 0.1 1 10 100 3/18 3/23 3/28 4/2 4/7 4/12 4/17 4/22 4/27 5/2 5/7 I-1 3 1 /C s-1 3 7 r at io South discharge 5-6 discharge Decay (8days)Tsumune et al., J. Environ.
沿岸高解像度モデル
• 領域海洋モデル(Regional Ocean Modeling system, ROMS) • 水平1km x 1km、鉛直20層、250m水深までを考慮 • 気象庁の観測結果を境界条件とした大気モデル(NuWFAS)の 結果により駆動 • 潮汐を考慮 • 境界条件は、気候値で駆動した北太平洋モデルの結果 • 再現期間(3月26日-5月1日) • 放出条件:発電所からの漏洩のみを考慮
65
設定した137Csと131Iの漏洩率(Bq/day) • 3月26日から4月6日まで一定の漏洩率(1Bq/s)と仮定し、シミュレーショ ンを行った。 • その結果に対し、 3月26日から4月6日までにおいて、漏洩を設定したメッ シュ(1km×1km×10m)の平均濃度が、漏洩場所近傍である南放水口およ び5-6放水口近傍の137Csの平均濃度(1.2×10⁷ Bq/m3)となるように、倍率 (2.55x10⁹)を掛けた。4月6日以降も港湾内に残留した137Csの放出が、 減少しながら継続していることが想定される。4月6日以降は、南放水口お よび5-6放水口近傍の137Csの濃度減少に会わせて漏洩率を指数関数的 に減少させ、4月25日以降は一定とした。 • また、131Iの漏洩率は、3月26日時点での131I/137Cs比を6.9として、131Iの 半減期(8.04日)を考慮し、137Csの設定値からの比で設定した。 • 総漏洩量は以下のとおり見積もられる。 • 3月26日から4月6日までの137Csの漏洩量:2.6PBq • 3月26日から4月6日までの131Iの漏洩量:11.9PBq • 3月26日から5月1日までの137Csの漏洩量:3.5PBq • 3月26日から5月1日までの131Iの漏洩量:13.5PBq
放出条件の設定
設定した137Csと131Iの漏洩率(Bq/day) • 3月26日から4月6日まで一定の漏洩率(1Bq/s)と仮定し、シミュレーション を行った。その結果に対し、 3月26日から4月6日までにおいて、漏洩を設定 したメッシュ(1km×1km×10m)の平均濃度が、漏洩場所近傍である南放水口 および5-‐6放水口近傍の137Csの平均濃度(1.2×10⁷ Bq/m3)となるように、倍 率(2.55x10⁹)を掛けた。 • 4月6日以降も港湾内に残留した137Csの放出が、減少しながら継続している ことが想定される。4月6日以降は、南放水口および5-‐6放水口近傍の137Csの 濃度減少に会わせて漏洩率を指数関数的に減少させ、4月25日以降は一 定とした。 • また、131Iの漏洩率は、3月26日時点での131I/137Cs比を6.9として、131Iの半減 期(8.04日)を考慮し、137Csの設定値からの比で設定した。 • 総漏洩量は以下のとおり見積もられる。 • 3月26日から4月6日までの137Csの漏洩量:2.6PBq • 3月26日から4月6日までの131Iの漏洩量:11.9PBq • 3月26日から5月1日までの137Csの漏洩量:3.5PBq • 3月26日から5月1日までの131Iの漏洩量:13.5PBq 南放水口および5-6放水口近傍の 137Cs濃度の観測結果と漏洩メッシュ における計算結果の比較 • 観測結果と計算結果はよく一致する。 • 3月26日から4月6日までは一定の漏洩率を 設定しているが、風応力による流動場の変化 による濃度変化(4月3日を中心とした濃度減 少)があり、計算結果はその変化もよく再現し ている。 1E+11 1E+12 1E+13 1E+14 1E+15 1E+16 Re le as e ra te (B q/ da y) Cs-137 I-131 10 100 1,000 10,000 100,000 3/18 3/23 3/28 4/2 4/7 4/12 4/17 4/22 4/27 5/2 5/7 1 3 7Cs (B q/ L) South discharge 5-6 discharge Simulation
福島第二発電所近傍の計算結果
福島第二発電所前における観測結果と計算結果の比較 • 福島第一発電所より、北放水口近傍は南10km、岩沢海岸付近は南16km • 観測結果と計算結果はよい一致を示す。3月26日から4月6日まで漏洩率を一定としても、4月3日に おける濃度の急激な上昇を再現することが出来た。これは風による海流の変化を再現できたためで あると考える。 • 4月12日以降は過小評価となっている。4月19日以降には、降雨によるフォールアウトの影響が卓越 してきた可能性があるが、4月12日から19日の過小評価については今後の検討課題である。 1 10 100 1,000 10,000 100,000 3/18 3/23 3/28 4/2 4/7 4/12 4/17 4/22 4/27 5/2 5/7 1 3 7Cs (B q/ L) 2F North 2F Iwasawa 2F North (simulation) 2F Iwasawa (simulation)
Total release amounts of radionuclides
from the Fukushima NPP
• Total amounts of atmospheric emission
137
Cs: about 12-15 PBq
(Aoyama’sestimation)
• Direct release as radioactive contaminated
water
137
Cs: about 3.5 PBq
(Tsumune’s estimation)• Total amounts
137Cs: about15-19 PBq
コメント:沿岸堆積物も相当汚染されている可能性が 高い。 JAEA: 8.4 PBq IRSN: 12.5 PBq
Estimate by Aoyama
Summary of budget of
137Cs in the North Pacific
Ocean
• Global fallout as of 1970 290 ± 30PBq a
• Observed inventory as of 2002 85 PBq b
• Estimated inventory as of 2011 69 PBq b
• Fukushima direct discharge 3.5 ±0.7 PBq c
• Fukushima atmospheric deposition 12-15 PBq d
• (Chernobyl global release in 1986 85 PBq e)
a: Aoyama, M., Hirose, K., Igarashi, Y., J. ENVIRON. MONITOR., 8, 431-438, 2006 b: Aoyama unpublished data
c: Tsumune et al., 2011, d: this study
Radionuclides released in
marine environments
• 131I (half-life: 8.04 d)
Effects of 131I for marine organisms are not important
because of its shorter half life. After three months, a level of 131I decreases three orders of magnitude
lower than initial level.
• 137Cs (half-life: 30 y): very important
• 134Cs (half-life: 2.04 y): 134Cs/137Cs ratio(=1)
• 90Sr(half-life: 28 y), 89Sr(half-life: 50.6 d): 89Sr/90Sr
ratio(about 12,initial time); 90Sr/137Cs
ratio(0.5-6.5x10⁻²)
• Other radionuclides: 36Cl,129I,3H and plutonium
(radionuclide compositions in direct release differed
Chemical form of released
radionuclides in seawater
• 137Cs,134Cs: ionic (dissolved), low affinity withparticulate matter. A typical tracer of water mass. (very small portion of 137Cs may be vertically
transported in deep water.) Cs behaviors are similar to alkali metal ions such as potassium.
• 131I: complicated chemical form (I-, IO
3-, organic(?))
Dissolved in seawater as anionic ions.
• 90Sr, 89Sr: ionic (dissolved), low affinity with
particulate matter.
• Pu: particle reactive; Pu(V): dissolved, carbonate complex ;Pu(IV): particulate, organic complex
134
Cs (left) and
137Cs(right) in April-May 2011
NYK ships : Brown
MR11-03: light blue , Honda et al., 2011(11:00 today) KT11-06:Blue
1000 Bq m-3
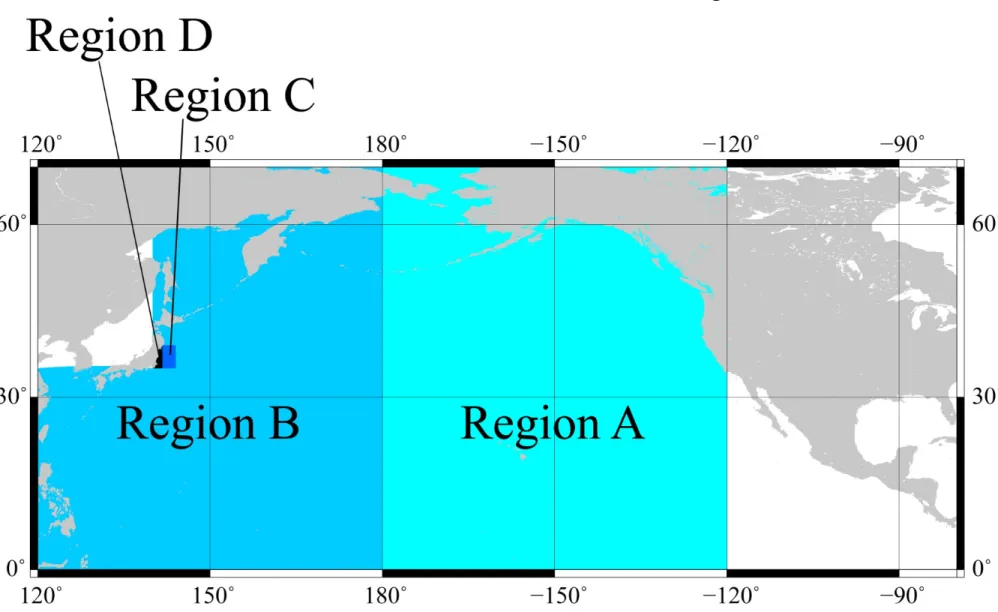
Radiocaesium activity in 4
regions
Fig S4.
137Cs and
134Cs acVvity in region A: eastern North
Fig S5.
137Cs and
134Cs acVvity in region B: western North
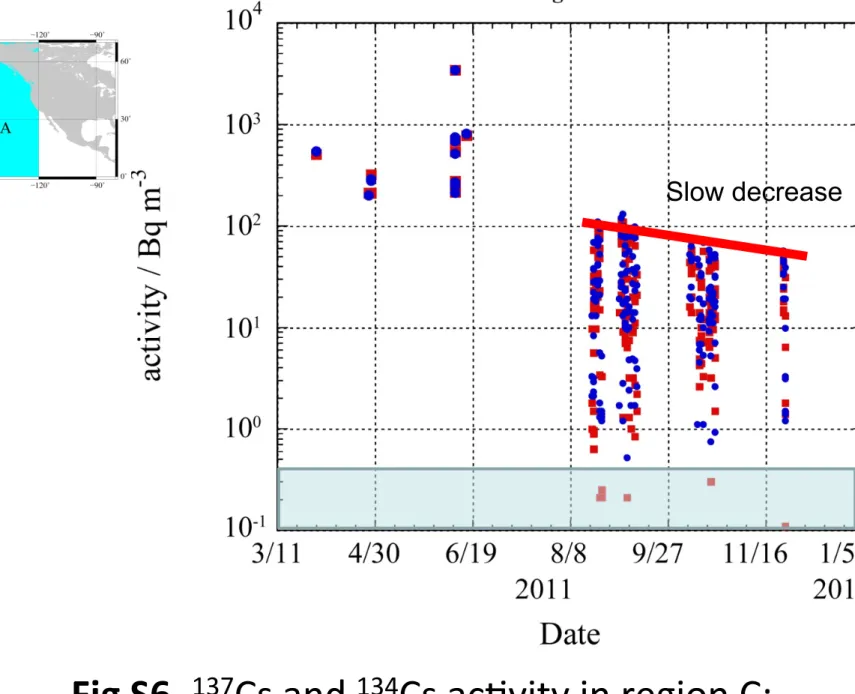
Fig S6.
137Cs and
134Cs acVvity in region C:
35ºN-39ºN, 140.7ºE-144ºE
Fig S7.
137Cs and
134Cs acVvity in region D: close to the
FNPP1 site
Summary: temporal and spatial
distribution of
Fukushima radiocaesium
• Fukushima radiocaesium deposited on wide
area in the North Pacific Ocean, especially in
western part of subarctic gyre and subtropical
gyre.
• In the eastern North Pacific Ocean, maximum
134
Cs activity was ca. 10 Bq m
-3in April/May
2011.
• Detected
134Cs was Fukushima origin and
137Cs
II. Effects of direct release of cooling water from the Fukushima Daiichi NPP
1. Temporal change of 90Sr in surface water near reactor site
2 Pre-Fukushima level ○: sites near reactors □: sites 15 km off coast
Effects of Fukushima Daiichi NPP accident Temporal changes of surface 137Cs and 90Sr
Temporal change of 89Sr/90Sr and 90Sr/137Cs
activity ratios in surface water near the reactor site
89Sr/90Sr ratio decreased according
to the half life of 89Sr.
137Cs concentrations in surface waters (model simulation) • 4月6日までは一定量の漏洩が継続した。4月6日において、福島沿岸部にそって、限 度濃度(9.E+4(緑))を超える値が広がっている。北向きへの影響は小さい。ただし、 沖合方向への拡散は過小評価となっている。 • 4月11日は沖合への拡散が大きくなるが、計算では過小評価である。濃度限度以上 の海域面積はほとんど変わらず、濃度限度以下で拡散している。 2011/04/11 2011/04/06
137Cs concentrations in surface waters (model simulation)
2011/04/23 2011/05/01 • 4月23日には、沿岸に沿って南方向に拡散している。すべての海域において濃度限度以下とな る。南下した後、銚子沖において黒潮にのり、東に拡散する。ただし、この海域においては境界 条件の影響を強く受けるため、誤差が大きい可能性がある。 • 5月1日は北方向および沖合への拡散が大きくなる。これは、境界条件としての親潮が弱まった 影響と考えられる。 すべての海域において濃度限度以下となる。南下した後、銚子沖において 黒潮にのり、東に拡散する。
15 Nov. 2011
15 Feb. 2012
Model simulated 137Cs
Concentrations in surface water
Radioecological effects to
marine organisms
• 131I: enriched by sea weeds(since half life of 131I is
short, radioecological effects to marine organisms are low.)
• 137Cs: concentration factor of marine organisms is
relatively low. (137Cs is enriched in soft tissue of fish.)
Since biological half time of 137Cs is relatively short, 137Cs concentrations in marine organisms decrease
according to decline of 137Cs concentrations in
seawater. The concentration factor of 137Cs is 10 -
100 for marine organisms.
• 90Sr: concentration factor of marine organisms is
Radionuclides in sediments
137
Cs
134Cs
89Sr
90Sr
239,240Pu
238Pu
• Odaka 3km 600 570 140 44 0.43 -
• Iwasawa
3km 1000 970 42 10 0.45 -
6/2 sampling, unit: Bq/kg TEPCO
• Partition coefficient of 137Cs between seawater and sediment
: 1000
(BG seawater: 1-2 mBq/L, BG sediment: 1-4 Bq/kg)
• Partition coefficient of 90Sr between seawater and sediment
: 100
• Estimation of 137Cs and 90Srconcentration (Bq/L) from
their concentration in sediments