平成 29 年度 公立はこだて未来大学卒業論文
仮想空間を用いた方向感覚の評価
佐々木智広
システム情報科学部 所属学科 学籍番号 1014218
指導教員 (主)マイケル・ヴァランス 提出日 2018 年 1 月 31 日Evaluation of Spatial Recognition in a Virtual
Environment
By
Tomohiro Sasaki
BA Thesis at Future University Hakodate, 2018
Advisor: Prof. Michael Vallance
Department of Complex and Intelligent Systems
Future University Hakodate
Abstract
There are people who often get lost and there are others who don’t. Those who get lost, in other words those who have a poor sense of direction or spatial recognition, are called “方向オンチ (houkou-onchi)”. What makes those people houkou-onchi? What are the differences between people who get lost and others? In an attempt to answer these questions, three applications were developed using virtual reality (VR) and informed with references related to cognitive psychology. To develop VR applications, Oculus Rift and HTC Vive for hardware, and Unity and Blender for software were used. Those applications were used to collect data about spatial recognition and to determine the essence of houkou-onchi. For data collection, experiments were conducted in which subjects answer a questionnaire, play applications to test their spatial recognition and psychological ability, and worked on a paper task. In total, 23 1st year university students joined in the experiments. According to the collected data and analysis based on data, it was found that the faster psychological ability, which is mental rotation, a person has, he/she can understand directions. Making actions while exploring a virtual space can help a person remember what he/she sees. In addition, personal lifestyle or environment have no influences to spatial recognition. In summary, through this research, VR applications which simulate real world walking were developed. These applications helped collect data and determine differences between people who get lost and others.
Keywords: Virtual Reality, Spatial recognition, Unity, Blender, Oculus Rift
概要: 人には道に迷いやすい人とそうでない人がいる.迷いやすい人,方向感覚に疎い人は方向オ ンチと呼ばれるが,何が人を方向オンチたらしめるのだろうか.迷いやすい人とそうでない人の 違いは何であるのか.これらの答えを調べるために本研究では,認知心理学に関する文献等を基 に,3 種類の VR アプリケーションを開発した.方向感覚に関する情報を収集するための実験が 実施され,被験者はこれらのアプリケーションを体験や,アンケートへの回答,アプリケーショ ンに関わるテストに取り組んだ.実験には,合計23 人の大学 1 年生が参加した.実験によって 得られたデータと,それを基にした分析から,心理学の能力である心的回転と方角を理解する能 力には相関が見られた.また,仮想空間の探索中に一定の動作を行うことが,見つけた物の記憶 に作用したこと,個人の生活方式や環境が方向感覚に影響しないことが明らかになった.本研究 では,街における散策をシミュレートするVR アプリケーションが開発し,それらを用いて道に 迷いやすい人とそうでない人の違いを検証した. キーワード: VR,方向感覚,Unity,Blender,Oculus Rift
目次
1 Introduction ... 1 1.1 Background ... 1 1.2 Purpose ... 1 2 Literature Review ... 2 3 Development ... 4 3.1 Used Software ... 4 3.1.1 Unity ... 4 3.1.1.1 Steam VR ... 4 3.1.2 Visual Studio ... 5 3.1.3 Blender ... 5 3.2 Used Devices ... 6 3.2.1 Oculus Rift CV1 ... 6 3.3 Developed Applications ... 63.3.1 Mental Rotation Quiz ... 6
3.3.2 VR Direction Quiz ... 7
3.3.2.1 3D Models ...11
3.3.3 VR City Explore ... 12
3.3.3.1 Scripts for City Generation ... 16
4 Experiment ... 21
4.1 Procedure ... 21
4.1.1 Questionnaire ... 21
4.1.2 Mental Rotation Quiz ... 21
4.1.3 VR Direction Quiz ... 22 4.1.4 VR City Explore ... 22 4.1.5 Paper Task ... 22 4.2 Result ... 24 5 Discussion... 30 6 Conclusion ... 31 6.1 Limitations ... 31 6.2 Future Work ... 31 Acknowledgements ... 32 References ... 33
Appendix A Example script... 34
Appendix B Letter of Acceptance ... 35
Appendix C Questionnaire ... 36
Figure Index... 37
1
Introduction
1.1
Background
Nowadays, Virtual Reality (VR) has grabbed peoples’ attention around the world. Commercial VR Head Mounted Displays (HMD) have been produced by various companies, such as HTC, Oculus, Sony, and Samsung. VR is currently mainly used for entertainment due to possible financial gains. For example, on Steam, Oculus or PlayStation store, lots of VR games are available. But not only entertainment. VR has a long history of being used in medical, military, education, and research fields. Moreover, companies and researchers have revealed benefits that VR has to human abilities. In this research, using a HMD and game engine called Unity, VR applications were developed in order to learn about human spatial recognition.
1.2
Purpose
The purpose of this research is to determine the differences between people who get lost (called
houkou-onchi ) and others who don’t, using original VR applications in which users can explore a uniquely designed
2
Literature Review
Houkou-onchi, or getting lost, is a common topic, and a number of books and articles about it have been
published [1] [2]. There are also some books related to houkou-onchi based on cognitive psychology. Shingaki states: “to find out a direction to a certain place using a map requires mental rotation [2]; the ability to rotate mental representations of two-dimensional and three-dimensional objects in the human mind” [3] so if the direction a person faces and the direction of a map match, it becomes easier to understand because it needs less calculation of rotations in the mind. Shingaki also states that “people who get lost tend to care about something irrelevant to the route while walking; for example, other pedestrians or cars” [2]. In contrast, “others who are not prone to getting lost care mainly about landmarks which are helpful to understand directions” [2].
It is known that a person can pay more attention to certain things while walking or exploring. In an experiment using a driving game, a significant difference in neural activation was detected when a subject was viewing a target object as opposed to a non-target object [4]. Those things a person cares and notices while walking are used to remember routes to places.
Tversky found out “people can form coherent mental representations of the spatial relations among landmarks whether learned from direct experience, or learned vicariously through language” [5]. Subjects could produce a correct map from learning descriptions about it. Tversky states “it’s inefficient to remember a route as successive snapshots of the world because this would not allow recognition or navigation from other points of view”.
Therefore, in short, people remember a route by finding certain things and understanding the connections among them. But things they care about can be different. Besides, in terms of understanding a map, a cognitive ability named ‘mental rotation’ is required, so the differences among people about cognitive ability and attention to things can indicate what factors influence people who get lost.
The purpose of this research is to collect relevant data and evaluate spatial recognition. The target age group is about 20 year old undergraduate university students. In this research, VR devices are used, so age must be over 13.
There are a number of benefits of using virtual environments. In an experiment by Shingaki, subjects walked around a city in real world holding a video camera and recording their voices while exploring [2]. Even when using the same street, everything can’t be same: different cars or pedestrians can pass; weather or temperature can be different as well. However, in this research, the same application will be used for subjects, so the condition can be more consistent and controlled. In addition, more quantitative data can be collected in the virtual environment. For example, using sensors embedded into head mounted display (HMD), the face angle of a subject can be tracked anytime, so it’s easy to find what objects are in the subject’s eyesight. The data of face angle can also be used to measure how frequent a subject looks up or down. Depending on looking up or down, things which a person sees can be fairly different.
In addition, Mollison used a computer screen to represent the virtual world in his driving game [4]. To figure out if a subject noticed a target, the rate of how much space that target took up on screen was used. Besides, the amount of visual information a subject could get was limited because of the screen. But with HMD, subjects can see things more freely because as they move their head, their view changes simultaneously. Moreover, virtual activities can affect user’s cognitive ability. Optale found significant improvements in long term memory and several other aspects of cognition using a virtual environment [6]. Transference of improvements from the virtual to the real world was shown in neuro rehabilitation as well
[6].
Google have launched applications which enable users to move around places in the world, such as Google Map and Google Earth. Recently an application named Google Earth VR in which a user can move around in a realistic virtual world has become available. Applications developed in this research are similar to those applications but rather designed to observe user’s behavior, particularly how he/she figures out directions and what he/she notices and looks at.
In summary, ideas used to design experiments and tasks in a virtual space were based on experiments conducted by other researchers in the real world. Essentially, a virtual world was used to simulate real world, so some methods used in real world could be useful in virtual world too. For example, “sketch map” is a task which makes a subject write down what he/she remembers seeing after walking. It’s a common method to see person’s spatial recognition and memory [7]. Using sketch map, Fujioka found out that changes of city structure and life environment affect children’s spatial recognition [7].
3
Development
3.1
Used Software
3.1.1
Unity
To develop applications, software called Unity was used. Unity is a game engine which offers a graphical interface and editor to control 2D/3D objects (Fig. 3-1). To make interactions among player and objects, coding is required. The programming language for coding is either C# or JavaScript. In this research development, C# was used. Because C# can be used for coding, other C# references and functions can be imported to the project too. For example, for data collection, subjects’ data during gameplay needed to be recorded and output, so File Class was used. Unity is compatible with VR platforms as well, especially Oculus Rift and HTC Vive which were mainly used for development and experiments.
Fig. 3-1 Unity
3.1.1.1 Steam VR
To make VR Unity applications, a Unity asset named SteamVR from Asset Store was used. Unity Asset is a collection of files which can be used to make a Unity project. Asset Store is an online community where free or commercial assets are uploaded and available.
Unity has various kinds of objects, like 3D object, UI object, and particle object. Camera object is one of them. During gameplay, objects in front of that camera object are shown on screen. SteamVR has a customized camera object which makes the camera object interactive with a user’s head movement using HMD: if a user looks up, the VR camera looks up too and what he/she can see in virtual world changes simultaneously. SteamVR can manage not only the position of HMD but also controllers. The position of controllers tracked in the real world can be used in the virtual world. Unity objects can be put at that position, so in the virtual world of VR applications, 3D models of controller were shown at tracked positions in the
real world. As a user moved controllers in the real world, virtual objects followed.
3.1.2
Visual Studio
Visual Studio is an integrated development environment which Microsoft produces (Fig. 3-2). To make C# scripts for Unity projects, this software was used. Fig. A-1 in Appendix A is one of the C# scripts which was made and used for this research. What that script does is, when a trigger button pressed, calculate angle differences between user’s controller and each direction, either south, north, west, and east, in 3D space. If the angle difference is less than 40 degrees, then user moves to that direction in 3D space. It was impossible to list all the scripts in Appendix. For example, one script consists of 294 lines of codes. So, all the other scripts were put on a DVD-ROM of the resources of this research.
Fig. 3-2 Visual Studio
3.1.3 Blender
The free software, Blender, was used for making 3D models, such as variety of buildings, roads, and props like hand camera and sign boards (Fig. 3-3). In this research, all the 3D models were original and constructed. Blender can export 3D files for the format which is compatible with Unity. For file format, fbx was mainly used.
Fig. 3-3 Blender
3.2
Used Devices
3.2.1 Oculus Rift CV1
To develop VR applications and collect data, a head mounted display (HMD), Oculus Rift CV1 and its controllers named Oculus Touch and sensors named Oculus Rift Constellation were used. The positions and angles of CV1 and Touch are tracked by Constellation. This tracking is done mainly by infrared LED and sensor. A number of infrared LED are embedded into CV1 and Touch. For example, CV1 has 33 infrared LED on its front and 10 on its back. Touch has 2 on its front and 22 on the ring attached to Touch’s side. While CV1 and Touch are used, they emit infrared lights. Those lights are detected by Constellation, especially its infrared camera and image sensor inside. But if detecting infrared lights in real world, other lights that have different wave length can be noise. Those unnecessary lights are shut down by a visible light filter adhered in front of the infrared camera, so what the infrared camera and image sensor get is just information of infrared light. That’s how positions and angles are tracked. According to positions and angles, what a user sees in a virtual world changes simultaneously. Besides, each display shows things differently for two eyes. That’s why a user can have an immersive experience in a virtual world.
3.3
Developed Applications
Three applications were developed to collect data about spatial recognition.
3.3.1 Mental Rotation Quiz
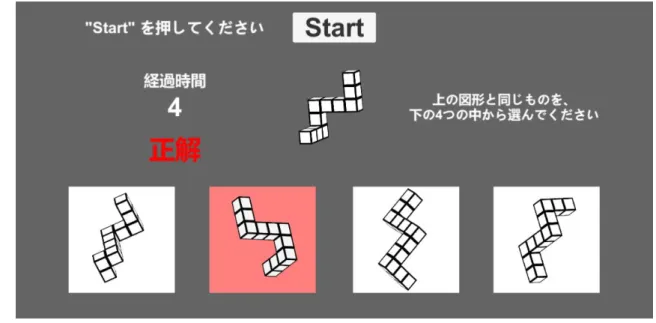
The first application is a quiz application that was used to test mental rotation ability. Fig. 3-4 shows one scene of this application. First, one geometrical object is shown to a user. Then he/she gets four other objects: one of them is same as the first object while three of them just look similar but are different. Besides, all of them have different angles to make the quizzes difficult. After providing four one-base objects and four other objects, a user chooses a correct one. In every quiz, the user’s answer and time spent until answering are recorded. After all quizzes are finished, this application outputs a text file which contains the
data: whole answers and times.
Fig. 3-4 Mental rotation quiz
To make mental rotation questions, images of 3D objects were required to make a subject rotate 3D representations in his/her mind. First, using Blender, four kinds of geometrical objects which consist of cubes were made. Then those objects were exported as fbx file which is compatible 3D file format with Unity.
Fig. 3-5 Example of 3D geometrical object
In a Unity scene, the four geometrical objects were lined up horizontally. Rotating and adjusting the angle, screen captures of geometrical objects were made. Those images were used for mental rotation questions. While making screen captures, how much an object rotated was recorded because the bigger the difference of angles between 3D objects gets, the more difficult a question can be.
3.3.2 VR Direction Quiz
The second application is like a game, in which a user stands on a virtual city and figures out a certain direction indicated on a virtual map (Fig. 3-6).
Fig. 3-6 VR Direction Quiz
Related to mental rotation, if a direction that a map shows and a direction that a person faces match, it’s easier to figure out a direction to go. As a person rotates geometrical objects in his/her mind, he/she rotates a map to understand; so if a map requires less rotation, it’s easier to understand. This application will be used to test mental rotation ability like the first application (discussed above) but in a different environment; that is, a virtual city. Like the quiz application, this application records answers and times and outputs the data as a text file. The virtual map that a user has in tasks has completely the same structure as the virtual city because it’s made just by duplicating all of the 3D objects which make the virtual city (Fig. 3-7). But its scale is one-five hundredth. The original size of the virtual city used in this application is 200 meters by 200 meters, so the size of map is 0.4 meters.
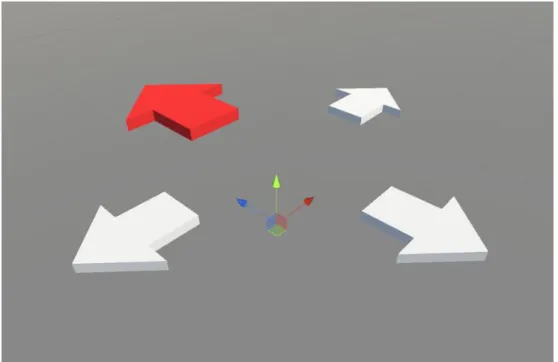
To select one direction and answer a question, a user points at a certain direction with the right controller and press the trigger button on it as Fig. 3-8 shows.
Fig. 3-8 Answering a direction
To indicate which direction a user selects, 4 arrows are put around him/her in the virtual world (Fig. 3-9). Each arrow points at either south, north, east, or west. When no direction is selected, all the arrows are white. But if one of directions is selected, one arrow for that direction changes; its color changes to red and its size doubles to indicate specific direction is being selected. If the angle gap between one direction and the front angle of right controller is less than 40 degrees, that direction is regarded as selected.
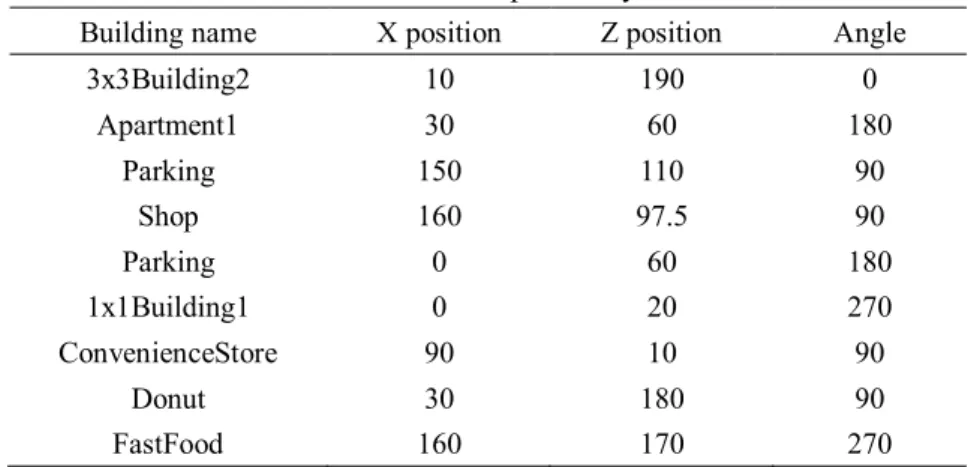
The structures of the virtual city were made and prepared ahead as txt file. Table 3-1 is an example of city data. Every time a subject tries a question, certain city was generated based on selected txt file. Csv files used to save city structure consist of long lines of texts. The data each line has name of building, its position, and its angle. Unity’s 3D space is made of 3 axes: X, Y, Z. Usually, Y axis is assigned to height, so a position on ground can be expressed with X and Z axes. That is why X and Z positions are recorded in txt files. When generating a city on txt data, reading lines, buildings are built at a position with an angle which one line describes. Txt files used of city structures were made using one script. What that script does is essentially the opposite of city generation on txt file; when a virtual city is made with auto generation scripts or manually when a certain button on the keyboard is pressed, all the data of each building, its position and angle are then written into a txt file.
Table 3-1 Example of city data
Building name X position Z position Angle
3x3Building2 10 190 0 Apartment1 30 60 180 Parking 150 110 90 Shop 160 97.5 90 Parking 0 60 180 1x1Building1 0 20 270 ConvenienceStore 90 10 90 Donut 30 180 90 FastFood 160 170 270
To help a user understand how to play this application and get used to it, a practice scene was made. Essentially, what a user can do is the same as the main scene: just trying direction questions. But the instruction for each action is shown above controllers (Fig. 3-10). In this practice scene, user’s data such as answers and times are not recorded.
3.3.2.1 3D Models
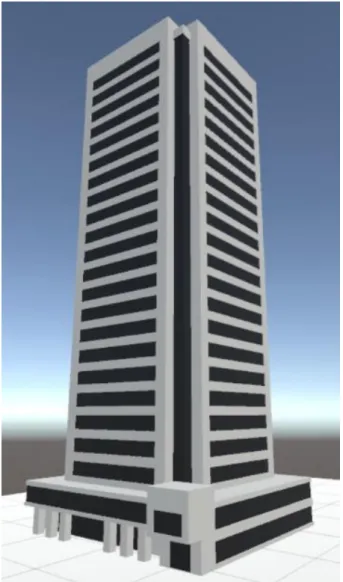
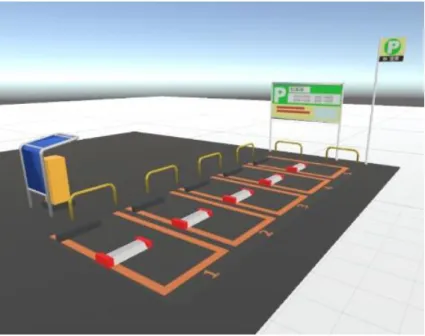
To make the virtual city look appropriate, 3D models of buildings were required. While developing basic system of the applications, pre-installed 3D objects in Unity were used, like sphere and cylinder. But these objects were not appropriate because they did not represent ordinary buildings: roof, windows, and door. So they were gradually replaced with originally constructed models. Eventually, 14 kinds of models were made in total: two 10 meters high buildings, one 30 meters high building, two 50 meters high building (Fig. 3-11), two apartments, convenience store, fast food restaurant, donut café, two shops, police station, and car park (Fig. 3-12).
Fig. 3-12 3D model of car park
The 3D buildings were designed as simple as possible; not so detailed so as not to make a user pay too much attention to them during the tasks. At least every building has several features to help subjects understand what each building is: for example, the convenience store and supermarket have a signboard; parking lot has a pay machine in its space; skyscraper is made tall and has lots of windows. As Dinh states: “the level of visual detail doesn’t affect user's sense of presence or memory of the environment.” [8]
3.3.3 VR City Explore
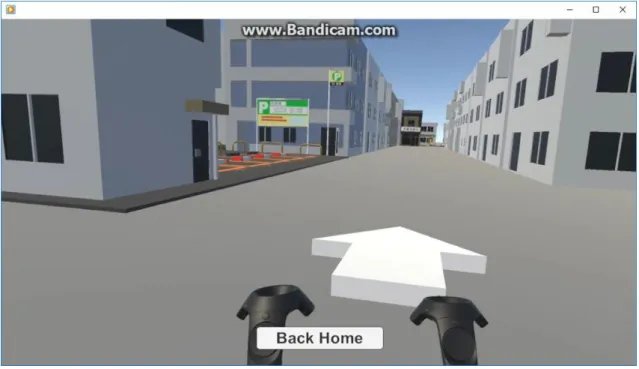
The third application is quite similar to the second one. In this application, not only a user figures out directions with a map in a virtual city, but also moves to a given destination (Fig. 3-13). 3D objects seen in the virtual city, like a convenience store, police station, and fast food restaurant, were the same 3D models used for the VR Direction Quiz application.
To emphasize the goal, a yellow sphere was shown above the goal block (Fig. 3-14).
Fig. 3-14 Yellow sphere at the goal
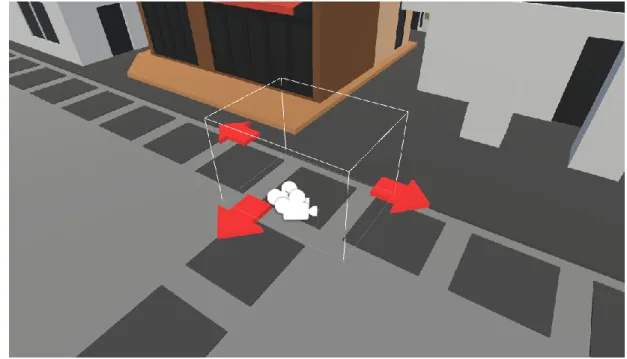
During the task, a user can walk and look where he/she likes in this virtual environment. But the problem is, the space used in the real world is limited. In this case, it’s 2 meters by 2 meters, so the virtual space of this application is divided every 2 meters. A user walks around this 2 meters’ sized block. Of course, a function which enables one to move from a block to the other was added. To help a user jump block to block, red arrows are shown around user to indicate which direction he/she can move (Fig. 3-15).
Fig. 3-15 Arrows which show directions a user can move
To jump to the next block, a user points at one direction that an arrow shows with the right controller and press a trigger shaped button on it.
When making a 3D environment for games or applications, this rectangular grid representation isn’t natural and appropriate, it rather works for 2D tile-based environment [9]. But in this application, a user can walk and look around freely in each block of the grid before deciding which direction to go and moving to the next block. Besides, motion in virtual space needs to be designed carefully to avoid VR motion sickness. Otherwise, a user can have symptoms, such as nausea, disorientation, headaches, sweating, and eye strain [10]. Even though the space in the real world is physically limited, there shouldn’t be differences between motions of real and virtual world.
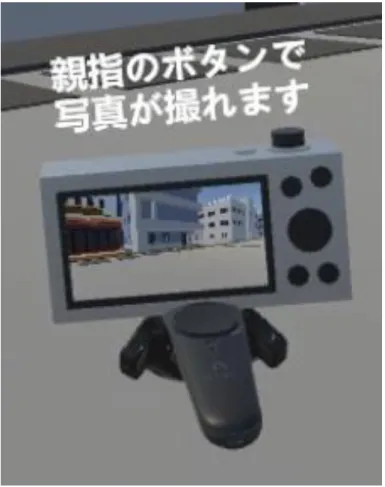
During gameplay, a user can take pictures in virtual world using hand camera attached above right controller (Fig. 3-16). This camera is totally virtual and just follows user’s hand movement. By pressing thumb button on right controller, what that hand camera captures is saved as an image file simultaneously producing a shutter sound for effect (Fig. 3-17). Those camera images were used as one way to see what subjects noticed and paid attention to.
Fig. 3-17 Picture taken by virtual camera
By pressing the trigger button on the left controller, a map of the city shows up above the left controller in the virtual world. Like the virtual hand camera, this map just follows a user’s left hand movement. What that map shows is just positions of start and goal. First, current position was added as well, like navigation application. But it was removed because it was found that if a user can see where he/she currently is, then he/she doesn’t need to pay attention to buildings. It’s easy to figure out which direction to move just by checking where the current position is, and move.
In addition to the time spent in a task, the data about the user’s face angle, number of noticed landmarks, and route are recorded and are output in a text file.
Like VR direction quiz application, to help a user understand how to play this application, a practice scene was made. In this practice scene, texts for instruction are shown (Fig. 3-18). Every action, such as how to move to next block, how to show a map, and how to take pictures, is explained. Each text is located at where certain user’s control is required for certain action. For example, instruction for hand camera is shown just above it.
Fig. 3-18 Instruction text
As opposed to main scene, city structure and positions of start and goal were totally random. The purpose of this scene is just practice, so no data is collected.
3.3.3.1 Scripts for City Generation
Virtual cities used in applications were generated automatically based on the specific algorithm and programs designed for the tasks. First of all, the city generation program requires street data of virtual city as csv file. This street data needs to be made and designed manually. Street data is 2D tile-based data which contains just two kinds of information: “road” where a user can pass, and “wall” where a user cannot. That csv file of street data consists of three kinds of letters to represent the information for street data: ‘w’ that stands for wall, ‘(blank)’ that stands for road, and ‘,’ just used to split letters into cells. Fig. 3-19 is an example of street data opened in Excel.
Fig. 3-19 Example of street data
Once a csv file of street data is ready, city generation program reads it and puts 3D models which stand for either road or wall (Fig. 3-20).
Fig. 3-20 Roads
Each cell in csv file has 10 meters width and height in virtual world. This 10 meters is a basic scale of buildings, so a size 1 building takes up 10 times 10 square meters in virtual world. This city has just roads and vacant spaces so next, buildings are put on those vacant spaces (Fig. 3-21). Buildings to be put are decided at random. But they can have different sizes, so to prevent some buildings from overlapping each other, this process needs to be done according to where vacant spaces are and distance each of them has
from the closest road. The reason why the distance between vacant space and road is; if putting a building which has size 3 on a space which distance from road is 2, then that building can come out to the road depending on the its angle.
Fig. 3-21 Virtual city being generated
Before deciding which building to put, distances of each space are calculated. Then one of the spaces which has the highest distance value is chosen at random. Next, one building which size is the same or closest to the distance value of the space is chosen at random as well.
The angle of that building needs to be decided too. Angle is either south, north, east, or west. If the front of building can face a road, angle is set to that direction. Otherwise set at random. After putting one building on the chosen space, distance values of spaces where that building takes up are updated to 0 which means no building can be put there anymore. Another program calculates which vacant spaces are taken up according to the building’s angle. For example, when size 2 building is put on a space which position is (a, b), then spaces that building takes up is (a, b), (a+1, b), (a, b+1), and (a+1, b+1). If that building rotates 90 degrees clock wise, spaces change into (a, b), (a+1, b), (a, b-1), and (a+1, b-1). To calculate this, these equations for rotation of vector can be used (1) (2). X and Y are the original positions. X’ and Y’ are the positions after rotation. θ is the value of rotation.
X′= 𝑋 cos 𝜃 − 𝑌 sin 𝜃 (1) Y′= 𝑋 sin 𝜃 + 𝑌 cos 𝜃 (2)
If the distance values of every space become 0, in other words all the vacant spaces are gone, city generation finishes (Fig. 3-22). If not, program does all the processes from distance calculations.
Fig. 3-22 Virtual city just filled with 3D objects There are several other programs used to make the virtual city more natural.
First, a building can have a different set of colors. In Unity, 3D objects can have color and texture information, and those information can be controlled by programming, so when some buildings are built, different set of colors are attached automatically (Fig. 3-23).
Fig. 3-23 Same buildings colored automatically and differently
Second, some buildings have a percentage value to determine how frequent it can be built, so if the value for certain building is five, then one twentieth of whole buildings would become that specific building. Without this value, special buildings like convenience store or police station can be built limitlessly. It wouldn’t be natural in real world. This is roughly how programs and algorithms work to generate a virtual
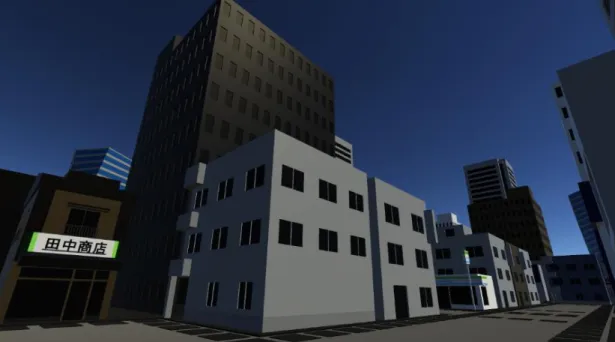
city. Fig. 3-24 is a city automatically generated by scripts.
Fig. 3-24 Virtual city updated by other scripts
But then, those generated cities were modified and adjusted manually to make them more appropriate for data collection task. For example, some landmark buildings were removed to limit the number of landmarks, and some buildings were moved to corners to make them easier to find.
4
Experiment
4.1
Procedure
Prior to the tasks, every subject filled out the letter of acceptance in order to make sure he/she agrees to join in the experiment. The letter of acceptance is attached in Fig. B-1.
A subject has five tasks in total. First of all, several questions are asked on form, like how he/she walks around a place, what he/she cares, and where hometown is (4.1.1). Second, a subject plays the quiz application to test mental rotation ability (4.1.2). Third, a subject plays the VR game in which he/she has to figure out certain directions (4.1.3). As well as the structure of cities, the base angle a subject faces are different in every quiz to make differences in data among subjects who get lost and others who do not. But of course all subjects have the same set of tasks. Fourth, a subject plays the other VR game in which he/she moves to a certain goal. The same virtual city is used in each task (4.1.4). Finally, a subject writes down the buildings he/she remembers in the fourth task on a paper map which only has road information (4.1.5).
4.1.1
Questionnaire
There are 7 questions in total: name, student number, gender, hometown, confidence in spatial recognition, how often he/she goes out, and what to care about while walking (Fig. C-1).
First two questions, name and student number, were asked just to identify who joined in the experiment. But other 5 questions were asked to determine the causes of getting lost.
Gender was asked to see if there are any differences in spatial recognition between male and female. The reason why subject’s hometown was asked is that it was posited life environment can be different among towns and cities, especially between city and countryside. Cities are likely to have more people, vehicles, and buildings, compared to countryside, so visual information people have in their everyday life can be different depending on where they live. People who live in a big city might be used to walking and understanding routes. To compare densities of visual information cities or towns would have, population density was calculated for each answer. For calculation, official website of a city or town was used.
Confidence in spatial recognition was asked to determine if confidence matters when determining directions or understanding maps. A subject chooses one point out of four; 1 point for ‘definitely not confident’ up to 4 points for ‘definitely confident’.
The idea of question, ‘How often a subject goes out’ is a little similar to the hometown question. It was posited people who often go out might be used to understanding directions and where building are compared with others who stay home.
The last one, ‘What to care about while walking’ was asked to see if there is anything a person should pay attention to in order to walk towards a particular destination efficiently. A person who just cares about landmarks but has no sense about direction might take a detour while connecting landmarks, compared with a person who cares about directions.
4.1.2
Mental Rotation Quiz
In the second task, which is the mental rotation quiz application, a subject had 7 questions. In each question, he/she has to choose one correct geometrical object out of 4. Since half of subjects had finished this task, the order of questions was changed to make sure that order doesn’t affect the subjects’ grade. If most subjects made a wrong answer in question 1, it’s hard to judge that question was really difficult or
they were just not used to playing. To make sure that every time a subject starts a question he/she is ready, each question starts just after 1 second he/she presses a “Start” button on a screen.
4.1.3
VR Direction Quiz
Just before the third task began, a short introduction about how to use VR devices was conducted because once a subject wears the HMD, it’s difficult for the researcher to show something in the real world. Before putting on the HMD, in terms of hygiene, a mask which covers where HMD and face touch was offered as well. The third task, VR direction quiz application, started after practice task. Not many subjects had had VR experiences, so introduction about how to play that application was necessary. This practice task consisted of 4 questions which were completely different from questions in main task. Data wasn’t collected in practice.
After the practice task finished, the main task began. This main task had 12 questions. In every question, a subject needed to figure out one specific direction shown on the virtual map which he/she has on left hand. The number of directions, i.e. choices for answer were 4: south, north, east, and west. By default, the front directions of a subject and virtual map match, but in some questions, the angle of map changed. There were 3 kinds of angle difference: 0, 90, and 180 degrees. To cover all combinations of answer direction and angle difference, 12 questions were made, 4 times 3 equals 12. Like mental rotation quiz, every question started just after 3 seconds a subject pressed certain button on controller in order to let him/her get ready.
4.1.4
VR City Explore
When the VR direction quiz application finished, the task was shifted to the fourth one: the VR explore application. In this task, the practice task was conducted before the main task. In practice, a subject moved around a virtual city which was just generated at random, so as opposed to the main task, every subject had a different structure of a city. Start position and goal position were decided at random too. The distance between them were sometimes quite close or far. The purpose of this practice task was just to explain to a subject how to play, so the city structure and positions were not crucial. After a subject reached the goal, the main task started. To prevent the time of experiment from getting too long, after 10 minutes the main task began, the task finished automatically wherever he/she was located.
4.1.5
Paper Task
After the fourth task, a subject took off the HMD and moved to a table to join the fifth task. In the fifth task, two papers were given to him/her. One paper had a blank map which consists of grids (Fig. 4-1). The structure of this map is totally the same as the virtual city used in VR City Explore (Fig. 4-2). The blocks which stand for roads were colored dark gray and others had no color. This paper was used to write answers. The other paper had a list of buildings with numbers (Fig. 4-3). Not only buildings’ names and numbers, the sizes of buildings were shown as well. Based on this paper, a subject wrote down those numbers in blocks. When he/she couldn’t remember buildings anymore, this task finished. This task with paper map was designed based on a method called sketch map (see explanation above). What this task needed to reveal is just how many buildings a subject remembered seeing, so accuracy wasn’t essentially so important. When grading, block gaps, up to 3 blocks were regarded acceptable. If a subject wrote down a building’s number on an adjacent block of the correct block, that answer was considered as correct.
Fig. 4-1 Blank map for paper task
Fig. 4-3 List of choices
4.2
Result
Twenty three (23) first year students of university, aged 18 to 19, joined in the experiment. All of them answered questions on the forms and played mental rotation quiz application (Fig. 4-4). 21 of them played
VR Direction Quiz application. And, 13 of them played VR City Explore application (Fig. 4-5).
Fig. 4-4 A student plays mental rotation quiz
Fig. 4-5 A student plays VR applications
According to Tversky, understanding the connections among landmarks can be crucial to remember route [5]. In a survey question, 17 subjects out of 23 answered they care about landmark while moving to certain destination. 6 others answered they care about either direction or address. The grades of the paper task about building a subject remember were compared dividing subjects into two groups: first one is subjects who care about landmarks and second one is others who care about something else: direction or address. Interestingly, the average score of group 2 (M = 4.67, SD = 2.05) was better than group 1 (M = 2.5, SD = .92) as Fig. 4-6 shows. In other words, subjects who less care about landmarks remembered more of what
they saw (F(1,11) = 5.63, p<.05).
Fig. 4-6 Average score of map task
But the sample size is extremely small, so this result can be just a coincidence. People who go outside more frequently would get more visual information outside in everyday life compared with others who prefer staying inside, so those people were expected to get a better grade in VR direction quiz and paper task. Despite this, the results of neither of them were influenced by how often subjects go out. Subjects answered how often they go out in a week on a scale of 0 to 4. Each point stands for the number of days, so 1 is 1 day. But only 4 was for above 4 days. This “go out” didn’t include common activities among subjects, like commute and shopping. In paper task, subjects who answered they go out more than 4 times a week got slightly better grade (M = 3.67, SD = 2.36). But, no significant difference was found. In VR direction quiz, significant difference wasn’t found either. Confidence has nothing to do with ability to figure out directions. Subjects who had little confidence in spatial recognition, which is 2 in scale of 4, got relatively better score (M = 4.4, SD = 1.62) compared with others. But the difference isn’t significant.
Fig. 4-7 shows that significant correlation was found between the time spent to solve mental rotation questions and the time spent to finish directions in VR direction quiz (r = .83, p<.001). In other words, the faster mental rotation ability a subject has, the faster he/she can understand map and figure out directions. But, one thing to note is that it’s only about speed, not accuracy.
Fig. 4-7 Correlation of total time between Mental Rotation Quiz and VR Direction Quiz
Just a small correlation was found between the grades of mental rotation quiz and VR direction quiz (r = .33, p>.05). Besides, that result was not significant at all, so according to the experiment result, it doesn’t mean the better mental rotation ability is a key for better spatial recognition (Fig. 4-8).
Fig. 4-8 Correlation between total time of Mental Rotation Quiz and VR Direction Quiz In the VR explore application, the average face angle and the number of found objects have a correlation (r = .77, p<.01). The more a subject looks up, the more likely he/she finds objects. What the ground consists of in this VR application is just roads (Fig. 4-9).
Fig. 4-9 Correlation between face angle and found landmarks
In addition, a correlation was found between the number of found objects and the grades of paper map task (r = .41, p>.05). But although correlation was found, it is not significant, so this result cannot be highly reliable (Fig. 4-10).
Fig. 4-10 Correlation between found landmarks and score of map task
Subjects who took more pictures in virtual world remembered buildings they saw compared with others (r = .66, p<.05). Making an action during gameplay, in this case taking pictures, could help subjects notice and remember buildings in the virtual city (Fig. 4-11).
5
Discussion
One quiz application and two VR applications were developed for this research, especially for data collection. For application development, Unity was used. For 3D models required to represent virtual environment, the 3D modeling software Blender was used. To produce immersive VR environment, HTC Vive and Oculus Rift CV1 were used.
Using these applications and devices, the experiment was conducted. Twenty three (23) university students aged 18 to 19 participated. In the experiment, there were five tasks in total: survey questionnaire on form, mental rotation quiz application, VR direction quiz application, VR city explore application, and paper task with the map of VR city.
According to the experiment results, the faster mental rotation ability a person has, the quicker he/she can figure out directions on a map. But in terms of accuracy, the significant correlation between mental rotation and skill of figuring out directions wasn’t found. Mental rotation is the ability to rotate mental representations, so whether it’s a 3D object or a map, a person who can understand 3D objects faster should be able to read maps faster. The accuracy was expected to have a correlation, but it didn’t. The reason why accuracy didn’t correlate could be that the average score of the VR Direction Quiz was quite high and scores weren’t so varied (M = 10.86, SD = 1.49) compared to Mental Rotation Quiz (M = 5.09, SD = 1.28). The highest score of the VR Direction Quiz is 12 and Mental Rotation Quiz is 7, so if adjusting each quiz’s scores to the scale of 10, the scores of Mental Rotation Quiz are more dispersed (M = 7.27, SD = 1.82) than VR Direction Quiz (M = 9.04, SD = 1.24). Therefore, the VR Direction Quiz needed to have more difficult questions to make a more diverse score among subjects.
It turned out that by making a certain action, a person could remember what he/she sees. In the virtual city, subjects could take as many pictures as they wanted, and the correlation was found between the number of pictures subjects took and the number of buildings they remembered seeing. As described in the Literature Review above, people can pay more attention to certain things [4]. It can be supposed that this action, that is, taking pictures in the virtual world, enhanced this attention and helped subjects remember buildings.
Personal lifestyle or life environment does not affect spatial recognition. For example, hometown, confidence in spatial recognition, and how often one goes out, none of them produced significant differences or correlations.
However, surprisingly, subjects who less care about landmarks could remember more landmarks than others. But the sample size was small, so this result might not be reliable. Rather than the environment a person is in, a perspective or preferences he/she has would have more influence on spatial recognition.
The virtual environments designed for this research were different from real environments and game-based environments, so subjects’ behaviors would be different from real world behaviors. But at least what can differentiate the people who get lost and others who don’t is the speed of mental rotation and the amount of attention or actions toward landmarks.
6
Conclusion
Three applications were developed aimed at figuring out differences among people who get lost and others who don’t. These applications are based on psychological ability named ‘mental rotation’ and research about how virtual environments can affect user’s learning and perception. In experiments with these applications, data of spatial recognition, what he/she notices and how he/she decides the route to a certain destination, were collected. According to the experiment results and analysis, the speed of mental rotation can affect the speed of figuring out directions. Making certain actions can be helpful to remember landmarks. Personal lifestyle or environment were not crucial for spatial recognition.
6.1
Limitations
Collecting a large amount of data from subjects such as university students is challenging. The whole experiment took about 30 minutes just for one person. The duration for the experiments were short and limited due to the development of the VR applications and the target students’ schedule.
The VR applications were designed to simulate walking in real world. But still those applications were virtual; in other words, different from the real world after all. Even though subjects could move around the virtual environment, that movement was totally different from movements in the real world where subjects literally and physically move their bodies. It seemed that some subjects regarded the VR applications and experiments as video games too much and consequently tried to finish the gameplay as fast as possible. It’s a common way of playing video games, like racing games or shooting games. For instance, subjects said they enjoyed playing VR applications, and one subject said, “I played this application as if I play FPS (first person shooter) game”. Those subjects were subsequently quite surprised when they saw a paper task which tests how much they remembered seeing in VR. It’s true that to keep subjects interested, VR applications were designed to be enjoyable and game-like. But, because of this approach, the difference between virtual walking in these VR applications and real world walking might have increased.
6.2
Future Work
As described earlier, in VR applications for this research, no physical movement was required to move around in the virtual environments. But using devices which make a person move his/her legs physically, like a treadmill, the representation of virtual environment can be more natural. Eye tracking can be used to determine more accurately if a subject locates specified buildings.
The main purpose of this research was just to determine the differences of spatial recognition between people who get lost and others. Developed applications followed that purpose. But based on found differences in the future, other VR applications could be developed in order to help people improve their spatial recognition.
Acknowledgements
I would like to thank Professor Michael Vallance, Takurou Magaki, Naoto Naito, and Yuto Kurashige for their help. Their feedback and collaborations really contributed to complete this research.
I’d also like to express my appreciation to Professor Kaoru Sumi, Associate Professor Atsuko Tominaga, and Professor Ian Frank for their comments and opportunities to share ideas.
Thanks to 23 1st year students and 2 4th year students in Future University Hakodate who joined in the experiment and played the developed applications that subsequently enabled the data that was collected to evaluate and compare spatial recognition.
References
[1] M. Murakoshi, Why do people rotate a map?, Shueisha, 2001.
[2] N. Shingaki, The Science of Houkou-Onchi; What's the Difference Between People Who Get Lost and Others?, Kodansha, 2001.
[3] Y. Hakoda, Cognitive Psychology, Yuhikaku, 2010.
[4] M. V. Mollison, “Event-related potentials in humans during spatial navigation,” Brandeis University, 2005.
[5] B. Tversky, “ Cognitive maps, cognitive collages, and spatial mental models, ” Spatial
Information Theory A Theoretical Basis for GIS, pp. 14-24, 2005.
[6] G. Optale, U. Cosimo, B. Valentina, M. Silvia, P. Lamberto, P. Konstantinos, G. Luciano, C. Salvatore and B. Adalberto, "Controlling Memory Impairment in Elderly Adults Using Virtual Reality Memory Training: A Randomized Controlled Pilot Study," Neurorehabilitation and Neural
Repair, vol. 24, no. 7, pp. 348-357, 2009.
[7] H. Fujioka, T. Chiaki, N. Hironori and O. Hirotomo, "Research on the space cognition of children on a sketch map -Correlation with the environmental change and space cognition in Makuhari-," Journal of Environmental Information Science, vol. 18, pp. 7-12, 2004.
[8] H. Q. Dinh, W. Neff, H. F. Larry, S. Chang and K. Akira, "Evaluating the Importance of Multi-sensory Input on Memory and the Sense of Presence in Virtual Environments," Proceedings of the
IEEE Virtual Reality, pp. 222-228, 1999.
[9] M. DeLoura, Game Programming Gems, Born Digital, 2001.
[10] S. Davis, N. Keith and N. Eugene, "A Systematic Review of Cybersickness," Proceedingsof the
Appendix A Example script
using System.Collections;using System.Collections.Generic; using UnityEngine;
public class PlayerMove_Vive : MonoBehaviour { PlayerState state;
bool flag1 = false; bool flag2 = false; [SerializeField] GameObject target; [SerializeField] VR_HandState handState; [SerializeField] SoundPlayer soundPlayer; void Start() { state = GetComponent<PlayerState>(); } void Update() { if (state.isStarted) {
Vector2 currentPosition = state.currentSubPath.GetPosition (); List<SubPath> nextPaths = state.nextSubPaths;
flag1 = handState.isTriggered; if (flag1 && !flag2) {
foreach (var nextPath in nextPaths) {
Vector2 sub = nextPath.GetPosition () - currentPosition; Vector3 dir = new Vector3 (sub.x, 0, sub.y);
float angle = Vector3.Angle (dir, target.transform.forward); if (angle <= 40) { state.currentSubPath = nextPath; soundPlayer.Play(); } } } flag2 = flag1; } } }
Appendix B Letter of Acceptance
Appendix C Questionnaire
Figure Index
Fig. 3-1 Unity ... 4
Fig. 3-2 Visual Studio ... 5
Fig. 3-3 Blender ... 6
Fig. 3-4 Mental rotation quiz ... 7
Fig. 3-5 Example of 3D geometrical object ... 7
Fig. 3-6 VR Direction Quiz... 8
Fig. 3-7 Virtual map ... 8
Fig. 3-8 Answering a direction... 9
Fig. 3-9 Arrows for answers... 9
Fig. 3-10 Example of instruction ... 10
Fig. 3-11 3D model of 50 meter high building ...11
Fig. 3-12 3D model of car park ... 12
Fig. 3-13 VR City Explore ... 12
Fig. 3-14 Yellow sphere at the goal... 13
Fig. 3-15 Arrows which show directions a user can move ... 13
Fig. 3-16 Virtual camera ... 14
Fig. 3-17 Picture taken by virtual camera ... 15
Fig. 3-18 Instruction text... 16
Fig. 3-19 Example of street data ... 17
Fig. 3-20 Roads ... 17
Fig. 3-21 Virtual city being generated ... 18
Fig. 3-22 Virtual city just filled with 3D objects ... 19
Fig. 3-23 Same buildings colored automatically and differently ... 19
Fig. 3-24 Virtual city updated by other scripts... 20
Fig. 4-1 Blank map for paper task ... 23
Fig. 4-2 City structure used for the task ... 23
Fig. 4-3 List of choices ... 24
Fig. 4-4 A student plays mental rotation quiz ... 25
Fig. 4-5 A student plays VR applications ... 25
Fig. 4-6 Average score of map task ... 26
Fig. 4-7 Correlation of total time between Mental Rotation Quiz and VR Direction Quiz ... 27
Fig. 4-8 Correlation between total time of Mental Rotation Quiz and VR Direction Quiz ... 27
Fig. 4-9 Correlation between face angle and found landmarks ... 28
Fig. 4-10 Correlation between found landmarks and score of map task ... 28
Fig. 4-11 Correlation between taken pictures and map task ... 29
Fig. A-1 Example Script for Player Control ... 34
Fig. B-1 Letter of Acceptance ... 35