Genetic and Phenotypic Characterization of
Tomato Mutants Exhibiting Upward Curly Leaf
(curl), Isolated from Micro-Tom Mutant
Collections
著者
Sri Imriani Pulungan
year
2018
その他のタイトル
マイクロトム変異体コレクションから単離したトマ
トcurl変異体の遺伝学的及び形態学的解析
学位授与大学
筑波大学 (University of Tsukuba)
学位授与年度
2017
報告番号
12102甲第8590号
URL
http://doi.org/10.15068/00152188
i
Genetic and Phenotypic Characterization of Tomato Mutants
Exhibiting Upward Curly Leaf (curl), Isolated from Micro-Tom
Mutant Collections
September 2017
ii
Genetic and Phenotypic Characterization of Tomato Mutants
Exhibiting Upward Curly Leaf (curl), Isolated from Micro-Tom
Mutant Collections
A Dissertation Submitted to
the Graduate School of Life and Environmental Sciences,
the University of Tsukuba
in Partial Fulfillment of the Requirements
for the Degree of Doctor of Philosophy in Agricultural Science
(Doctoral Program in Biosphere Resource Science and Technology)
i
Table of contents
Abbreviations………. iii
Chapter 1: General Introduction……….………. 1
1.1. General introduction………. 2
1.2.The objectives of this study………...7
Chapter 2: Genetic Analysis and Determining the Responsible Gene of the Curly Leaf Mutants………..8
2.1. Introduction………9
2.2. Materials and methods………. 12
2.3. Results ………....19
2.4. Discussion……….26
Chapter 3: Phenotypic Characterization of the Curl Mutants………..67
3.1. Introduction ……… 68
3.2. Materials and Methods………...71
3.3. Results ………75
3.4. Discussion……… 78
Chapter 4: Hormonal Content, Histological, and Gene Expression Analysis of the curl Mutants ………...102
4.1. Introduction……….103
ii
4.3. Results ………...107
4.4. Discussion………...………....110
Chapter 5: General Discussion and Summary ………...122
5.1 General Discussion..……….123
5.2 Summary...………...131
Acknowledgements………135
iii
Abbreviation a.a. : amino acid
AC : Ailsa Craig bp : base pair
CAPS : cleaved amplified polymorphic sequences cDNA : complementary DNA
ch : chromosome cM : centi-morgan curl : curly leaf
DAS : day after sowing
dCAPS : derived cleaved amplified polymorphic sequences EDTA : ethylene diamine tetraacetic acid
EMS : ethyl methanesulfonate EtBr : ethidium bromide FAA : formalin acetic acid IAA : indole-3-acetic acid LAX : like AUX1
MT : Micro-Tom
NBRP : National BioResource Project NGS : next generation sequencing PM : plasma membrane
qRT-PCR : quantitative reverse transcription-PCR SEM : scanning electron microscope
SGN : Solanum Genomics Network SNP : single nucleotide polymorphism TAE : Tris-acetate-EDTA
TILLING : Targeting Induced Local Lesions IN Genome TFs : transcription factors
WAS : week after sowing WES : whole exome sequence WGS : whole-genome sequence WT : wild-type
1
Chapter 1
2
1.1 Introduction
Leaves are the major plant organs whose primary function involves photosynthesis. Leaves play a major role in sensing the quality, quantity and duration of light, all of which are crucial for complete plant growth and development. Understanding leaf initiation and development are important subjects in plant biology. Many aspects of leaf development have been well documented due to their importance and intriguing characteristics (Kalve at al., 2014).
Formation and development of a normal leaf is a complex process that involves several stages including the initiation and differentiation of leaf primordia, the specification of leaf identity and polarity, the balanced cell division and expansion, as well as vascular formation and spesification (Yu et al., 2005; Liu et al., 2011). These processes are influenced by a combination of several factors, such as hormones, transcriptional and post-transcriptional regulators and the morphological properties of the tissue (Bar and Ori, 2014). Leaf initiation and development are also sensitive to genetic and environmental factors. In most dicotyledonous plants, leaf primordia are formed from proliferative and undifferentiated cells in the shoot apical meristem (SAM) (Blein at al., 2013; Floyd and Bowman, 2010). The rates of cell division and elongation at each stage are known to govern the final shape of the plant and throughout the leaf developmental process. Following leaf initiation, three axes are established, proximo-distal, medio-lateral, and dorso-ventral (reviewed by Bar and Ori, 2014).
Most leaves are dorsoventrally (upper to bottom) flattened and develop distinct upper (adaxial) and lower (abaxial) surfaces. Balanced coordination of polarity, auxin response, and cell division is essential for formation of normal and flat leaves development. Any imbalance of these coordination results in altered leaf shapes such as curly, crinkly, twisted, rolled, radial, or shrunken leaves (Yu et al., 2005; Liu et al., 2010; Liu et al., 2011; Serrano-Cartagene et al., 2000). The formation of flat leaves enables the optimum capture of sunlight during photosynthesis.
3
In recent decades, extensive studies have been carried out in several model species to dissect the complex mechanism of leaf initiation, growth, and development. Several genes and transcription factors (TFs) controlling leaf adaxial and abaxial fates have been characterized. Adaxial and abaxial fates are specified and regulated by the antagonistic interaction of several transcription factors. Six families of TFs have been reported to control adaxial-abaxial polarity in the model plant Arabidopsis thaliana; class III homeodomain-leucine zipper (HD-ZIP), ASYMMETRIC LEAVES (AS), KANADI (KAN), AUXIN RESPONSE FACTOR (ARF), FILAMENTOUS FLOWER (FIL), and YABBY3 (YAB3) (reviewed in Nakata and Okada, 2013). Adaxial and abaxial fates are specified and regulated by the antagonistic interaction of these TFs. In addition to these TFs, micro RNAs (miRNAs) are also known to regulate abaxial-adaxial leaf polarity through post-transcriptional gene expression (Han et al., 2004).
Another important factor in controlling leaf morphogenesis is the phytohormone auxin. indole-3-acetic acid (IAA) is the natural form of auxin that controls various aspects plant growth and development, including cell division, expansion and differentiation, leaf initiation, and morphogenesis. One of the unique and intriguing features of auxin is its transport (Paciorek et al., 2005; Tromas and Perrot-Rechenmann, 2010). It is known that auxin is synthesized in young leaves and in the shoot apex and is transported basipetally to all plant organs (reviewed in Bennet et al., 1998; Tromas and Perrot-Rechenmann, 2010). Auxin transport involves two patterns: long-distance transport through phloem and short-distance or cell-to-cell transport called polar auxin transport (PAT). At the cellular level, IAA is distributed through a combination of membrane diffusion (passive uptake), carrier-mediated uptake or proton-driven distribution (Delbarre et al., 1996). PAT contributes to 85% of short-distance auxin transport. It is well established that polar auxin localization controls the direction of auxin movement in whole-plant organs.
4
and PGP/MDR-like proteins. AUX1/LAX is reported to be an auxin influx carrier that facilitates auxin movement from outside the cell to inside the cell, while PIN is an efflux carrier that pumps auxin from the cell into the intercellular space. PGP/MDR-like proteins are reported to have the ability to be either influx or efflux carriers (Yang and Murphy, 2009), but the contribution of these proteins is considerably small compared to that of the AUX1/LAX and PIN families (Kramer and Bennet, 2006; reviewed in Swarup and Peret, 2012).
There are numerous studies highlighting the effects of mutations in AUX/LAX gene family in the model plant Arabidopsis. However, most studies have focused on root phenotypes. For instance, the AUX1/LAX family has been reported to promote lateral root emergence and formation (Marchant et al., 2002; Swarup et al., 2008; reviewed in Peret et al., 2009), root gravitropism (Bennet et al., 1996; Marchant et al., 1999), and root-pathogen interactions (Lee et al., 2011). Recently, AUX1 function in the aerial parts of plants has received interest, but studies are still considerably scarce. In Arabidopsis, AUX1 has been reported to control phyllotaxis patterning (Bainbridge et al., 2008), vascular patterning, xylem differentiation (Fabregas et al., 2015), and leaf serration (Kasprzewska et al., 2015). Additionally, although PAT is governed and maintained by the coordinated action of AUX1/LAX and PIN carrier proteins, among auxin carriers, PIN1 is the most studied. The role of the PIN protein family in leaf morphogenesis is well documented, yet the role of AUX1/LAX remains neglected or is underestimated. Furthermore, almost all studies have been carried out in the model plant Arabidopsis, while the role of auxin influx carriers in other model plants such as tomato is poorly understood.
Our research group has developed a mutant tomato population of the ‘Micro-Tom’ cultivar generated by γ-ray irradiation and ethyl methanesulfonate (EMS) treatment (Saito et al., 2011). We isolated six lines of curly leaf (curl) mutants from the ‘Micro-Tom’ mutant population as previously described (Saito et al., 2011; Shikata et al., 2016). The curl mutants showed
5
dorsoventrally impaired leaf flatness, which exhibited severe upward bending on the transverse axis. Forward genetics is an approach of determining the responsible gene for a phenotype. Several forward genetics strategies based on WGS have been reported in the model plant species Arabidopsis and rice (reviewed in Schneeberger et al., 2009). Next-generation mapping and MutMap methods (Austin et al., 2011; Abe et al., 2012) used similar approach (reviewed in Garcia et al., 2016).
To date, several publicly available DNA marker databases have led to map-based cloning strategies using PCR-based markers combined with next-generation sequencing (NGS) technology, dramatically reducing the time and cost of causal gene identification in mutants as well as improving the efficiency of the identification process (Ariizumi et al., 2014; Garcia et al., 2016). NGS has emerged as a powerful tool to detect numerous sequence variant within shorter time. In tomato, several years ago, a high-quality genome sequence has been publicly available for the cultivar ’Heinz 1706’ (Tomato Genome Consortium, 2012). More recently, the miniature cultivar ‘Micro-Tom’ has also been sequenced (Kobayashi et al., 2014). This effort has made utilizing NGS approach to investigate responsible gene largely possible. Exome sequence is a NGS method that target only small region in genome, which only target in the protein coding. The amount of data produced by whole-exome sequence (WES) much more manageable compared to WGS (reviewed in Warr et al., 2015). Recently, NGS strategy using WES has been proven to accelerate forward genetics in several plant species (Mascher et al., 2014; King et al., 2015; reviewed by Hashmi et al., 2015). In addition, the use of exome sequences has also been proven to be a significant tool for accelerating breeding programs. These advantages have made WES a promising approach for investigating the genes responsible for controlling mutant phenotypes. Therefore, in this study, I used the WES to investigate the responsible gene for the loss-of-function of mutant that preceded by map-based cloning approach.
6
By contrast, reverse genetics is the approach that starts from known a protein or DNA and then works backward to make a mutant gene, ending up with a mutant phenotype. Targeting- Induced Local Lesions IN Genomes (TILLING) has been established as a reverse genetic approach for mutant screening generated by point mutation like EMS. This method was initially reported in Arabidopsis (McCallum et al., 2000a, 000b), as a high- throughput reverse genetics tool for screening mutants. The TILLING technology has several advantages over other reverse genetic strategies. For example, with allelic series screening of mutants with known gene of interest, we could find unbiased by phenotype selection, in the loss-of-function and partial loss-of-function of mutants. And it is possible to screen novel function of alleles that often provide more valuable information (reviewed in Stemple et al., 2004). Our research group has successfully developed TILLING platform in tomato ‘Micro-Tom’ cultivar (Okabe et al., 2011), and the same author has also reported that the TILLING platform provides an opportunity to isolate novel mutant alleles for functional genomic studies and breeding (Okabe et al., 2012). Therefore, in this study, beside applying forward genetics approach to investigate the responsible gene for the curly leaf mutant phenotype, I applied TILLING as a reverse genetics approach to screen another nonsense mutation and to validate the phenotype consistency.
In this study, through map-based cloning combined with WES, I characterized several alleles of the curly leaf mutants, which have nonsense mutation in the SlLAX1 gene. I reported that the SlLAX1 gene, potential as an auxin influx carrier, controls leaf flatness in tomato. This feature has never been characterized in any plant species. The characterization of several alleles of single curl mutants in this study sheds light on the pivotal role of SlLAX1 in controlling leaf flatness mediated by normal adaxial-abaxial cell expansion. I also combined forward and reverse genetic approaches to validate the candidate gene. Using TILLING technology, I screened another nonsense mutant allele that consistently shows an indistinguishable curly leaf
7
phenotype with that of the curl mutants obtained by a forward genetic approach.
1.2 Objective of this study
The objectives of this study are (1) to investigate the responsible gene controlling the curly leaf (curl) mutant phenotype (2) to characterize the morphology and genetic features of the curl mutants (3) to characterize the role of the responsible gene in leaf morphogenesis.
8
Chapter 2
Genetic Analysis and Determining the Responsible Gene of
the Curly Leaf Mutants
9
2.1. Introduction
Tomato (Solanum lycopersicum L.) is an economically important crop in both tropical and in temperateregions. It is widely cultivated in almost all countries and it is used for both as fresh consumption and as raw material for processing industries. Tomato belongs to Solanaceae family that contains a large number of important crops consumed by human beings. It is considered as one of the main sources of nutrition to support our health. In fact, tomatoes contain a lot of nutrition, minerals and vitamins, recognized as important functional compounds such as lycopene, one of the bright red carotenoids, serving as antioxidant agent that contribute to human diet (Passam et al., 2007). Besides that, tomatoes are also known as a good source of folic acid, potassium, vitamin A and C (Davies and Hobson, 1981). Due to its potential health benefit, tomato has received much interest in recent years.
Furthermore, tomato has been selected as an excellent model plant for genomic studies in the Solanaceae family, particularly as the most important model system for fleshy fruit development, vegetative development as well as a model for climacteric fruit (Giovannoni, 2004). Additionally, in 2012, the tomato genome sequence has also been published (Tomato Genome Consortium, 2012). This effort can be valued as a significant achievement for accelerating tomato research both in basic and in applied researches as well as for breeding program. Among tomato cultivars, ‘Micro-Tom’ is widely used as research material due to its excellent characteristics such as rapid life cycle, suitable for indoor cultivation, and easy to transform (Meissner et al., 1997; Emmanuel and Levy, 2002; Marti et al., 2006). In recent decades, various aspects in tomato researches including physiology, biotic and abiotic stress response, genetic and molecular biology have been established.
One of important factor in biological research to know gene function is mutagenesis. Physical and chemical mutagens are often used to induce genetic variation in genome. For instance, using EMS and fast-neutron mutagenesis, Menda et al., (2004) had developed tomato
10
mutant population which were generated from ‘M82’ cultivar background. And more recently, using EMS treatment Gady et al., 2009 and Minoia et al., 2010 had developed new mutant population derived from cv. Red Setter and cv. TPAADASU background. In ‘Micro-Tom’ background, several mutant collections generated from various either physical or chemical mutagen sources have also been reported (Meissner et al., 1997; Meissner et al., 2000; Mathews et al., 2003).
Our research group has developed a mutant tomato population of the ‘Micro-Tom’ cultivar generated by γ-ray irradiation and EMS treatment (Saito et al., 2011). I isolated six lines of curly leaf (curl) mutants from the ‘Micro-Tom’ mutant population as previously described (Saito et al., 2011; Shikata et al., 2016). The curl mutants showed dorsoventrally impaired leaf flatness, which exhibited severe upward bending on the transverse axis/ hyponastic leaf. Forward genetic approach through the isolation of gain-of-function or loss-of-function mutants has accelerated our understanding of some biological processes and facilitated both investigations of genes responsible for phenotypes of interest and investigations of gene function. To date, several publicly available DNA marker databases have led to map-based cloning strategies using PCR-based markers combined with NGS technology, dramatically reducing the time and cost of causal gene identification in mutants as well as improving the efficiency of the identification process (Ariizumi et al., 2014; Garcia et al., 2016). Recently, NGS strategy using whole-exome sequence WES has been proven to accelerate forward genetics in several plant species (Mascher et al., 2014; King et al., 2015; reviewed by Hashmi et al., 2015). In addition, the use of exome sequences has also been proven to be a significant tool for accelerating breeding programs. Moreover, the use of exome sequences is also more affordable compared to the use of whole-genome sequences. These advantages have made WES a promising approach for investigating the genes responsible for controlling mutant phenotypes.
11
In this chapter, I conducted map-based cloning combined with the WES to investigate the responsible gene controlling the curl mutant phenotype. Then, the mutation was also confirmed by direct sequencing method. Furthermore, to check the phenotype consistency, using TILLING technology as a reverse genetic approach, I screened a new mutant allele which carried a nonsense mutation in the SlLAX1 gene. This new mutant allele was then grown and the sequence was checked by direct sequencing.
12
2.2 Material and Methods 2.2.1 Plant Materials
Tomato (Solanum lycopersicum cv. Micro-Tom) curly leaf (curl) mutants were generated by EMS (ethyl methanesulfonate) and γ-ray irradiation. The mutants were obtained from the National BioResources (NBRP) Project at the University of Tsukuba (Saito et al., 2011; Shikata et al., 2016). The NBRP accession numbers are listed in the Table 2.1. From the M3
mutagenized population, I isolated six lines of the curly leaf phenotype mutants, herein referred to as ‘curl’ mutants. The mutant screening was carried out visually using mature plants showing severe curly leaf phenotypes. Five mutant alleles, curl 1-5, were generated by γ-ray irradiation, and one mutant allele, curl-6, was generated by EMS mutagenesis. Furthermore, using TILLING methodology, I screened another EMS mutant, curl-7. These mutants were registered in the TOMATOMA mutant database (Saito et al., 2011, http://tomatoma.nbrp.jp/). Unless otherwise stated, further analyses of the curl mutants were conducted after two backcrosses to the WT ‘Micro-Tom’ to remove any possible background mutation following the mutagenesis treatment.
2.2.2 Growth Condition
Plants were grown both in a cultivation room and a greenhouse facility of Gene Research Center, University of Tsukuba. In the cultivation room, light was supplied for 16 h. Air temperature was set at 25 ºC. The plants were watered once a day with commercial nutrient solution (Otsuka number 1 and 2, Otsuka Chemical Co. Ltd., Osaka, Japan). For seed germination, seeds of WT ‘Micro-Tom’ and the curl mutants were sown on wet filter paper to stimulate germination. Approximately seven days after sowing, seedlings were transplanted into a rock wool (5 cm3) pot. The rock wool pots were covered by aluminum foil to prevent
13
2.2.3 Segregation analysis and allelism test
To perform the segregation analysis, each mutant line was backcrossed to the wild-type (WT) ‘Micro-Tom,’ and the F1 hybrids were self-pollinated to obtain an F2 population. Then,
the ratio between mutant and WT phenotype was recorded. The mutants were also crossed to another tomato cultivar ‘Ailsa Craig’.
The allelism test was carried out by crossing all possible pairs of mutants to check for the presence of the curly leaf phenotype in the F1 generation. Reciprocal crossings were also
performed.
2.2.4 Genomic DNA Extraction
Genomic DNA was extracted from 2-month-old plants. A maximum of 300 mg of fresh leaf sample was frozen in liquid nitrogen and immediately ground using a TissueLyser (Qiagen, Germany). Genomic DNA was extracted using a Maxwell 16 Tissue DNA Purification Kit (Promega, Madison, USA). DNA concentration was measured by a spectrophotometer (NanoDrop 2000c, Thermo Scientific).
2.2.5 Construction of mapping population, DNA marker using SNP, CAPS and dCAPS. To perform rough mapping using DNA markers, curl-2 was crossed to another tomato cultivar, ‘Ailsa Craig’, to obtain a mappingpopulation. From approximately 100 plants of the F2 mapping
population, 19 plants exhibiting the curly mutant phenotype were isolated, and genomic DNA was extracted from the leaves of the individual plants. These plants were subjected to rough mapping experiments. The PCR mix solution and PCR program are described in the table 2.2, 2.3, 2.4, and 2.5, respectively. All SNP, CAPS and dCAPS DNA markers were designed according to the AMF2 (F2: S. lycopersicum ‘Ailsa Craig’ x S. lycopersicum ‘Micro-Tom’) linkage map
information that publicly available from the Kazusa DNA Research Institute (KDRI) webpage (http://marker.kazusa.or.jp/Tomato/, Shirasawa et al., 2010). The primers used for PCR are described in Table 2.6.
14
Thermal cycling to amplify CAPS and SNP DNA markers was conducted using a 3-step cycle as follows: pre-denaturation at 95°C for 2 min, denaturation at 95 °C for 25 sec, annealing at 55-58 °C for 45 sec, 30-35 extension cycles at 72 °C for 30 sec, and final extension at 72 °C for 5 min. After PCR amplification, 7.5 µl of PCR product, 2 µl of buffer, and 0.15 µl of restriction enzyme (New England Biolabs: Toyobo; Nippon Gene or Takara, Japan) were used for the enzymatic reaction. This reaction was incubated at 37 °C or 60 °C for at least six hours. The primers and enzymes used are described in Table 2.6. After performing the enzymatic reaction, a 3-5 µl solution was used for electrophoresis. Electrophoresis was performed using 1x TAE buffer at 100 V for 20-30 min. Electrophoresis was conducted using 2-3% agarose gel and 1 µl of SYBR Safe DNA Gel Stain (Invitrogen, USA) per 100 ml of TAE buffer. Subsequently, after conducting electrophoresis, the agarose gel was placed in an ethidium bromide (EtBr) solution for 10-15 min, after which the banding pattern was checked using a UV transilluminator.
2.2.6 Exome sequence and variant identification
WES was performed to narrow down the candidate genes. Four alleles, 1, 2, curl-3, and curl-6, of the curl mutants of the F2 mutant population that was backcrossed to the WT
were used. The mutants and WT phenotypes were selected in the F2 population based on the
presence or absence of curly leaves among approximately 100 F2 plants for each line, after
which their DNA samples were bulked based on phenotype. Exome sequence analysis was then performed based on the Roche exome sequence SeqCap® EZ SR protocol
(http://sequencing.roche.com/). Briefly, genomic DNA was treated with a Covaris® S220
Ultrasonicator (Covaris, Massachusetts, USA) to achieve an average length of 200 bp. Then, a multiplex NGS library was constructed using a KAPA® Library Preparation Kit and SeqCap®
adapter kit (Roche, Basel, Switzerland). After constructing the NGS library, exome capture was conducted using a custom probe set that was designed based on the tomato genome reference
15
version SL2.40 (supporting dataset, Sol Genomics Network, https://solgenomics.net). This probe set was designed to capture 49.5 Mb of exonic DNA regions (supplementary data S1). The resultant exome library was amplified by 14 cycles of post-capture ligation-mediated PCR with KAPA HiFi HostStart ReadyMix (Roche) and then subjected to Illumina HiSeq-2000 sequencing set to the 100-bp paired-end mode. Paired-end short read data were subjected to quality filtering using FASTXToolkit with the parameters of –Q 20 –P 90. Then, short reads were aligned to the tomato genome reference version SL2.50 using bowtie2 software with the following parameters: L,0,-0.16 --mp 2,2 --np 1 --rdg 1,1 --rfg 1,1. On average, 98.8 ± 0.03% of the target exonic regions was covered by short reads. The average read depth was 18 ± 1.5. Genome-wide DNA polymorphisms and mutations were identified based on the alignment results by the HaplotypeCaller function of the Genome Analysis Toolkit (GATK) with the following parameters: -mmq 5 -forceActive -stand_call_conf 10 -stand_emit_conf 10. The resultant DNA variant information was further combined into one genomic VCF dataset with the GenotypeGVCFs function of the GATK. Three wild-type WES datasets (accession No. DRR097500 to DRR097502, DNA Data Bank of Japan (DDBJ)), two wild-type whole-genome NGS datasets (DDBJ accession No. DRR097503 and DRR097504), and one publicly available wild-type whole-genome NGS dataset (Kobayashi et al., 2014) were used as controls to remove intra-cultivar variations that are present between wild-type ‘Micro-Tom’ lines. DNA variants were further removed if their allele frequencies exceeded >90% in wild-type F2 bulked
segregants because they were also expected to be intra-cultivar variations. Those variants with < 20% allele frequency or with a read depth < 6 were also removed because they were likely to be false-positives. WES datasets for curl mutants are available in DDBJ (accession No. DRR097492 to DRR097502).
16
2.2.7 RNA extraction
Maximum 100 mg of leaf was placed in 1.5 ml sterile tube and immediately frozen in liquid nitrogen and then grinded using pestle until completely become fine powder. RNA was extracted using a commercial kit, RNeasy Plant Mini Kit (Qiagen, Germany), according to manufacturer’s protocol. This step was combined with removing any contamination of genomic DNA using ‘on column DNA digestion step’ (RNase-Free DNase, Qiagen, Germany). RNA concentration was measured by a spectrophotometer (NANODROP, Thermo Scientific, 2000c). Then, the extracted RNA was immediately stored in a -80 oC refrigerator.
Subsequently, to avoid any contamination of genomic DNA, another step of genomic DNA removing procedure was conducted using RNA Clean & Concentrator™-5 (Zymo research, USA). Maximum 10 µg of RNA was used for this reaction according to manufacturer’s protocol. In the final step, RNA was diluted using 10-15 µl of nuclease free water and RNA concentration was measured.
2.2.8 cDNA synthesis
A 2000 ng RNA was used for the cDNA synthesis. cDNA was synthesis using a SuperScript III First-Strand Synthesis (Invitrogen, ThermoFisher Scientific, USA) in 20 µl reaction volume using oligo(dT)12-18 primer. Oligo(dT)12-18 primer was used because we expected to
obtain full-length cDNA. During this process, 1µL of RNaseOUT was also applied. The final concentration of cDNA was 100 ng/ µL. This cDNA was used as stock for qRT-PCR gene expression as well as sequencing analysis. The synthesized cDNA was stored in a -30 oC
refrigerator.
2.2.9 qRT-PCR analysis
mRNA expression was quantified using qRT-PCR. A 10 ng/µl cDNA template of three biological replicates was used for SlLAX1 gene expression analysis. The SlActin gene was used as an internal control (Lovdal and Lillo. 2009). qRT-PCR was carried out using a CFX96
Real-17
Time System (Bio-Rad) with SYBR Premix ExTaq II (Ili RNase H Plus; TaKaRa Bio, Japan). The primers used for qRT-PCR are listed in Table 2.7. Relative gene expression was quantified using the ΔΔCT method (Pfaffl, 2001). The primers for qRT-PCR were designed using the
Primer3Plus website (http://primer3plus.com/), using joining two exons in either forward or reverse primer to exclude any potential contamination of genomic DNA. qRT-PCR mix reaction and thermal cycle condition is described in the Table 2.8 and Table 2.9 respectively. For the confirmation of the primers specificity, melting curve of amplified products was analyzed using a regular method, according to the manufacturer’s instructions.
2.2.10 Cloning and sequencing of full-length coding sequence the SlLAX1 gene
Sequencing analysis was performed to confirm the mutation site of the curl mutants according to exome sequence result. The full-length coding sequence (1236 bp) of the SlLAX1 gene from three independent plants was amplified by PCR using KOD plus neo enzyme. Primer sequences are listed in the Table 2.7. PCR mix reaction and condition are described in Table 2.10 and 2.11, respectively. Subsequently, PCR products were loaded onto a 0.8–1.5% agarose gel, which was then electrophoresed for 45-60 min. Next, the band was visualized under 70% UV and then cut either with a gel cutter or blade. Any visible desired product band was individually cut, removed, and subsequently subjected to purification using a Wizard® SV Gel and PCR Clean-Up System (Promega, Madison, USA). DNA purification by centrifugation was applied. The purified PCR product was then cloned into the entry vector pCR8/GW/TOPO (Invitrogen, http://www.lifetechnologies.com/) using an In-Fusion® HD Cloning Kit (Takara Bio USA, Inc.) according to manufacturer’s protocol. Then, plasmids from clones were purified using a FastGene Plasmid Mini Kit (Nippon Genetics, Japan). The plasmid fragment was sequenced using M13 primer (Table 2.7). In the sequencing mix reaction, 450-900 ng of plasmid cDNA and 1 µl of primer (10 pmol) were used, after which distilled water was added to reach a total volume of 21 µl.
18
Sequencing analysis was performed using a 96-capillary Applied Biosystems/ABI 3730xl DNA Analyzer (Thermo Fisher Scientific). The sequencing data were viewed using SnapGene Viewer software. The alignment of nucleotide and amino acid sequences was analyzed using a parallel editor of GENETYX Ver. 11 software.
2.2.11 Screening new SlLAX1 mutant allele by TILLING
To obtain new SlLAX1 mutant alleles and to validate the leaf phenotype consistency, I screened our EMS mutant population using TILLING technology. The TILLING population was previously described by Okabe et al. (2013), and the TILLING experiments were performed as described by Okabe et al. (2011). I attempted to screen for mutations in the coding region of the SlLAX1 gene. The primer pair was designed to span exon 6. Given that exon 6 is the longest exon, I also identified an EMS mutant line, curl-6, that carries a nonsense mutation in exon 6 of SlLAX1. The primer pairs used in the TILLING experiment were forward 5’-TGGTACATGGGAACTAGCTAAGCC-3’ and reverse 5’-ACCTGACGAGCGGATGATTTTC-3,’ which amplified 865 bp of genomic DNA template; the 5’ end of each primer was labeled with DY-681 or DY-781, which are equivalent of IRDye 700 or IRDye 800 (https://www.biomers.net/), respectively.
2.2.12 Statistical analyses
Unless otherwise stated, the data are presented as the mean ± SE (standard error). Student’s t-test (at the 95 and 99% significance levels) was used to analyze the significant level between two values with equal variance. Chi-square (χ2) tests were performed using MS Excel 2016 to
examine the goodness of fit between the expected and observed Mendelian ratio in the segregating F2 population of mutants backcrossed to WT ‘Micro-Tom’, and the degrees of
freedom and expected Mendelian ratio used for monogenic traits were 1 and 3:1 (WT: mutant phenotype), respectively.
19
2.3 Result
2.3.1 Isolation of the curl mutants from the mutant population
Our research group previously developed a large mutant population of ‘Micro-Tom’, a model tomato cultivar, using γ-ray irradiation and EMS mutagenesis (Saito et al., 2011; Shikata et al., 2016). From the M3 generation ofthis mutant population, I isolated six mutant lines
exhibiting a severe curly leaf phenotype (Fig. 2.1 A and B). To investigate the gene responsible for controlling the mutant phenotype, I then characterized these mutants. The newly developed young leaves of the curl mutants were flat and indistinguishable from those of wild-type (WT) (Fig. 2.1, C and D), suggesting that the impairment of leaf curvature was not detectable at the early vegetative stage. The leaves became curly at the later stage and were continuously curly until the end of growing period. The initiation of curly leaves was not related to the transition from the vegetative to the reproductive stage, and the leaf phenotype could not be restored at any stage once the curly leaves had formed. Growing the curl mutants in a high-humidity environment in in vitro culture could not rescue the curly phenotype (Fig. 2.1 E). Additionally, curly leaves continuously appeared regardless of water availability in the soil medium (Fig. 2.1 F and G). The plant water potential of the mutants and WT were also comparable (Table 2.12). These data suggested that the curly leaf mutant phenotype is persistent, irrespective of relative humidity or water availability.
2.3.2 All The curl mutant alleles exhibited monogenic recessive inheritance pattern To examine the inheritance pattern of curl mutants, I crossed the mutants with WT and another tomato cultivar, ‘Ailsa Craig’, and observed the segregation ratio in the F2 population.
Phenotypic observation was carried out visually according to the presence or absence of the curly leaf phenotype in the F2 generation. The mutant phenotype appeared in the F2 generation
only, as a recessive genetic trait (Table 2.13). The ratio of WT and mutant phenotypes fit a Mendelian segregation ratio for monogenic traits (3:1), indicating a monogenic recessive
20
inheritance of all curl mutants. Similarly, in the ‘Ailsa Craig’ background, the inheritance of the curl mutants was also recessive (Table 2.14).
2.3.3 Mutation occurred in the same allele
Allelism test was performed to observe complementation effects among mutant alleles and to examine whether mutations occurred because of the same causal gene. Complementation effect was tested in the F1 generation. All crosses between each pair of mutants showed curly
leaf phenotypes (Table 2.15), indicating that they are allelic (a mutation occurred in the same allele). The curl-6 mutant generated from EMS treatment (see Plant Material) was also allelic with the other mutants which were generated from γ-ray irradiation. After confirming that all curl mutants were allelic, for further analyses, I only used three mutant alleles, namely, curl-1, curl-2, and curl-6.
2.3.4 Map position of the curl locus
To identify the candidate gene controlling the curly leaf phenotype, I performed a map-based cloning approach using PCR-map-based DNA markers including CAPS and SNPs (Shirasawa et al., 2010; Chusreeaeom et al., 2014; Ariizumi et al., 2014; Hao et al., 2017). Tomato has 12 chromosomes, and I used DNA markers that covered all chromosomes (Table 2.16). I used publicly available linkage map information from the Kazusa DNA Research Institute (KDRI) webpage, http://marker.kazusa.or.jp/Tomato/, for AMF2 (F2: S. lycopersicum ‘Ailsa Craig’ x S.
lycopersicum ‘Micro-Tom’). I developed a mapping population from curl-2 crossed with ‘Ailsa Craig’ (see Materials and Methods) and performed rough mapping. I found that the mutation likely occurred in the short arm of chromosome 9 (Table 2.16). The highest ‘Micro-Tom’ allele frequency was observed in this chromosome region between markers tomInf5375 and 14109_151 and ranged from 0.68-0.89, suggesting that the responsible gene could be localized in the short arm of chromosome 9 close to marker 14109_151 (physical position SL2.40ch09: 2052389), Fig. 2.2, Table 2.16.
21
2.3.5 Exome sequence revealed that SlLAX1 gene is commonly mutated in several curl mutant alleles
To narrow down the candidate region obtained by map-based cloning/rough mapping of chromosome, I performed WES. Four lines of the curl mutants, curl-1,2,3 and 6 were used for the WES analysis. The F2 progenies derived from the cross between mutant and wild-type
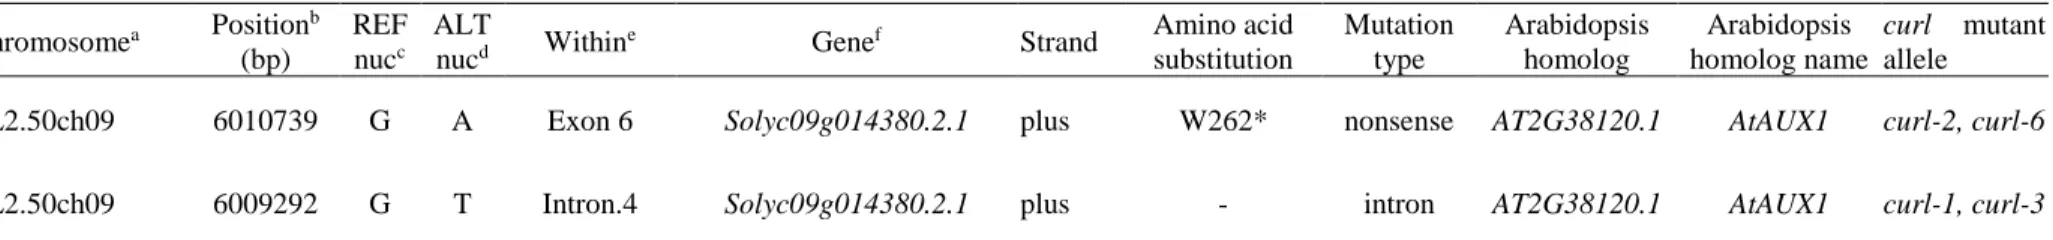
‘Micro-Tom’ were divided into flat leaf and curly phenotype based on presence or absence of curly leaf phenotype, and then flat leaf and mutant bulked segregants were subjected to exome sequencing. By bowtie2-GATK pipeline using the tomato genome reference version SL2.50 as a reference (see Materials and Methods), I identified 5,430, 5,110, 5,050, and 4,829 genome-wide mutations for curl-1, curl-2, curl-3, and curl-6 mutant segregants, respectively. When allele frequencies were compared between these mutants, a strong association was found around the top region of chromosome 9 in all of the four mapping populations (Fig. 2.3). This result suggested that the causal gene for curly phenotype is located in this chromosome region, in agreement with the result of map-based cloning (Table 2.16; Fig. 2.2). Furthermore, I then searched for the gene in which mutation is commonly occurring in some of the curl mutants. I found that mutations are commonly occurring in Solyc09g014380.2.1, which is a homologue of Arabidopsis AtAUX1 (AT2G38120; BLASTx E-value = 0.0, protein amino acid similarity = 93 %). The SlLAX1 gene spans ~3.8 kb genomic region, while cDNA including UTR region spans 1.8 kb. The SlLAX1 has seven exons, including UTR region in both 5’ and 3’ end (Fig. 2.3). The curl-2 and curl-6 had nucleotide substitution from G to A in the exon 6, physical position SL2.50ch09: 6010739 bp (Table 2.17). This SNP produced stop codon instead of tryptophan on the position 262 (W262X). Whereas, curl-1 and curl-3 had SNP from G to T in the splicing junction of intron 4, physical position SL2.50ch09: 6009292 bp.
22
2.3.6 Mutation validation by dideoxy sequencing: the curl mutants produced truncated amino acid and splicing variant
To validate the mutation detected by the WES analysis, I performed dideoxy sequencing of cDNA prepared from the mature curly leaf of four mutant lines used in the WES. I thoroughly cloned the full-length coding sequence of SlLAX1 gene and used the vector primer, M13 (Table 2.7) for sequencing. The genomic, cDNA and amino acid sequences were obtained from the Sol Genomics Network (https://solgenomics.net/) website.
In the curl-2 and the curl-6 SlLAX1 cDNA, I found a single base pair substitution from G to A in the 786th bp within the exon 6 (Fig. 2.4A), in agreement with the WES analysis (Table
2.17). This mutation led conversion amino acid (a.a.) tryptophane to stop codon (Fig. 2.4B). Normal WT produced 411 a.a. fitted to SlLAX1 a.a. reference sequence, whereas the curl-2 and curl-6 produced only 261 a.a., losing the last 150 a.a. (63.7% out of WT protein).
As described above, exome sequencing found that the curl-1 and curl-3 had a mutation in the 1st nucleotide or splicing junction of intron 4 (Table 2.17). Interestingly, sequencing of
SlLAX1 cDNA in these alleles revealed that abnormal splicing is occurred around the intron 4, which led to deletion of five nucleotides within exon 4 (nucleic acid 433-437, Fig. 2.4C). Given that mutation in the curl-1 and curl-3 is G to T substitution in the first nucleotide of intron 4, presumably, there was an alteration in donor and recipient intron splicing. Splicing of intron 4 was occurred in the position of 435 bp from start codon in the tomato genome of the WT, whereas intron splicing is occurred in 5 bp upstream of the end of exon 4 (430 bp from start codon) in both the curl-1 and the curl-3 alleles. Then the next sequence from following exon 5 is GGTTGA; this TGA may produce premature stop codon, which is a position of 435 bp from the start codon (Fig. 2.4D). Thus, curl-1 and curl-3 alleles could produce a C-terminal truncated SlLAX1 protein that is only 145 a.a. length of protein (35% of WT protein, Fig. 2.4 E). Taken together, these dideoxy sequencing results confirmed the mutation revealed by WES
23
analysis in all alleles of the curl mutants.
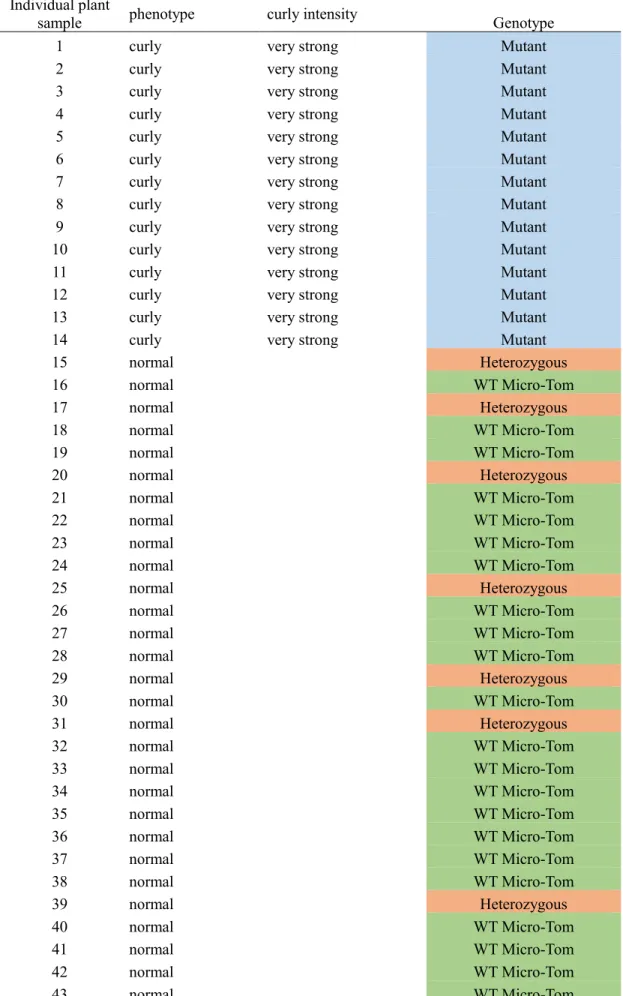
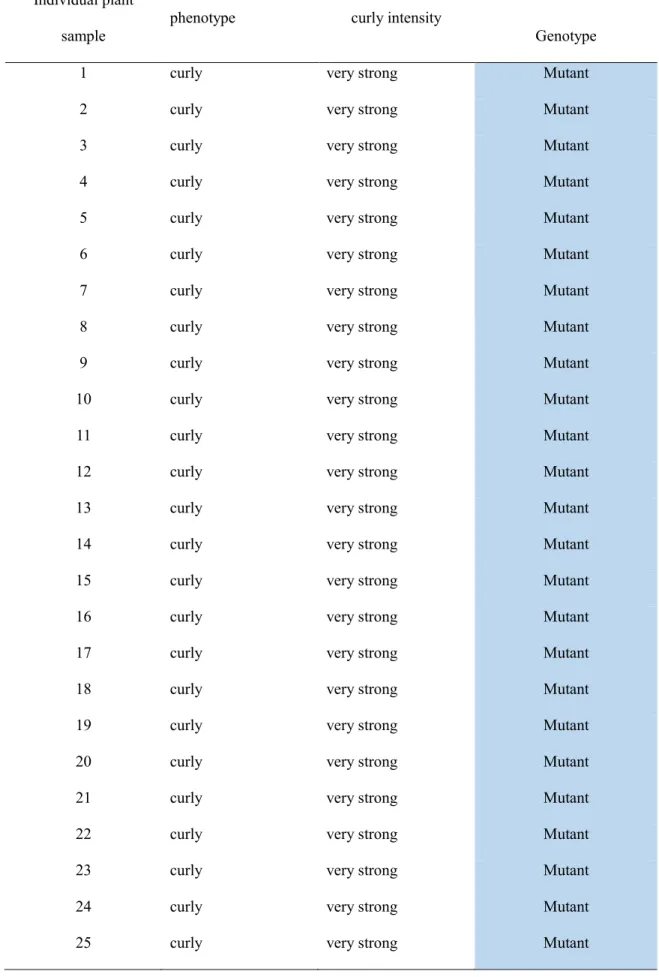
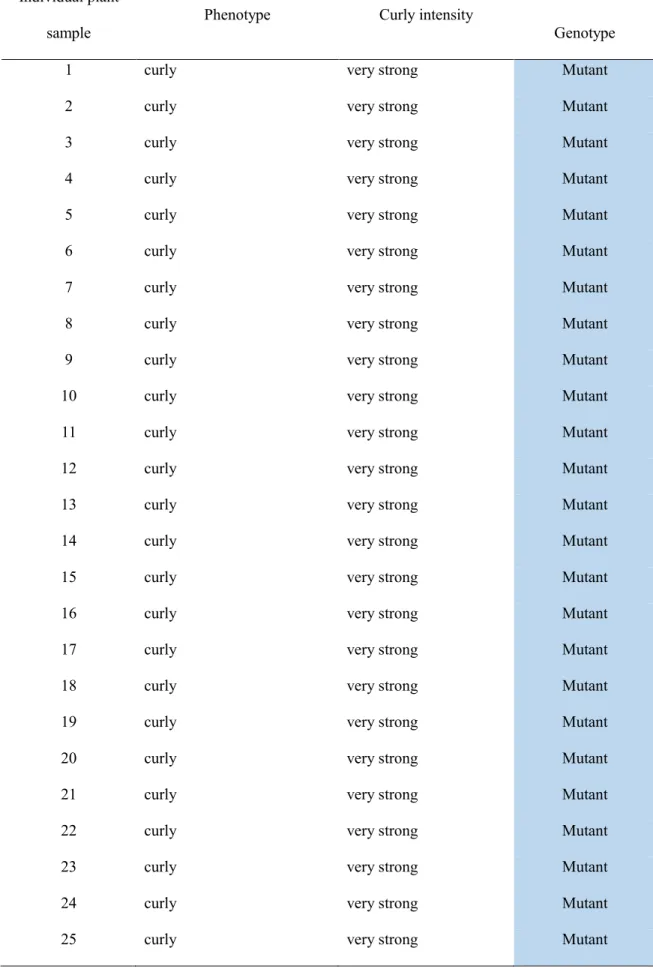
2.3.7. Phenotype-genotype association of the curl mutants in F2 generation
To confirm the exome sequence result whether Solyc09g014380.2.1 is truly responsible gene for this mutant phenotype, I performed several validation methods including dideoxy sequencing, gene expression analysis and checking association phenotype-genotype using dCAPS DNA markers in the mutation site from F2 mapping population in the WT ‘Micro-Tom’
background which were subjected to the WES.
In the F2 generation of mutants which were back-crossed to the WT ‘Micro-Tom’,
phenotypic of all individual was observed based on presence of absence of curly leaf phenotype among approximately 100 F2 plant. Then, the phenotype-genotype association was confirmed
using dCAPS markers that designed in the predicted mutation site according to exome sequence result. For this observation, only three mutant lines were used as representative, curl-1, curl-3, and curl-6. Because they are allelic, I considered that testing these three lines were enough to obtain an evidence. The result showed that all mutant phenotype from each line was perfectly consistent with genotype (Table 2.18, 2.19, and 2.20), indicating the correct predicted SNP or mutation present between the WT and the curl mutant alleles tested in the curl-1, curl-3, and curl-6.
2.3.8 Reduced gene expression of SlLAX1 was observed in the curl mutants
Furthermore, I analyzed the transcript level of the SlLAX1 by qRT-PCR using mature curly leaf cDNA. I designed primers that targeted downstream of the nonsense mutation in exon 6 by joining exon 6 and exon 7 in the forward primer to remove any potential contaminants from genomic DNA. The expression of the SlLAX1 gene in the three curly leaf mutants was significantly reduced to only 35-40% of WT expression (Fig. 2.5), which indicates low abundance of this gene transcript in the mutants.
24
2.3.9 Screening a new allele of nonsense mutation of SlLAX1 by TILLING and validation the phenotype consistency
Because our research group had previously developed large mutant resources in the ‘Micro-Tom’ background and proved that TILLING is an efficient tool for isolating desired mutants from the mutant collection (Okabe et al., 2011), I utilized TILLING to search for other SlLAX1 mutant alleles. Currently, we have 9,216 EMS mutant lines. Among them, I screened 4,608 lines in the M2 and M3 generations to obtain new SlLAX1 mutant alleles. In addition, because
I only had one EMS mutant screened by forward genetics (curl-6), I attempted to obtain other mutant alleles to confirm the phenotype consistency.
I designed a primer pair to amplify 865 bp along exon 6 of the SlLAX1 gene for TILLING screening target and found five new mutant alleles that carried intron, missense, and nonsense mutations (Fig. 2.6, Table 2.21). The curl-6/TOMJPE8506, which was previously identified by forward genetics, was also confirmed by TILLING screening. Then, to validate the mutant phenotype, one line that carried a nonsense mutation, TOMJPW601-1, was renamed as ‘curl-7’ and used for further analysis. TILLING screening showed that this line carries one base pair substitution from G to A in the 185th a.a. that led to the conversion of tryptophan to a premature
stop codon that discarded the last 226 a.a. (Fig. 2.7A). I then grew the screened line and observed the presence of the curly leaf phenotype in the M3 generation. The curl-7 mutant
exhibited curly leaf phenotype like as the other curl mutant alleles (Fig. 2.7B and C). This result supports the evidence that SlLAX1 is the gene responsible for the curly leaf phenotype in tomato.
Furthermore, I performed dideoxy sequencing of the full-length coding sequence of the SlLAX1 gene to validate the TILLING result. Consistent with the predicted result, curl-7 carried a G to A nucleotide substitution in 554th bp (Fig. 2.8A) that produced a nonsense
25
the curly leaf phenotype. Taken together, using a forward genetic approach, I characterized multiple alleles showing that mutation in SlLAX1 produces the curly leaf phenotype, and a reverse genetic approach validated this finding. The mutations in the same gene consistently resulted the same phenotype, strongly suggesting that SlLAX1 functions in controlling tomato curly leaf phenotype.
26
2.4 Discussion
2.4.1 Mutation in the curl mutants is affected by SlLAX1 gene
In this study, I characterized several alleles of tomato mutants exhibiting severe leaf upward-curling phenotypes at the mature leaf stage (Fig. 2.1). This mutant phenotype occurs irrespective of water content or relative humidity (Fig. 2.1E, G; Table 2.12). Six lines were isolated using a forward genetic approach by visually selecting curly leaf phenotypes in a previously generated tomato mutant population (Saito et al., 2011; Shikata et al., 2016).
Map-based cloning combined with WES revealed that the mutation occurred in the SlLAX1 gene (Table. 2.16 and 2.17). Then, to validate the candidate gene by utilizing TILLING as a reverse genetic approach, I screened another nonsense mutation allelic line, curl-7, which was generated by EMS. The curl-7 mutant leaves were indistinguishable from those of the other previously selected lines (Fig. 2.7B, C). Furthermore, I confirmed the full-length coding sequence of SlLAX1 (Fig. 2.8A, B), which supported the evidence that SlLAX1 is likely the gene responsible for the curly leaf mutant phenotype. Taken together, the characterization of multiple alleles in this study that consistently showed indistinguishable phenotypes is strong evidence for the role of SlLAX1 in controlling the curly leaf phenotype.
SlLAX1 (Solyc09g014380) encodes a transmembrane amino acid transporter protein and belongs to the amino acid/auxin permease (AAAP) family. Conserved domain searches indicate that the SlLAX1 amino acid sequence contains one conserved domain, SLC5-6-like_sbd, which is a member of the solute-binding domain superfamily. This superfamily includes the solute-binding domain of SLC5 proteins, SLC6 proteins, and nucleobase-cation-symport-1 (NCS1) transporters. SLC5s co-transports Na+ with sugars, amino acids, inorganic
ions and vitamins (https://www.ncbi.nlm.nih.gov/cdd, Marchler-Bauer A et al., 2015, 2017). Homology searches indicated that the SlLAX1 protein sequence is homologous to Arabidopsis thaliana AtAUX1 (AT2G38120). In Arabidopsis, AUX1 is one of four auxin influx
27
carriers belonging to AUX1/LAX family that controls several developmental processes including gravitropism responses, venation patterns, and lateral roots (Vieten et al., 2007; Bennet et al., 1996). Although recent findings have indicated that the AUX/LAX1 family also control aerial part development such as leaf serration (Kasprzewska et al., 2015), phyllotaxis patterning, vascular patterning, and xylem differentiation (Bainbridge et al., 2008; Fabregas et al., 2015), the role of AUX1/LAX gene family in leaf curling are poorly understood. In contrast, mutations in many auxin-related genes showed an impaired leaf flatness phenotype (Esteve-Bruna et al., 2013; Zgurski et al., 2005). In tomato, few studies have shown a relationship between auxin and leaf flatness; for instance, SlARF4-RNAi lines produce hyponastic leaves (Sagar et al., 2013) and SlPIN4-RNAi lines show leaf flatness defects as well as altered plant architecture (Pattison and Catala, 2012). However, the role of SlLAX1 in controlling leaf curly phenotype has not been reported in tomato or other major crops.
2.4.2 SlLAX1 is essential for controlling tomato leaf flatness
The tomato AUX1/LAX family consists of five genes (SlLAX1-5). They share high identity and similarity; the identity of SlLAX2, SlLAX3, SlLAX4, and SlLAX5 with SlLAX1 are 80.36%, 79.70%, 92.65%, and 80.87%, respectively (Sol Genomics Network). All SlLAX genes are expressed in the mature leave and root of tomato (Pattison and Catala, 2012). These authors reported that all SlLAX genes are expressed in the mature leaves of tomato. The single mutants depleting SlLAX1 used in this study, curl-1-7, showed a severe phenotype effect in leaf flatness, suggesting that the importance of SlLAX1 in controlling leaf flatness in mature leaves, and other SlLAX genes may not have strong function in this process. In agreement with this finding, a study of Arabidopsis roots revealed that among four auxin influx carriers conserved in the Arabidopsis genome, AUX1 was the influx carrier that had the strongest affinity (Peret et al., 2012), although all AUX1/LAX family genes encode functional auxin influx carriers. This finding is also supported by a more recent study conducted by Rutschow et al., (2014), who
28
proposed that AUX1 dominates auxin flux into Arabidopsis protoplasts. This reason presumably explains why the single mutant curl1-7 produced a severe curly leaf phenotype.
Although the functional redundancy of the AUX1/LAX family, in addition to the function of SlLAX1 itself, is poorly characterized in tomato, their function in Arabidopsis is well characterized especially in root development. Like tomato, Arabidopsis has several (four) AUX1/LAX genes that share high identity and similarity. Peret et al. (2012) reported that four Arabidopsis influx carrier family genes regulate the distinct auxin-dependent developmental program and that the coding sequences of AUX1/LAX genes have undergone subfunctionalization. AUX1/LAX genes exhibit nonredundant and complementary expression patterns in roots. Furthermore, these authors also reported evidence of the inability of LAX to rescue aux1 mutant phenotypes with respect to root development. Additionally, the authors also reported that Arabidopsis AUX1/LAX genes perform distinct developmental function. However, these results vary among Arabidopsis tissues observed in the context of phyllotaxy, vascular patterning, and xylem differentiation; AUX1/LAX could play redundant function (Bainbridge et al., 2008; Fabregas et al., 2015). Non-redundancy in tomato has not been reported; nonetheless, this possibility has also to be taken into account. The functional redundancy of SlLAXs family in tomato leaf curling phenotype awaits further investigation.
2.4.3 Curly leaf phenotype of the curl mutants is induced by the loss-of-function of
SlLAX1
AUX1 protein is located in the plasma membrane (PM). Swarup et al., (2004) first reported on the basis of experimental evidence that AtAUX1 has 11 transmembrane domains. Then, by observing root gravitropism and resistance to 2,4-D as the most prominent and well-characterized traits of this mutant, they also well-characterized several allele series of aux1 mutants ranging from null, partial loss-of-function, and missense mutations in order to understand the important functional domains and amino acids within the AUX1 polypeptide. The result
29
suggested that the central region of AUX1, between TM VI and VIII, proven to be particularly important for protein function. Using a publicly available server (http://www.cbs.dtu.dk/services/TMHMM/), I checked the prediction of transmembrane helices in the SlLAX1 protein. The curl-2 and curl-6 mutants carried a mutation in the W262X a.a., which located in transmembrane domain VII. Furthermore, independent research conducted by Peret et al., (2012) also revealed that the N-terminal half of AUX1 is essential for the correct localization of the AUX1 expression domain. I showed that both the curl-1 and curl-3 mutations are located in transmembrane helix IV, where the N-terminal half of SlLAX1 is located (http://www.cbs.dtu.dk/services/TMHMM/). Furthermore, the 1/3, curl-2/curl-6, and curl-7 mutations caused nonsense mutations that can produce only 35, 63, and 45% of the WT protein, respectively (Fig. 2.4B, D, and 2.8A). Additionally, the relative expression of the curl mutant alleles (curl-1, curl-2, and curl-6) was less than 40% compared to that of WT (Fig. 4F). These reasons presumably account for the loss-of-function mutations of the SlLAX1 gene.
30
31
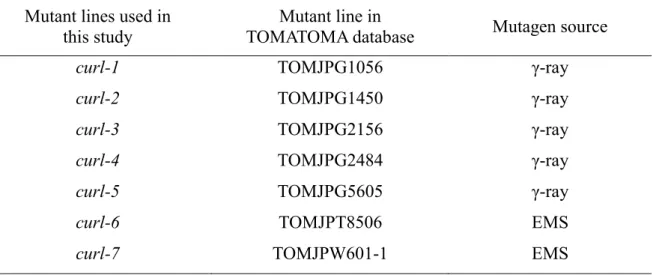
Table 2.1 Description of mutant lines in TOMATOMA mutant collection database and mutagen source
γ-ray: gamma-ray irradiation EMS: ethyl methanesulphonate
Mutant lines used in this study
Mutant line in
TOMATOMA database Mutagen source curl-1 TOMJPG1056 γ-ray curl-2 TOMJPG1450 γ-ray curl-3 TOMJPG2156 γ-ray curl-4 TOMJPG2484 γ-ray curl-5 TOMJPG5605 γ-ray curl-6 TOMJPT8506 EMS curl-7 TOMJPW601-1 EMS
32
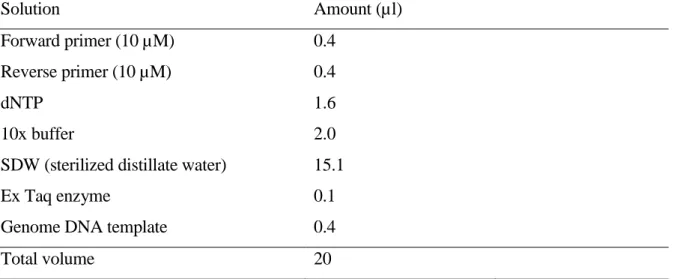
Table 2.2 Reaction mix for PCR amplification of CAPS or dCAPS marker using Ex-Taq enzyme Solution Amount (µl) Forward primer (10 µM) 0.4 Reverse primer (10 µM) 0.4 dNTP 1.6 10x buffer 2.0
SDW (sterilized distillate water) 15.1
Ex Taq enzyme 0.1
Genome DNA template 0.4
33
Table 2.3 Thermal cycle condition for PCR amplification of CAPS or dCAPS marker using Ex Taq enzyme 3-step cycle Pre-denaturation : 94ºC 2 m Denaturation : 94 ºC 1 m 35- 40 cycles Annealing : 55-58 ºC 1 m Extension : 72 ºC 2 m Final extension : 72 ºC 5 m
34
Table 2.4 Reaction mix for PCR amplification of CAPS or dCAPS marker using Go Taq enzyme
Solution Amount (µl)
Forward primer (10 µM) 0.4
Reverse primer (10 µM) 0.4
Go Taq 2x 7.5
SDW (sterilized distillate water) 5.2 Genome DNA template (10 ng/µl) 0.5 - 1
35
Table 2.5 Thermal cycle condition for PCR amplification of CAPS or dCAPS marker using Ex Taq enzyme 3-step cycle Pre-denaturation : 95ºC 2 m Denaturation : 95 ºC 25 s 35 cycles Annealing : 55-58 ºC 45 s Extension : 72 ºC 30 s Final extension : 72 ºC 5 m
36
Table 2.6 Primer sequence and enzymes used on chromosome mapping experiment
a DNA markers locus according to AMF2 (F2: S. lycopersicum 'Ailsa Craig' x S. lycopersicum 'Micro-Tom) linkage map information that publicly available from the Kazusa DNA
Research Institute (KDRI) homepage, http://marker.kazusa.or.jp/Tomato/
Locus Marker Restriction enzyme
Ch Arm Position ( cM )
Forward primer sequence 5’ to 3’
Reverse primer sequence 5’ to 3’
8181_419 CAPS Alu Ⅰ 1 S 27.874 AAATCATCATGCGAACACCA CATACGTTCATGCCACGTTC Tomlnf4286 Hha Ⅰ 1 L CCTAGGTTGAGCACGACGAT GGCCTAAAGATCACAACCCA
10431_124 Rsa Ⅰ 3 S 0 TCATTGGGGGAAAAGAAAAA CTTGGCATTTCCCTTCAAAA 1622_2500 Alu Ⅰ 3 L 117.167 ATTGATGGACCATACGGAGC TGCTGAACCTGATTTACCCC 2325_361 Xho Ⅰ 4 S 37.911 ACGACCCTTCACAGTGTTCC ACTTCACATACCCTGCGGTC 5264_772 Hha Ⅰ 4 L 126.237 CGAAACAAAAGAGCCAAGGA CATCGACAAATTGGTTGTGC 5799_537 CAPS Mbo Ⅰ 5 L 44.081 GGCGACCTGAACTACTTTGAG TCTGAAGTGCCATCAAATCG 8669_1517 CAPS Hha Ⅰ 7 S 9.84 AACGAGAGGAAGGAAGAGCC TTTTCATGAGTTCTGCACGC 19921_317 CAPS Alu Ⅰ 7 L 113.074 TGGGAGGAATGGCTTATCTC GGCCATATTAGTCTACCGAACAA
2404_427 CAPS Alu Ⅰ 8 S 2.144 GCGCATAAAACACAACGAAA CCTACTGTTGCCTTGGGCTA 3194_739 CAPS Rsa Ⅰ 8 L 108.942 CTAATAGCACAAATCGCGCA GTGGATTTGGAAGCTGCTGT tomInf5375 SNP Rsa Ⅰ 9 S 224180 CGAGTAACCAAGGGACCAAA AAAGTTGATGTGGGCAAAGG tomInf2042 SNP Rsa Ⅰ 9 S 527639 TTCAAAGCTTGTCTACCGGC TTTCAACAGGGTCAAAGCGT 7195_279 CAPS Rsa Ⅰ 9 S 636025 GCTGGTTCGGTGAGATTGAT TCAGAAACTCCGCAAAATCC 6033_534 CAPS Mbo I 9 S 1109483 CCATCCACCCCATGATATGT GGTGTTCCGGAAAGCAGTAA 11485_183 CAPS Rsa Ⅰ 9 L 63818080 CTATGCTCAAATGGGGGCTA CAGGTAAAACAAAAATAGAGAGTGC 12496_320 CAPS Hha Ⅰ 10 L 79.045 ACGAGCTACCACCGAAGCTA TGGCAGTTGGTAACTGAACG
3033_96 CAPS Rsa Ⅰ 11 S 10.458 TAATTCTTGGGAACCAGCCA GCAGACACCATCGTTTTCCT 5972_1026 CAPS Rsa Ⅰ 11 L 117.219 ATTAACAGCGACTGGGTTGG TCTACGTGCCTTTCCTTGCT 15328_509 CAPS Hha Ⅰ 12 S 0 AATGTTTCAAAACCACCCCA ATGCAAGCAGGAACGTTAGG
6139_385 CAPS Mbo Ⅰ 12 L 131.316 GTGCTGCCGTTACGTTTACA CCTTGGATCATTTGCAGCTT Ch: chromosome; S: short; L: long; cM: centi Morgan
37
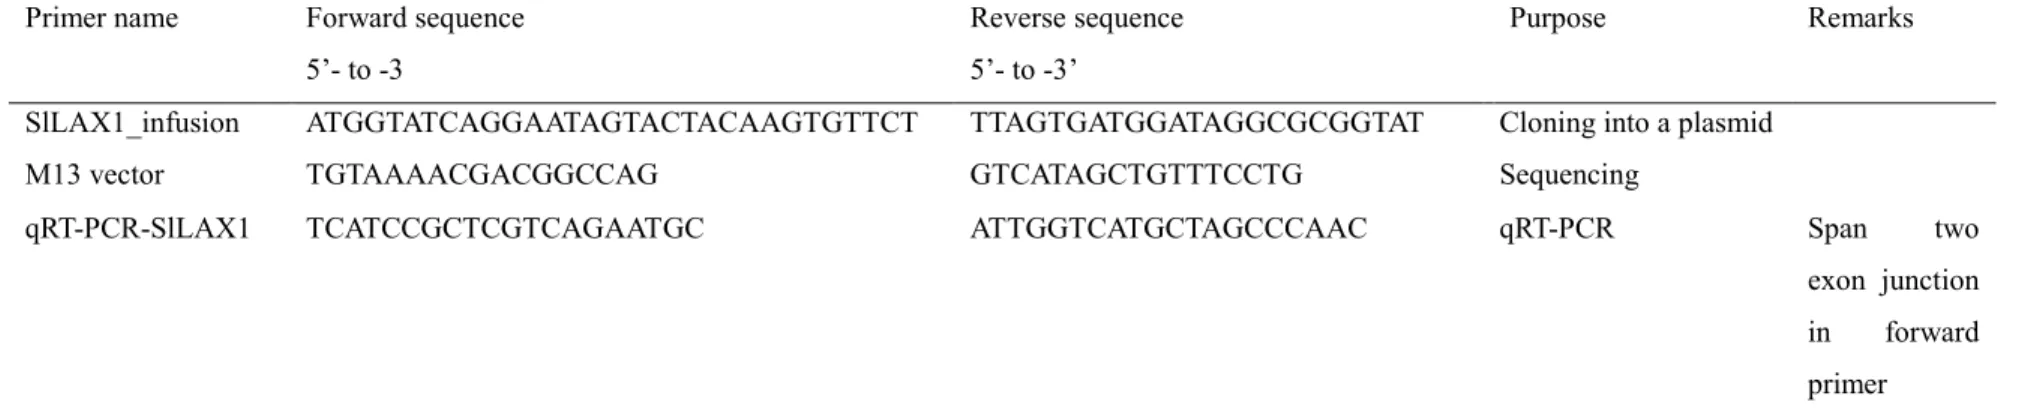
Table 2.7 Primer pair that used for qRT-PCR and gene cloning of SlLAX1
Primer name Forward sequence
5’- to -3
Reverse sequence 5’- to -3’
Purpose Remarks
SlLAX1_infusion ATGGTATCAGGAATAGTACTACAAGTGTTCT TTAGTGATGGATAGGCGCGGTAT Cloning into a plasmid
M13 vector TGTAAAACGACGGCCAG GTCATAGCTGTTTCCTG Sequencing
qRT-PCR-SlLAX1 TCATCCGCTCGTCAGAATGC ATTGGTCATGCTAGCCCAAC qRT-PCR Span two
exon junction
in forward
38
Table 2.8 Reaction mix for qRT-PCR reaction of SlLAX1 gene
Solution Amount (µl)
Forward primer (10 µM) 0.8
Reverse primer (10 µM) 0.8
SYBR Premix Ex Taq II (2x) 10
RNase-free water 7.4
cDNA template (10 ng/µl) 1
39
Table 2.9 Thermal cycle condition for for qRT-PCR reaction of SlLAX1 gene 3-step cycle Pre-denaturation : 95ºC 30 s Denaturation : 95 ºC 5 s 40 cycles Annealing : 60 ºC 30 s Extension : 60 ºC 30 s
40
Table 2.10 Reaction mix for PCR amplification of SlLAX1 gene sequencing using KOD-Plus- Neo enzyme Solution Amount (µl) Forward primer (10 µM) 1.5 Reverse primer (10 µM) 1.5 10x KOD-Plus-Neo buffer 5 2 mM dNTPs 5 25 mM MgSO4 4
SDW (sterilized distillate water) 31
KOD Plus-Neo enzyme 1
cDNA template (10-25 ng/µl) 1
41
Table 2.11 Thermal cycle condition for PCR amplification of SlLAX1 gene sequencing using KOD-Plus-Neo enzyme 3-step cycle Pre-denaturation : 94 ºC 3 m Denaturation : 98 ºC 10 s 40 cycles Annealing : 55-58 ºC 30 s Extension : 68 ºC 2 m Final extension : 68 ºC 7 m
42
Table 2.12 Leaf water potential of the curl mutants.
Values are means ± SE (n=6). Leaf water potential was measured at well-watered condition at the 1st leaflet. Leaf water potential of WT and the curl mutants was comparable.
Line Leaf water potential (Psi)
WT -18.3±0.6
curl-1 -18.5±0.6 curl-6 -18.8±0.4
43
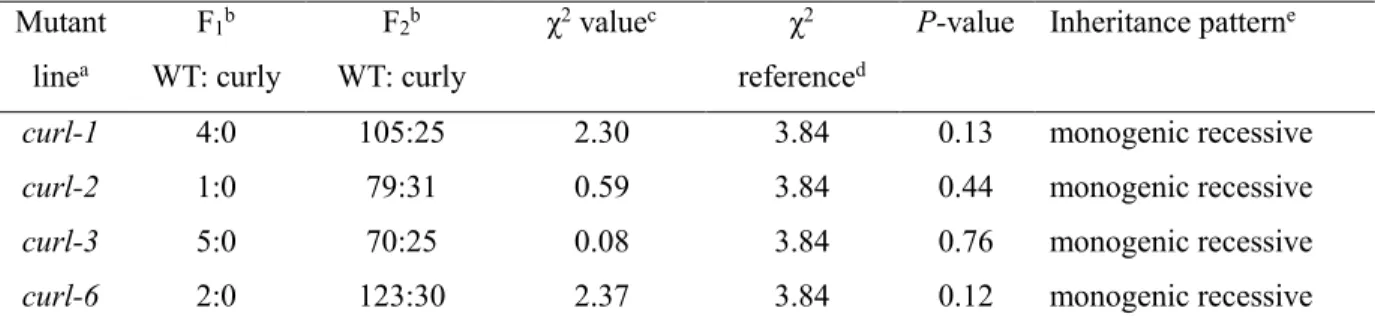
Table 2.13 Segregation analysis of the curl mutants back-crossed to WT ‘Micro-Tom’.
Mutant linea F1b WT: curly F2b WT: curly χ2 valuec χ2 referenced
P-value Inheritance patterne
curl-1 4:0 105:25 2.30 3.84 0.13 monogenic recessive
curl-2 1:0 79:31 0.59 3.84 0.44 monogenic recessive
curl-3 5:0 70:25 0.08 3.84 0.76 monogenic recessive
curl-6 2:0 123:30 2.37 3.84 0.12 monogenic recessive
aThe curl mutants were crossed to the WT ‘Micro-Tom’.
bThe number of progeny exhibiting normal (WT) and curly leaf phenotype is shown. c χ2 value was calculated based on progeny segregation at F
2 population.
d χ2 distribution in the table reference value, with probability >0.05, and degree of freedom 1. e Inheritance pattern of the curl mutants, estimated based on χ 2 value at 95% (P<0.05) significant
44
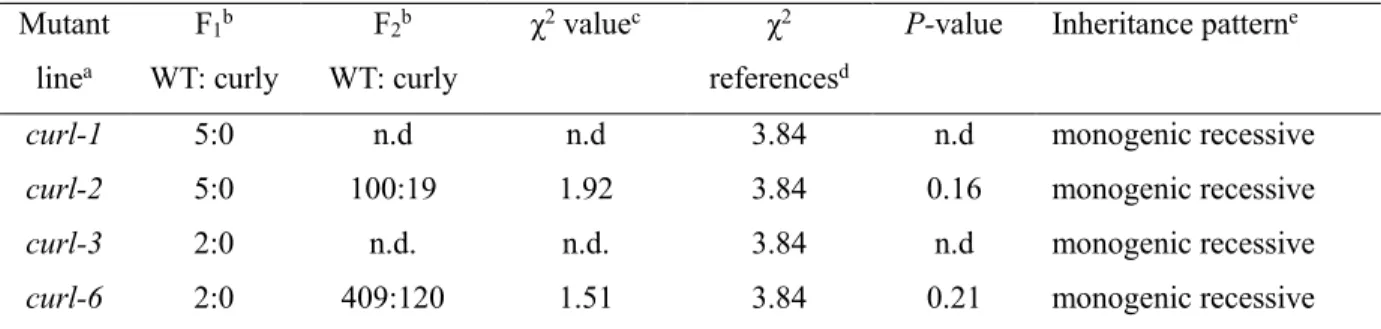
Table 2.14 Segregation analysis of the curl mutants back-crossed to cv ‘Ailsa Craig’.
Mutant linea F1b WT: curly F2b WT: curly χ2 valuec χ2 referencesd
P-value Inheritance patterne
curl-1 5:0 n.d n.d 3.84 n.d monogenic recessive
curl-2 5:0 100:19 1.92 3.84 0.16 monogenic recessive
curl-3 2:0 n.d. n.d. 3.84 n.d monogenic recessive
curl-6 2:0 409:120 1.51 3.84 0.21 monogenic recessive aThe curl mutants were crossed to the WT ‘Micro-Tom’.
bThe number of progeny exhibiting normal (WT) and curly leaf phenotype is shown. c χ2 value was calculated based on progeny segregation at F
2 population.
d χ2 distribution in the table reference value, with probability >0.05, and degree of freedom 1. e Inheritance pattern of the curl mutants, estimated based on χ 2 value at 95% (P<0.05) significant
45
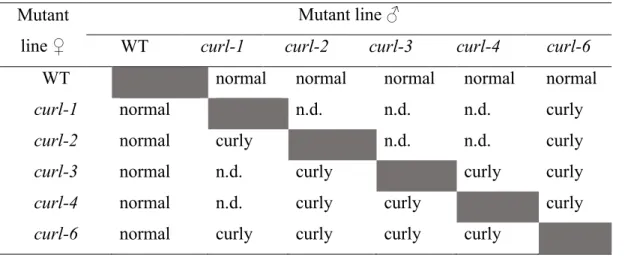
Table 2.15 The result of allelism test among the curl mutants. Mutant
line ♀
Mutant line ♂
WT curl-1 curl-2 curl-3 curl-4 curl-6 WT normal normal normal normal normal curl-1 normal n.d. n.d. n.d. curly curl-2 normal curly n.d. n.d. curly curl-3 normal n.d. curly curly curly curl-4 normal n.d. curly curly curly curl-6 normal curly curly curly curly
The allelism test was carried out by crossing all possible pairs and observing the results at the F1
generation.
The F1 generation phenotype was evaluated visually by observing the presence of a curly leaf
phenotype.
Normal represents the wild-type phenotype Curly represents the curly leaf phenotype. n.d. not determined.
46
Table 2.16 Chromosome mapping using CAPS, dCAPS and SNP markers in the curl-2
Mutation in the curl mutants is likely located in short arm of chromosome 9, close to the marker 14109_151, physical position S.L2.40ch09: 2052389)
DNA markers locus according to AMF2 (F2: S. lycopersicum 'Ailsa Craig' x S. lycopersicum 'Micro-Tom) linkage map information that publicly available from the Kazusa DNA Research Institute (KDRI) homepage, http://marker.kazusa.or.jp/Tomato/.
Ch, chromosome; S, short arm; L, long arm; M, Micro-Tom, A, Ailsa Craig; H, Heterozygous; CAPS, cleaved amplified polymorphic sequences, SNP, single nucleotide polymorphism; dCAPS, derived CAPS.
Marker/locus Ch. arm Indivdual DNA sample from curl-2 x AC F2 Allele frequency (%)
1 2 3 4 5 6 7 8 9 10 11 12 13 14 15 16 17 18 19 MT AC 8181_419 1 S A H M H H A A H H H H H A H H H A H M 0.42 0.58 tomlnf4286 1 L A H M H M A H H A H H H A M H H H H M 0.50 0.50 tomInf6860 2 S A H H A M H H H M A A H A A A H A M A 0.34 0.66 tomInf2289 2 L H H M A M A M H H H A H M H H M M H H 0.58 0.42 10431_124 3 S H A A A A H H A H M H A M H H H M H M 0.45 0.55 1622_2500 3 L H H H A M M H H M H H H A H A H H A A 0.45 0.55 2325_361 4 S A A H A H A H H A A A H H H M A A A A 0.24 0.76 5264_772 4 L H M M H H H H A H H H M H M H H A A M 0.55 0.45 solCAP_51607 5 S M H M M H H H A H H H H H H M A M H H 0.58 0.42 5799_537 5 L M H M M H H H A H H M H H H A H M H A 0.55 0.45 8669_1517 7 S H M H A H H A M M M M H M H M H H A M 0.63 0.37 19921_317 7 L A H H A M H A M H H M M M A A A H A H 0.45 0.55 2404_427 8 S H M H A M H A H H H H M H M A A M M H 0.55 0.45 3194_739 8 L H H H H M A A H H H M M A A H M A A H 0.45 0.55 tomInf5375 9 S M M M H M M M H H H M M M M H M A 0.79 0.21 tomInf2042 9 S M A A H M M M H H H M M M M M A M H H 0.68 0.32 7195_279 9 S M M M H M M M H H H M M M H M H M H H 0.79 0.21 6033_534 9 S M M M H M M M H H M M M M M M H M H M 0.87 0.13 14109_151 9 S M M M M M M H H H M M M M M M H M M M 0.89 0.11 11485_183 9 L H H M H A A M H M H H H H H H M A M H 0.55 0.45 tomInf3936 10 S H A A A A H A A H H A H M M H H H H 0.36 0.64 12496_320 10 L M H H H A A H H M A A H H H H H A A M 0.42 0.58 3033_96 11 S M M H H M M H H H M H H H H M M H A 0.67 0.33 5972_1026 11 L H H M H A H M A H A M M A H H H H H M 0.53 0.47 15328_509 12 S M H H H H H H H H A H H H H M A M H H 0.53 0.47
47
Table 2.17 Predicted mutation position, amino acid substitution, and mutation type based on the whole exome sequence result.
aThe location in the chromosome in the tomato genome
b Position of nucleotide substitution according to tomato genome sequence database, version SL2.50 (Sol Genomics Network) c Tomato genome sequence reference according to the position in column b
d Alternative nucleotide sequence/ nucleotide substitution according to the position in column b e Location of nucleotide substitution of the gene in column f
f Gene mutated according to Sol Genomic Network database
* represents a stop codon
Chromosomea Positionb
(bp)
REF nucc
ALT
nucd Withine Genef Strand
Amino acid substitution Mutation type Arabidopsis homolog Arabidopsis homolog name curl mutant allele
SL2.50ch09 6010739 G A Exon 6 Solyc09g014380.2.1 plus W262* nonsense AT2G38120.1 AtAUX1 curl-2, curl-6