P-66
Wavelet-based multifractal analysis of real and simulated time series of earthquakes
(観測及び人工の地震時系列データに対するウェーブレット法にもとづくマルチ・フラクタル解析) O Bogdan Enescu, Kiyoshi Ito and Zbigniew R. Struzik* *Department of Computer Science, Univ. of Amsterdam, The Netherlands
1. Introduction.
Earthquake hazard and prediction related studies require a good knowledge of the temporal and spatial characteristics of earthquake occurrence.
This study introduces a new method to describe qualitatively and quantitatively the complex patterns of seismicity, their correlation and clustering properties in particular. We present here only the results obtained for the temporal distribution of earthquakes. In a future study we intend to extend the methodology to spatial patterns.
2. Data.
We have analysed the temporal characteristics of four earthquake sequences, two real and other two simulated. The first study–case is the intermediate-depth (h between 60 and 200km) seismic activity in Vrancea (Romania) region, occurred from 1974 to 2002. Then we study the shallow, crustal, seismicity (DPRI data) occurred in a relatively large region surrounding the epicenter of the 1995 Hyogo-ken Nanbu (Kobe) earthquake, from 1976 to 1995. In both cases we have declustered the earthquake catalog (i.e., the aftershocks were removed) before analysis.
To clarify the interpretation of the results obtained for the real earthquake time series, we also considered two “artificial” sequences of events. Firstly, we generate a “low-productivity” earthquake catalog, by using the ETAS model
(Ogata, 1985, 1988)
. We then generate an event-sequence by considering a cellular fault embedded in a-3D elastic half-space (Ben-Zion and Rice, 1993, Ben-Zion, 1996)
. 3. Brief outline of the method.The wavelet analysis is a powerful technique, well-suited to understand deeply the complex features of real-world processes: different “kinds” of (multi)fractality, long-range correlation (LRD – long range dependence), non-stationarity, oscillatory behaviour and trends. Its main advantage is that it can describe a process in both time and frequency (scale) domains simultaneously.
Our approach considers the inter-event times between successive earthquakes as input. We then compute the Continuous Wavelet Transform (CWT) by performing the convolution of the data sequence with the scaled and translated version of the mother wavelet (in this study the second derivative of the Gaussian).
By using only the Modulus Maxima of the CWT, one can accurately determine the “local” characteristics of the signal, more precisely its “local self-similarity”, defined by the Holder exponent h (Muzy et al., 1994, Arneodo et al., 1995). Depending on the value of h, the input series could be long-range correlated (h > 0.5), uncorrelated (h = 0.5) or anti-correlated (h < 0.5).
4. Results and discussion. Conclusions.
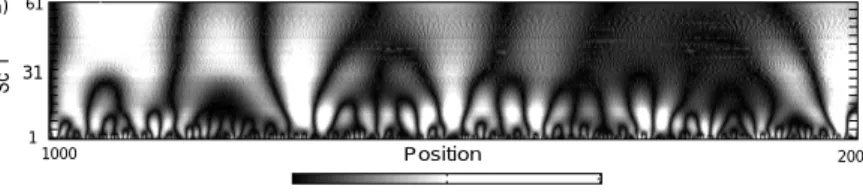
The results obtained in the case of Vrancea region (see the CWT of Fig. 1) show that for a relatively large range of scales the process is quasi-monofractal and random (do not display correlations).
For the second case two scaling regions can be readily noticed. At small scales the series display multifractal behaviour, while at larger scales we observe a monofractal scaling. The Holder exponent for the monofractal region is around 0.8, which would indicate the presence of long-range dependence (LRD). However, this result might be the consequence of the complex oscillatory or power-low trends of the analysed time series.
In order to clarify the interpretation of the above results, we considered two “artificial” earthquake sequences. The results in the case of ETAS simulation, as expected, show no significant LRD. We have also observed monofractal behaviour for a large range of scales. The series simulated by using Ben-Zion’ s (1996) fault model display a clear quasi-periodic behaviour, as revealed by simple statistical tests. The result of the wavelet-based multifractal analysis shows several distinct scaling domains. We speculate that each scaling range corresponds to a different periodic trend of the time series.
Position
a) 61
1
1000 2000
Analyzed Signal (length = 4254)
4
31
Scale of colors from MIN to MAX
Fig. 1 CWT coefficients plot in the case of the Vrancea (Romania) time series, zoomed view. Scale and position are on the vertical and horizontal axis, respectively. A clear self-similar characteristic pattern can be observed.