Noise estimation for diffusion weighted MR image
Poster No.: C-0591
Congress: ECR 2016
Type: Scientific Exhibit
Authors: Y. Kanazawa1
, Y. Konishi1, T. Usuda1, Y. Matsumoto1, H. Hayashi1, M. Matsuda2, M. Harada1; 1Tokushima/JP, 2Tokyo/JP Keywords: MR physics, MR-Diffusion/Perfusion, MR, Physics, Technical
aspects, Education, Image verification, Quality assurance
Any information contained in this pdf file is automatically generated from digital material submitted to EPOS by third parties in the form of scientific presentations. References to any names, marks, products, or services of third parties or hypertext links to third-party sites or information are provided solely as a convenience to you and do not in any way constitute or imply ECR's endorsement, sponsorship or recommendation of the third party, information, product or service. ECR is not responsible for the content of these pages and does not make any representations regarding the content or accuracy of material in this file.
As per copyright regulations, any unauthorised use of the material or parts thereof as well as commercial reproduction or multiple distribution by any traditional or electronically based reproduction/publication method ist strictly prohibited.
You agree to defend, indemnify, and hold ECR harmless from and against any and all claims, damages, costs, and expenses, including attorneys' fees, arising from or related to your use of these pages.
Please note: Links to movies, ppt slideshows and any other multimedia files are not available in the pdf version of presentations.
Aims and objectives
Diffusion weighted (Dw) magnetic resonance image (MRI) is used for analysis of tissue characterization, i.e., intravoxel incoherent motion [1]. Some reports have been published being demonstrated the analysis method, e.g., q-space-analyzed Dw MRI [2], diffusional kurtosis imaging [3], and modified tri-exponential analysis [4]. These most analysis methods have been required high-b-values data of Dw MRI. On the other hand, the signal intensity (SI) tends to become progressively lower as the b-value increases since long Stejskal-Tanner diffusion gradients prolong echo time (TE) [5].
MR images are visualized as magnitude images after applying a pulse sequences. The pulse sequences have reported various methods to improve image quality, e.g., signal-to-noise ratio (SNR), contrast, and imaging artifacts. Particularly, SNR assessment is important for image analysis not to occur systematic error. The noisy MRI data is indicated by Rician statistical distribution [6]. The correction scheme based on the Rician distribution were applied in low signal image analysis, R2* estimation [7], and diffusion tensor imaging [8].
Thus, there might a possibility of evaluation of signal of high-b-value Dw MRI between some pulse sequences. To improve SNR on high-b-value Dw MR images, we developed to signal correction method of noise estimation using Rician probably distribution function (PDF).
Methods and materials
Correction method
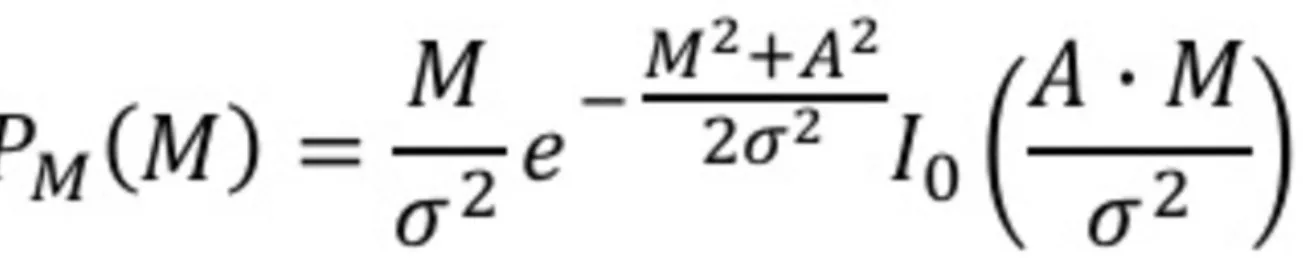
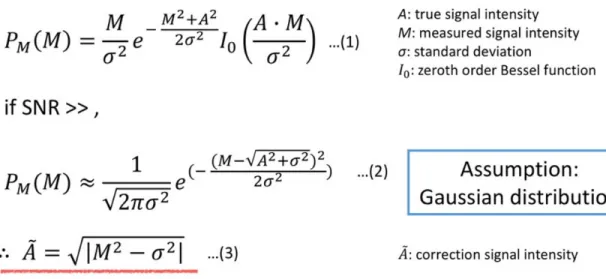
Fig. 1 on page 5 shows an outline of signal correction methodology in our study. The probability density function (PDF) for the Rician distribution for the measured pixel intensity M is given by
Fig. 8: Equation (1), Rician probability distribution function.
References: Health Biosciences, Tokushima University - Tokushima/JP
where A is the true pixel intensity, I0 is the modified zeroth order Bessel function, µ
is mean, and # is the standard deviation (S.D.). When the SNR is high, the Rician distribution is approximated by Eq. (1) [6]:
Fig. 9: Equation (2), Assumption of of Rician probability distribution function as Gaussian distribution.
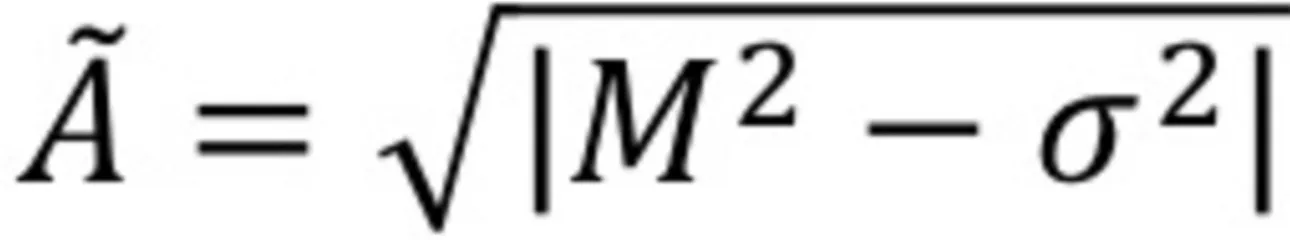
References: Health Biosciences, Tokushima University - Tokushima/JP Then, it was possible to reduce noise by using the following relationship [6]:
Fig. 10: Equation (3), correction signal.
References: Health Biosciences, Tokushima University - Tokushima/JP
where à is the corrected SI. We applied equation (3) as correction scheme in Dw MR images.
Fig. 2 on page 5 shows schematic procedure for estimation of noise signal. True signal values were calculated using curve fitting of Rician distribution function from each Dw MR data. Then, we evaluated the correction factor µ between measured and estimation values of different imaging sequences. The correction factor µ were described as follows:
Fig. 11: Equation (4), correction factor.
References: Health Biosciences, Tokushima University - Tokushima/JP Then, we compared between phantom signal and background (BG) signal.
MR imaging
On a 1.5 T MR scanner system (Signa HDxt, GE Healthcare, Waukesha, WI, USA), Dw MR imaging data of sucrose (Suc) samples (10, 30, and 50 wt%) were acquired. Different imaging sequences of single shot echo-planner imaging (SS-EPI) and dual spin-echo EPI (DSE-EPI) were performed with multi b-values (0 - 7000 s/mm2). Table 1 shows detailed imaging parameters. All imaging analysis were applied by using an in-house program from MATLAB (MathWorks, Natick, MA, USA).
Table 1 Imaging parameters of Dw MRI in our study
Imaging parameters
Setting values Sequences SS-EPI & DSE-EPI
b-values [s/mm2] 0#20#200#500#1000#2000#3000#4000#4500#5000#5500#6000#6500#7000 TR/TE [ms] 5000/129 Slice thickness [mm] 10 FOV [cm2] 12.8 × 6.4 Band width [Hz/ pixel] 166.7
Images for this section:
Fig. 1: Outline of signal correction methodology with Rician distibution in our study. © Health Biosciences, Tokushima University - Tokushima/JP
Fig. 2: Schematic noise estimation procedure.
Results
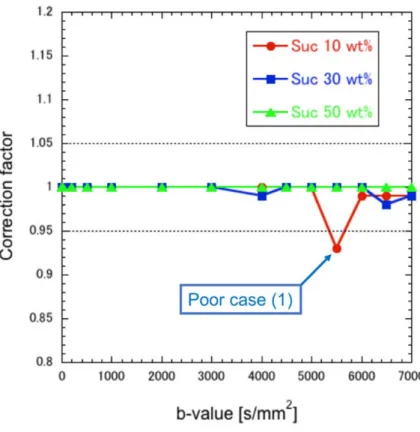
Fig. 3 on page 8 shows relation between b-value and correction factor in Dw MRI of SS-EPI. Mean correction factors of SS-EPI data were Suc 10 wt%, 0.99; Suc 30 wt %, 1.00; and Suc 50 wt%, 1.00.
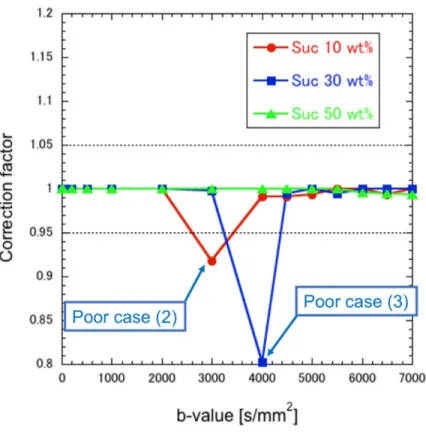
Fig. 4 on page 9 shows relation between b-value and correction factor in Dw MRI of DSE-EPI. Mean correction factor of DSE-EPI data were Suc 10 wt%, 0.99; Suc 30 wt %, 0.98; and Suc 50 wt%, 1.00. At these high values, the ratio of mean signal value to standard deviation value, i.e., SNR were all less than 3.
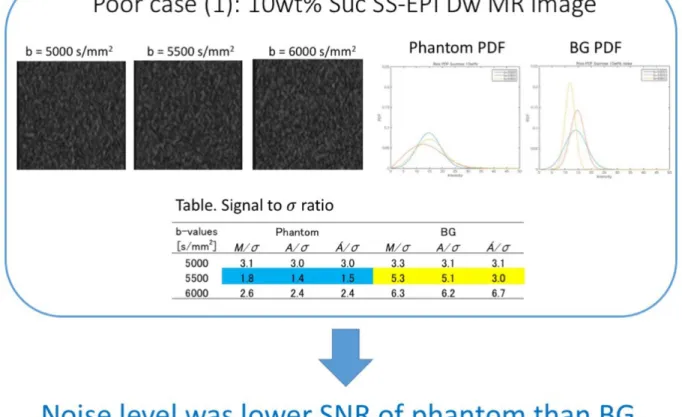
Fig. 5 on page 9 shows poor correction case of 10 wt % sucrose SS-EPI Dwi MRI.
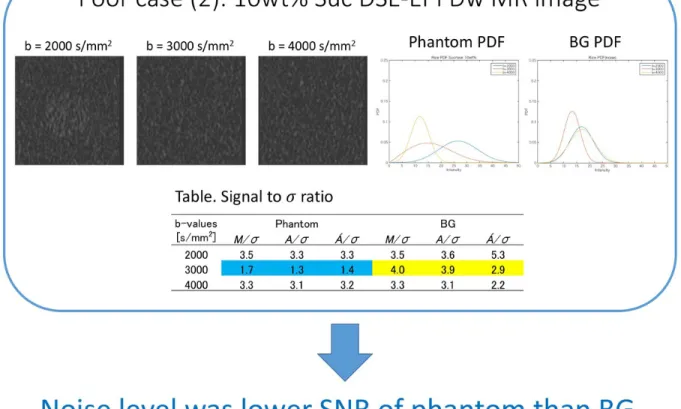
Fig. 6 on page 10 shows poor correction case of 10 wt % sucrose DSE-EPI Dwi MRI.
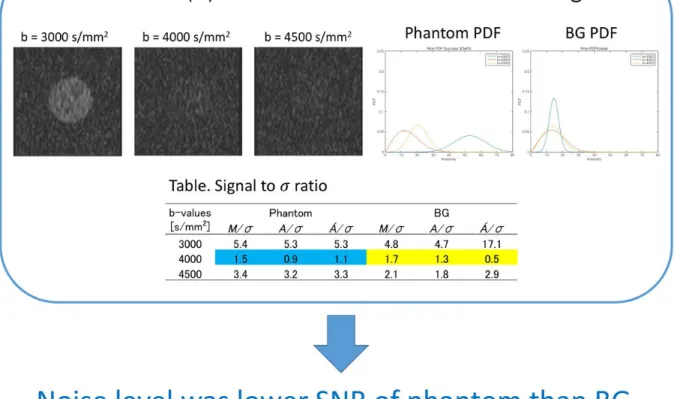
Fig. 7 on page 11 shows poor correction case of 30 wt % sucrose DSE-EPI Dwi MRI. In all poor correction case, these indicated that SNRs of phantom were lower value than BG.
Fig. 3: Scatter Plots shows relation between each b-value and correction factor in Dw MRI of SS-EPI.
© Health Biosciences, Tokushima University - Tokushima/JP
Fig. 4: Scatter Plots shows relation between b-value and correction factor in Dw MRI of DSE-EPI.
Fig. 5: Poor correction case of 10 wt% sucrose SS-EPI Dwi MRI. The correction factor indicated 0.93 at b-value = 5500 s/mm2.
Fig. 6: Poor correction case of 10 wt% sucrose DSE-EPI Dwi MRI. The correction factor indicated 0.92 at b-value = 3000 s/mm2.
Fig. 7: Poor correction case of 30 wt% sucrose DSE-EPI Dwi MRI. The correction factor indicated 0.80 at b-value = 4000 s/mm2.
Conclusion
Signal correction method of noise estimation with Rician PDF makes it possible to obtain more detailed information on Dw MR image having high-b-values.
Personal information
Yuki KANAZAWA, PhD, Assistant Professor
Institute of Biomedical Sciences, Tokushima University Graduate School 3-18-15, Kuramoto-Cho, Toksuhima City, Tokushima, 770-8509, Japan E-mail: [email protected]
References
1. Le Bihan D, Breton E, Lallemand D, Grenier P, Cabanis E, Laval Jeantet M. MR Imaging of Intravoxel Incoherent Motions: application to Diffusion and Perfusion in Neurologic Disorders. Radiology. 1986;161:401-407.
2. Assaf Y, Ben-Bashat D, Chapman J, Peled S, Biton IE, et al. High b-value q-Space Analyzed Diffusion-Weighted MRI: Application to Multiple Sclerosis. Magn Reson Med. 2002;47:115-126.
3. Fieremans Els, Jensen JH, Helpern JA. White matter characterization with diffusional kurtosis imaging. NeuroImage. 2011;58:177-188.
4. Ohno N, Miyati T, Kobayashi S, Gabata T. Modified Triexponential Analysis of Intravoxel Incoherent Motion for Brain Perfusion and Diffusion. J Magn Reson Imaging. 2015; e-pub. doi: 10.1002/jmri.25048.
5. Tanner J, Stejskal E. Restricted self-diffusion of protons in colloidal systems by the pulsed-gradient, spin echo method. J Chem Phys. 1968;49:1768-1777.
6. Gudbjartsson H, Patz S. The Rician Distribution of Noisy MRI Data. Magn Reson Med.1995;34(6):910-914.
7. Yokoo T, Yuan Q, Senegas J, Wiethoff AJ, Pedrosa I. Quantitative MRI of the Liver With Rician Noise Models for Evaluation of Hepatic Iron Overload :