©2015 THE BIOPHYSICAL SOCIETY OF JAPAN Corresponding author: Kota Katayama, Department of Frontier
Mate-rials, Nagoya Institute of Technology, Showa-ku, Nagoya 466-8555, Japan.
e-mail: [email protected]
FTIR study of primate color visual pigments
Kota Katayama
1and Hideki Kandori
11Department of Frontier Materials, Nagoya Institute of Technology, Showa-ku, Nagoya 466-8555, Japan
Received October 27, 2014; accepted December 25, 2014
How do we distinguish colors? Humans possess three color pigments; red-, green-, and blue-sensitive proteins, which have maximum absorbance (λmax) at 560, 530, and
420 nm, respectively, and contribute to normal human trichromatic vision (RGB). Each color pigments con-sists of a different opsin protein bound to a common chromophore molecule, 11-cis-retinal, whereas different chromophore- protein interactions allow preferential absorption of different colors. However, detailed experi-mental structural data to explain the molecular basis of spectral tuning of color pigments are lacking, mainly because of the difficulty in sample preparation. We thus started structural studies of primate color visual pig-ments using low-temperature Fourier-transform infrared (FTIR) spectroscopy, which needs only 0.3 mg protein for a single measurement. Here we report the first struc-tural data of monkey red- (MR) and green- (MG) sensi-tive pigments, in which the information about the pro-tein, retinal chromophore, and internal water molecules is contained. Molecular mechanism of color discrimina-tion between red and green pigments will be discussed based on the structural data by FTIR spectroscopy. Key words: color visual pigment, color tuning, FTIR,
retinal, internal water molecule
Humans have two kinds of vision: twilight vision medi-ated by rhodopsin (Rh) in rod photoreceptor cells and color vision achieved by multiple color pigments in cone photo-receptor cells [1]. Humans possess three color pigments: red-, green-, and blue-sensitive proteins maximally absorb-ing at 560, 530, and 425 nm, respectively [2], and specific
perception of light by the RGB sensors is the origin of color vision. Rh and color pigments both contain a common chromophore molecule, 11-cis-retinal, whereas different chromophore-protein interactions allow preferential absorp-tion of different colors [3]. On the molecular level, studying Rh is highly advantageous because large amounts of protein can be obtained from vertebrate and invertebrate native cells. Consequently, X-ray structures of bovine [4] and squid [5] Rh were determined. Furthermore, in the case of bovine Rh, the structures of photointermediates [6,7], the active state [8,9] and the active state complexed with the C-terminus peptide of the α subunit of G-protein [10] have also been solved. These structures provided insights into the mecha-nism of the chromophore-protein interaction and activation. On the other hand, structural studies of color pigments lag far behind those of Rh, and no color pigment has been crys-tallized thus far.
Old world primates, including humans, acquired green and red pigments, both of which belong to the L (long- wavelength absorbing) group, by gene duplication [1]. They exhibit a difference of 30 nm in their λmax values and their
sequences differ by 15 amino acids [2]. Figure 1a illsuatrates the chromophore and surrounding 27 amino acids (within 5 Å) in bovine Rh. While monkey Rh (MRh) has identical amino acids, about half of them are replaced in MR and MG. E113 is the common counterion of the protonated Schiff base, but E181 is replaced by histidine that functions as a chloride binding site in the L group (Fig. 1b) [11]. Between MR and MG, three amino acids are different near the retinal chromophore, where O-H bearing residues are introduced in MR such as Ser, Tyr, and Thr (Fig. 1b). This is also the case in human green and red pigments. This strongly suggests that these hydroxyl groups are responsible for the different λmax between green and red. This hypothesis was indeed
confirmed by the previous site-directed mutagenesis studies [12–14].
http://www.jstage.jst.go.jp/browse/biophysics
REVIEW
Vol. 11, pp. 61–66 (2015) doi: 10.2142/biophysics.11.61
62 BIOPHYSICS Vol. 11
the chromophore, but not from the protein. Involvement of water dipoles was discussed [24], but no experimental con-firmation has been obtained to date. In contrast, IR spectros-copy is able to provide vibrational signals not only from the chromophore, but also from protein and water molecules [19]. We previously reported difference FTIR spectra of the chicken red-sensitive pigment that was prepared from over 2000 chicken retinae [25], but identification of the vibra-tional bands of proteins is difficult for native proteins.
The first structural data of MR and MG
We expressed MR and MG in HEK293 cell lines for structural analysis using FTIR spectroscopy. As previously reported, light-induced difference FTIR spectra of visual and archaeal rhodopsins at 77 K report on the changes in vibrational modes of the retinal chromophore and surround-ing protein and water molecules [19,26]. Thus, information Another important element in color tuning may be protein-
bound water molecules that can alter the dielectric environ-ment of the retinal chromophore. We have shown an import-ant role of protein-bound water molecules in proton-pumping microbial rhodopsins [15–17]. In fact, proton transfer via a transient linear water-molecule chain in a membrane pro-tein, especially microbial rhodopsins, was discussed recently [18]. Protein-bound water molecules in Rh are experimen-tally monitored by X-ray crystallography [4,5], FTIR spec-troscopy [19–21] and radiolytic labeling method [22,23]. Structural analysis of the protein-bound waters in our color visual pigments is thus intriguing, though indeed challenging.
The structural analysis on the green and red pigments was only reported by resonance Raman spectroscopy, in which the observed vibrational bands were very similar between human green and red pigments, indicating similar chromophore- protein interaction [24]. It should be noted that resonance Raman spectroscopy provides only vibrational signals from
Figure 1 (a) X-ray crystal structure of the chromophore-binding site of bovine rhodopsin (1U19 [4]). The upper and lower regions correspond
to the extracellular and cytoplasmic sides, respectively. The retinal chromophore is shown by yellow space-filling model. Side chains of the 27 amino acids within 5 Å from the retinal chromophore are shown by stick drawing. Ribbon drawings illustrate the secondary structures around the retinal. Corresponding amino acids in MR and MG are identical except for three amino acids shown by orange boxes. (b) Partial amino acid sequences of Rh (bovine and monkey), MG, and MR. 27 amino acids within 5 Å from the retinal chromophore in bovine Rh are shown. The three amino acids that differ in MR and MG are highlighted orange. The residue numbers are based on the bovine Rh sequence. Reprinted with permission from ref. 34. Copyright 2010 Wiley-VCH Verlag.
Katayama and Kandori: Structural analysis of color pigments 63
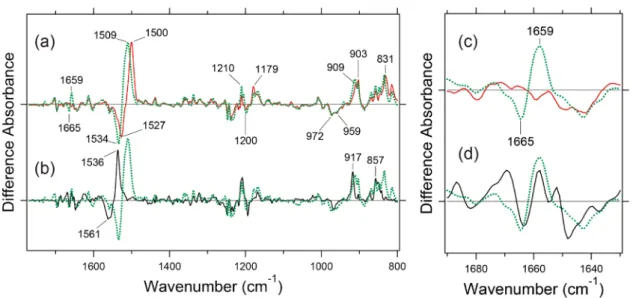
tion that the vibrations due to the retinal chromophore were similar between MR and MG, is consistent with the previ-ous resonance Raman results [24]. On the other hand, a clear spectral difference between MR and MG was seen in the amide-I region. MG possesses the bands at 1,665 (–)/ 1,659 (+) cm–1, which are absent in MR (Fig. 2c). Since the
frequency is characteristic of αII-helix [31], retinal
isomeri-zation accompanies helical structural perturbation in MG, but not in MR. Notably, the spectral features between MG and MRh are slightly changed in the amide-I region, sug-gesting that 3 pigments possess their own structural ele-ments, though they are provided the similar retinal binding pockets due to similar retinal signals in Figure 2a and b.
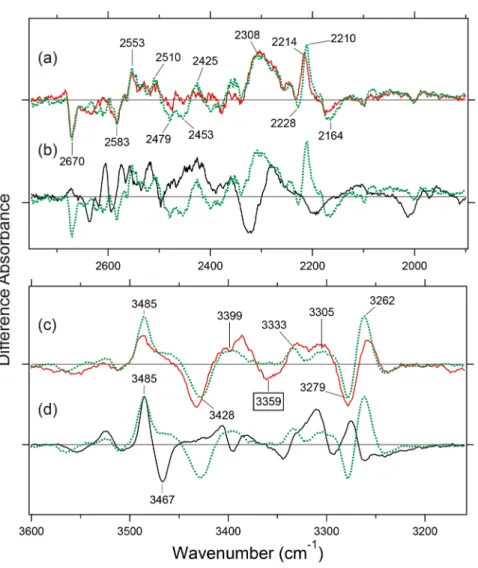
Although the difference FTIR spectra are similar for the 3 pigments in the 1,770–800 cm–1 region, the situation is
entirely different in the X-D (Fig. 3a, b) and X-H (Fig. 3c, d) stretching regions. H-D exchangeable vibrations such as O-D and N-D stretches appear at 2,700–2,000 cm–1 in D
2O.
The spectral features are identical between MR and MG, (Fig. 3a). In contrast, they are very different between MG and Rh (Fig. 3b). These facts indicate that hydrogen- bonding network involving water molecules is similar between MR and MG, but different in Rh.
Spectral comparison in the X-H stretch region (Fig. 3c, d) led to the same conclusion as for the X-D stretch (Fig. 3a, b) in view of the similarity between MR and MG, but not for Rh. Although MR and MG exhibit similar bands in the X-H stretch region, a negative band at 3,359 cm–1 in Figure 3c
was only observed for MR, not for MG. A possible candidate for the 3,359 cm–1 band is one of the 3 amino acids
possess-ing O-H groups (orange box in Fig. 1b). We previously iden-tified O-H stretching frequencies of Thr at 3,500–3,300 cm–1
on local structural perturbation of protein upon retinal photo-isomerization can be obtained. In addition, the information on hydrogen bonds is obtainable from the frequency region of 4,000–1,800 cm–1 that monitors X-H stretching
vibra-tions. The measurements in D2O further isolate H-D non-
exchangeable and exchangeable vibrations at 4,000–2,700 and 2,700–1,800 cm–1, respectively [20,26,27]. We isolated
MR and MG from at least 3 L cultures of HEK293 cells, which were 40-times larger than those of MRh, because the expression level was much lower for MR and MG. Each protein expressed in HEK293 cell lines, was solubilized by a detergent, purified by antibody column, and reconstituted into L-α-phosphatidylcholine liposomes [28]. Since the sample amounts for FTIR spectroscopy were very limited, we were not able to optimize the preparation conditions, and we followed the methods applied for bovine Rh [29,30]. Nevertheless, we were able to obtain spectral data of MR and MG in the entire mid-IR region.
Figure 2 shows light-induced difference FTIR spectra measured at 77 K in D2O. Formation of the batho
inter-mediate is clear from the down-shifted ethylenic C=C stretches of the retinal chromophore at 1,561 (–)/1,536 (+), 1,534 (–)/1,509 (+), and 1,527 (–)/1,500 (+) cm–1 for MRh,
MG, and MR, respectively, which correspond to the red-shift in the visible region. The spectra of MR and MG are very similar (Fig. 2a), but it should be noted that these spec-tra are also similar to that of MRh (Fig. 2b). The reason probably comes from the fact that vibrational signals of the retinal chromophore dominate at 77 K in the spectral region shown in Figure 2, such as C=C stretch at 1,570–1,500 cm–1,
C-C stretches at 1,250–1,150 cm–1, and
hydrogen-out-of-plane vibrations at 1,000–800 cm–1. The present
observa-Figure 2 Light-induced difference FTIR spectra of MR (red curve), MG (green dotted curve) and MRh (black curve) in the 1,770–800 cm–1 (a,
b) and 1,690–1,630 cm–1 (c) regions. Each pigment was irradiated with 543, 501, and 501 nm light (by use of an interference filter) for MR, MG,
and MRh until photo-steady-state mixtures (batho intermediates) were produced. The samples were then irradiated for the reversion from batho intermediates to the original states with >660, >610, and >610 nm, respectively, and difference spectra were obtained between batho intermediates and original states. The spectra are measured at 77 K in D2O. Each spectrum was taken with permission from ref. 34.
64 BIOPHYSICS Vol. 11
only the environment around the retinal.
Figure 4a and b show the X-D stretch region of MR and MG in D2O (red curve) and D218O (blue curve), respectively,
and the spectral changes at 2,700-2,450 cm–1 mostly
origi-nate from water stretching vibrations because of the down-shift by isotope water.
From Figure 4a and b, MR shows 6 positive and 6 nega-tive water bands, while MG shows 8 posinega-tive and 7 neganega-tive water bands. The numbers are comparable or slightly greater than those of Rh (Fig. 4c) [20]. While these peaks seem to be distributed randomly, the averaged frequencies are 2,579 and 2,591 cm–1 for MR and MG, respectively. Since MR and
MG possess the λmax at 560 and 530 nm, respectively, it is
likely that the red-shifted pigments possess protein-bound water molecules at a lower frequency, i.e. under stronger H-bonds. Such correlation may be also applicable for Rh (λmax: 500 nm), because the averaged frequency is 2,600 cm–1
[20]. It should be noted that the frequencies of internal water molecules are determined by their local environments, so in bacteriorhodopsin [27] and pharaonis phoborhodopsin
[32], and the frequency at 3,359 cm–1 suggests considerably
strong hydrogen bond for an O-H stretch. Thus, the MR spe-cific X-H stretch may be the key to understand the unique chromophore-protein interaction in the red pigment.
Protein-bound water molecules in MR and MG
Successful detection of the accurate FTIR spectra in the X-D stretch region motivated us to identify protein-bound water molecules in MR and MG. How are water structures different between color pigments and Rh? The detailed spectral analysis of water can be performed for less-noisy spectra. By further improving of FTIR spectral accuracy, we could identify protein-bound water molecules of MR and MG, which are localized near the retinal chromophore because the protein environment is frozen at 77 K excepting for retinal which can be isomerized by irradiation. This means that the confirmed structural change corresponds to
Figure 3 Light-induced difference FTIR spectra of MR (red curve), MG (green dotted curve) and MRh (black curve) in the 2,750-1,900 cm–1
(a, b) and 3,600-3,160 cm–1 (c, d) regions. The spectra are measured at 77 K in D
2O. The band highlighted at 3,359 cm–1 is unique to MR. Each
Katayama and Kandori: Structural analysis of color pigments 65
similar to those of Rh in the conventional 1,800–800 cm–1
region, whereas the spectra were entirely different in the X-D (2,700–2,000 cm–1) and X-H (3,800–2,800 cm–1) stretching
regions. In addition, some spectral differences containing protein-bound water molecules between MR and MG were observed. Since X-H and X-D stretches are the direct probes of hydrogen-bonding environment, this study opens a new window in understanding the specific chromophore-protein interactions in color pigments. On the other hand, it should be noted that further FTIR analysis by use of mutant and/or isotope labeled proteins enable us to provide more detailed information about and discuss the basis of structure. There-fore, we have performed the measurement of some mutant proteins and isotope-labeled retinal protein, which can pro-vide more detailed information about and discuss the basis of structure. Furthermore, we will go ahead with the struc-tural analysis of monkey blue (MB) using FTIR. Molecular mechanism of our color discrimination can be understood from the structural basis in the end.
Acknowledgments
We gratefully thank the collaborations on this research project, Dr. Y. Furutani, Dr. H. Imai. We also thank Dr. S. Koike, Dr. A. Onishi, Dr. Y. Shichida, Dr. R. S. Molday for providing 293T cell lines, expression vector, and 1D4 anti-bodies, respectively. This work was supported by grants from the Japanese Ministry of Education, Culture, Sports, Science and Technology to H. K. (20050015, 20108014). that the obtained correlation may be accidental.
Neverthe-less, it is also possible that the observed averaged frequen-cies of water reflect from the dielectric environment of the chromophore binding site in MR, MG and Rh.
Positive bands for the all-trans form after photoisomeriza-tion appear at 2,700–2,500 cm–1 in Rh (Fig. 4c). In contrast,
the frequencies of the positive 2,303-cm–1 and 2,308-cm–1
bands for MR and MG, respectively, are much lower than the others, indicating that the water molecule forms a very strong H-bond. The frequencies are lower than that of pure deuterated water in the ice form (~2,400 cm–1), which forms
a tetrahedral H-bonding network. This fact suggests the specific H-bonding donation of water as seen for the inter-action with anions and/or charged amino acids. Among many studies of visual and microbial rhodopsins, we experi-enced similar observation only for halorhodopsin (HR) from
Natronomonas pharaonis [33]. Interestingly, MR, MG and
HR all possess a Cl–-binding site near the retinal
chromo-phore [11,33]. In the previous paper on HR, we discussed that Cl– is weakly hydrated by internal waters, but
photo-isomerization perturbs the local structure of the anion biding site, resulting in the formation of a strong H-bond with the water [33]. This is also possibly the case with MR and MG.
Future Prospects
In this review, we showed the first FTIR spectral com-parison of the red- and green-sensitive color visual pigments in the L group. The FTIR spectra of the color pigments were
Figure 4 Light-induced difference FTIR spectra of MR (a), MG (b), and bovine Rh (c) in the 2,750–1,800 cm–1 region. The spectra are measured
at 77 K in D2O (red curve) and D218O (blue curve), respectively, and green labeled frequencies correspond to those identified as water stretching
vibrations. The gray curve in the 2,700–2,000 cm–1 region represents O-D stretching vibrations of D
2O at room temperature. Each spectrum was
66 BIOPHYSICS Vol. 11
phore upon photoisomerizatio. Biochemistry 34, 14220–14229 (1995).
[20] Furutani, Y., Shichida, Y. & Kandori, H. Structural changes of water molecules during the photoactivation processes in bovine rhodopsin. Biochemistry 42, 9619–9625 (2003). [21] Ota, T., Furutani, Y., Terakita, A., Shichida, Y. & Kandori, H.
Structural changes in the Schiff base region of squid rho-dopsin upon photoisomerization studied by low-temperature FTIR spectroscopy. Biochemistry 45, 2845–2851 (2006). [22] Angel, T. E., Chance, M. R. & Palczewski, K. Conserved
waters mediate structural and functional activation of family A (rhodopsin-like) G protein-coupled receptors. Proc. Natl.
Acad. Sci. USA 106, 8555–8560 (2009).
[23] Angel, T. E., Gupta, S., Jastrzebska, B., Palczewski, K. & Chance, M. R. Structural water define a functional channel mediating activation of the GPCR, rhodopsin. Proc. Natl.
Acad. Sci. USA 106, 14367–14372 (2009).
[24] Kochendoerfer, G. G., Wang, Z., Oprian, D. D. & Mathies, R. A. Resonance Raman examination of the wavelength regu-lation mechanism in human visual pigments. Biochemistry 36, 6577–6587 (1997).
[25] Hirano, T., Imai, H., Kandori, H. & Shichida, Y. Chloride effect on iodopsin studied by low-temperature visible and infrared spectroscopies. Biochemistry 40, 1385–1392 (2001). [26] Kandori, H., Kinoshita, N., Shichida, Y. & Maeda, A. Protein
structural changes in bacteriorhodopsin upon photoisomeriza-tion as revealed by polarized FTIR spectroscopy. J. Phys.
Chem. B 102, 7899–7905 (1998).
[27] Kandori, H., Kinoshita, N., Yamazaki, Y., Maeda, A., Shichida, Y., Needleman, R., Lanyi, J. K., Bizounok, M., Herzfeld, J., Raap, J. & Lugtenburg, J. Local and distant protein structural changes on photoisomerization of the retinal in bacteriorho-dopsin. Proc. Natl. Acad. Sci. USA 97, 4643–4648 (2000). [28] Imamoto, Y., Hirano, T., Imai, H., Kandori, H., Maeda, A.,
Yoshizawa, T., Groesbeek, M., Lugtenburg, J. & Shichida, Y. Effect of anion binding on iodopsin studied by low-temperature Fourier transform infrared spectroscopy. Biochemistry 38, 11749–11754 (1999).
[29] Imai, H., Terakita, A. & Shichida, Y. Analysis of amino acid resi-dues in rhodopsin and cone visual pigments that determine their molecular properties. Methods Enzymol. 315, 293–312 (2000). [30] Nagata, T., Terakita, A., Kandori, H., Kojima, D., Shichida, Y.
& Maeda, A. The hydrogen-bonding network of water mole-cules and the peptide backbone in the region connecting Asp83, Gly120, and Glu113 in bovine rhodopsin. Biochemistry 37, 17216–17222 (1998).
[31] Krimm, S. & Dwivedi, M. Infrared spectrum of the purple membrane: clue to a proton conduction mechanism? Science 216, 407–408 (1982).
[32] Sudo, Y., Furutani, Y., Shimono, K., Kamo, N. & Kandori, H. Hydrogen bonding alteration of Thr-204 in the complex between pharaonis phoborhodopsin and its transducer protein.
Biochemistry 42, 14166–14172 (2003).
[33] Shibata, M., Muneda, N., Sasaki, T., Shimono, K., Kamo, N., Demura, M. & Kandori, H. Hydrogen-bonding alterations of the protonated Schiff base and water molecule in the chloride pump of Natronobacterium pharaonis. Biochemistry 44, 12279– 12286 (2005).
[34] Katayama, K., Furutani, Y., Imai, H. & Kandori, H. An FTIR study of monkey green- and red-sensitive visual pigments.
Angew. Chem. Int. Ed. Engl. 49, 891–894 (2010).
[35] Katayama, K., Furutani, Y., Imai, H. & Kandori, H. Protein- bound water molecules in primate red- and green-sensitive visual pigments. Biochemistry 51, 1126–1133 (2012).
References
[1] Shichida, Y. & Imai, H. Visual pigment: G-protein-coupled receptor for light signals. Cell. Mol. Life Sci. 54, 1299–1315 (1998).
[2] Oprian, D. D., Asenjo, A. B., Lee, N. & Pelletier, S. L. Design, chemical synthesis, and expression of genes for the three human color vision pigments. Biochemistry 30, 11367–11372 (1991). [3] Kandori, H. Protein-controlled ultrafast photoisomerization in
rhodopsin and bacteriorhodopsin. in Supramolecular
Photo-chemistry: Controlling Photochemical Processes. (Ramamurthy,
V. & Inoue, Y. eds.) pp. 571–596 (John Wiley & Sons, Inc., Hoboken, NJ, 2011).
[4] Palczewski, K., Kumasaka, K., Hori, T., Behnke, C. A., Motoshima, H., Fox, B. A., Le Trong, I., Teller, D. C., Okada, T., Stenkamp, R. E., Yamamoto, M. & Miyano, M. Crystal structure of rhodopsin: a G protein-coupled receptor. Science 289, 739–745 (2000).
[5] Murakami, M. & Kouyama, T. Crystal structure of squid rho-dopsin. Nature 453, 363-367 (2008).
[6] Nakamichi, H. & Okada, T. Crystallographic analysis of pri-mary visual photochemistry. Angew. Chem. Int. Ed. Engl. 45, 4270–4273 (2006).
[7] Nakamichi, H. & Okada, T. Local peptide movement in the photoreaction intermediate of rhodopsin. Proc. Natl. Acad.
Sci. USA 103, 12729–12734 (2006).
[8] Choe, H. W., Kim, Y. J., Park, J. H., Morizumi, T., Pai, E. F., Krauss, N., Hofmann, K. P., Scheerer, P. & Ernst, O. P. Crystal structure of metarhodopsin II. Nature 471, 651–655 (2011). [9] Standfuss, J., Edwards, P. C., D’Antona, A., Fransen, M., Xie,
G., Oprian, D. D. & Schertler, G. F. The structural basis of agonist-induced activation in constitutively active rhodopsin.
Nature 471, 656–660 (2011).
[10] Scheerer, P., Park, J. H., Hildebrand, P. W., Kim, Y. J., Krauss, N., Choe, H. W. Hofmann, K. P. & Ernst, O. P. Crystal struc-ture of opsin in its G-protein-interacting conformation. Nastruc-ture 455, 497–502 (2008).
[11] Wang, Z., Asenjo, A. B. & Oprian, D. D. Identification of the Cl–-binding site in the human red and green color vision
pig-ments. Biochemistry 32, 2125–2130 (1993).
[12] Yokoyama, R. & Yokoyama, S. Convergent evolution of the red- and green-like visual pigment genes in fish, Astyanax
fasciatus, and human. Proc. Natl. Acad. Sci. USA 87, 9315–
9318 (1990).
[13] Neitz, M., Neitz, J. & Jacobs, G. H. Spectral tuning of pig-ments underlying red-green color vision. Science 252, 971– 974 (1991).
[14] Asenjo, A. B., Rim, J. & Oprian, D. D. Molecular determi-nants of human red/green color discrimination. Neuron 12, 1131–1138 (1994).
[15] Kandori, H. Role of internal water molecules in bacterio-rhodopsin. Biochim. Biophys. Acta 1460, 177–191 (2000). [16] Garczarek, F. & Gerwert, K. Functional waters in intraprotein
proton transfer monitored by FTIR difference spectroscopy.
Nature 439, 109–112 (2006).
[17] Kandori, H. Hydrogen bonds of protein-bound water mole-cules in rhodopsins. in Hydrogen bonding and transfer in the
excited state. (Han, K.-L. & Zhao, G.-J. eds.) pp. 377–391
(John-Wiley & Sons Ltd., West Sussex, U.K.).
[18] Freier, E., Wolf, S. & Gerwert, K. Proton transfer via a tran-sient linear water-molecule chain in a membrane protein. Proc.
Natl. Acad. Sci. USA 108, 11435–11439 (2011).
[19] Kandori, H. & Maeda, A. FTIR spectroscopy reveals micro-scopic changes of the protein around the rhodopsin
![Figure 1 (a) X-ray crystal structure of the chromophore-binding site of bovine rhodopsin (1U19 [4])](https://thumb-ap.123doks.com/thumbv2/123deta/6761788.1161398/2.892.246.638.125.656/figure-crystal-structure-chromophore-binding-site-bovine-rhodopsin.webp)