Chemical Treatments and Doping for Improving
Thermoelectric Properties of Silver Antimonate
山梨大学大学院
医学工学総合教育部
博士課程学位論文
2017 年 3 月
小澤 健介
-3- Index 1. Background ・・・5 1.1. Thermoelectric effect 1.1.1. Seebeck effect 1.1.2. Peltier effect 1.1.3. Thomson effect 1.2. Thermoelectric generation 1.3. Thermoelectric material
1.3.1. Oxide thermoelectric material 1.3.2. AgSbO3
1.4. Thermoelectric generation module
2. Reduction and defect introduction in AgSbO3 by HNO3 treatment・・・18
2.1. Objectives
2.2. Experimental procedure 2.3. Results of characterization 2.3.1. Relative density
2.3.2. Synchrotron powder diffraction analysis at SPring-8 2.3.3. Inductively coupled plasma mass spectroscopy 2.3.4. Observation by scanning electron microscope 2.3.5. X-ray photoelectron spectroscopy
2.4. Results of measurement of thermoelectric conversion efficiency 2.4.1. Measurement of electric conductivity
2.4.2. Measurement of Seebeck coefficient
2.4.3. Measurement of thermal conductivity by Harman method 2.5. Chapter conclusion
-4-
3. Improvement of density by using Spark plasma sintering・・・33
3.1. Objectives
3.2. Spark plasma sintering 3.3. Experimental procedure 3.4. Results of characterization 3.4.1. Relative density
3.4.2. Synchrotron powder diffraction analysis at SPring-8 3.4.3. Observation by scanning electron microscope
3.4.4. X-ray photoelectron spectroscopy
3.5. Results of measurement of thermoelectric conversion efficiency 3.5.1. Measurement of electric conductivity
3.5.2. Measurement of Seebeck coefficient
3.5.3. Measurement of thermal conductivity by Harman method 3.6. Chapter conclusion
4. Doping of Cu and improvement density by SPS・・・45
4.1. Objectives
4.2. Experimental procedure 4.3. Results of characterization 4.3.1. Relative density
4.3.2. X-ray powder diffraction spectroscopy
4.4. Results of measurement of thermoelectric conversion efficiency 4.4.1. Measurement of electric conductivity
4.4.2. Measurement of Seebeck coefficient 4.5. Chapter conclusion
-5- 5. Bi substitution of Ag site of AgSbO3・・・52
5.1. Objectives
5.2. Experimental procedure 5.3. Results of characterization 5.3.1. Relative density
5.3.2. X-ray powder diffraction spectroscopy 5.3.3. X-ray photoelectron spectroscopy
5.4. Results of measurement of thermoelectric conversion efficiency 5.4.1. Measurement of electric conductivity
5.4.2. Measurement of Seebeck coefficient 5.5. Chapter conclusion
6. Fabrication of thermoelectric generation module from commercial Peltier device and field test at a factory・・・66
6.1. Fabrication of thermoelectric modules 6.2. Field test at the factory
6.3. Influence of heat absorber
6.4. Temperature irregularity at the surface of module 6.5. Results of field test
6.6. Chapter conclusion
7. General conclusion and future prospect・・・75
Acknowledgement Publication list
-6- 1. Background
Nowadays in Japan, most of electricity is generated by thermal power. However, thermal power generation has several issues such as depletion of fossil fuels, emission of waste gas, and discharge of waste heat. For the sustainable society, the research on thermoelectric generation which can convert from heat energy to electricity directly is very important and worthwhile [1].
1.1. Thermoelectric effect
Thermoelectric effect can be divided to thermoelectric generation by Seebeck effect and thermoelectric cooling and heating by Peltier effect.
1.1.1. Seebeck effect
When making the circuit with two joints by using different kind of conductor, X and Y, then one of the joint keeps high temperature (Th), and another joint keeps low
temperature (Tl), the carriers (n-type ; electron, p-type ; hole) moves to low
temperature joint from high temperature joint, and the voltage(Vxy) proportional to the
temperature difference(ΔT=Th-Tl) is occurred in the circuit. This phenomenon is called
as Seebeck effect. Vxy is called thermal electromotive force. The value of Vxy depends on
the kind of material and temperature of the joint, and does not depend on the length and thickness of conductor and temperature expect for the joint.
Thermal electromotive force Vxy is changed by absolute temperature of measurement
atmosphere if the temperature difference ΔT is stable. Therefore, when the temperature of a joint is stable, the change of thermal electromotive force against 1K change of temperature of another joint is defined as relative Seebeck coefficient of X to
-7-
Y, Sxy. When Sx and Sy are defined as relative Seebeck coefficient of material X and Y,
Sxy can be written as
Sxy = Sx - Sy (1.1)
By using equation (1.1), standard material whose absolute Seebeck coefficient is already known joints with target material which is wanted to measure S, then we can measure relative Seebeck coefficient and calculate absolute Seebeck coefficient of each materials.
At Th of the circuit, when electric current flows from Y to X (electron moves from X to
Y), Sxy defined as plus values. If electron current flows reverse direction, Sxy defined as
minus values.
1.1.2. Peltier effect
When the circuit made by different kinds of conductor Z and W such as Fig.1.2 was flowed direct current, one of the joint was heated and other joint was cooled. This phenomenon is called as Peltier effect, or thermoelectric cooling (heating). When target material is cooled by Peltier effect, joule heating and thermal conduction will be prevented the thermoelectric cooling. It is need to have high Seebeck coefficient for effective thermoelectric cooling.
When the relative Seebeck coefficient, temperature of both joints, and electrical current defined as Szw, T, and I, change values of heat quantity is written as
|qp| = SzwTI =πI (1.2)
π is called as Peltier coefficient. When Szw is plus, the joint which the current flows
to W from Z gains heat, and the joint which the current flows to Z from W is cooled. When the Szw is minus or current flow is reverse, heat and cooling relation is reverse at
-8- 1.1.3. Thomson effect
When an edge of material with uniform composition keep at high temperature (Th),
and another edge keep at low temperature (Tl), then direct current flows along to the
direction L with temperature gradient, heat production or heat absorption is occurred because of the difference of absolute Seebeck coefficient between the edges. This phenomenon is called as Thomson effect.
When the temperature gradation and current concentration is defined as dT/dL and J, change of heat quantity per unit volume by Thomson effect, qt is written as
qt = θJ・dT/dL (1.3)
θ is called as Thomson coefficient. θ can be calculated by θ = T・dS/dT (1.4)
The materials which S increases according to the temperature increased have plus value of θ, and then current flows to Th from Tl, heat absorption caused inside of the
materials. When θ is minus or current flow is reversed, heat generation is occurred inside the materials.
1.2. Thermoelectric generation
In thermoelectric generation by using Seebeck effect, two kinds of semiconductors (p-type and n-type) are connected thermal parallelly and electrical directly [2]. In this
case, p-type semiconductor has plus absolute Seebeck coefficient Sp, n-type
semiconductor has minus absolute Seebeck coefficient Sn. When these are coupled,
relative Seebeck coefficient Spn will be bigger.
Spn = Sp+Sn = Sp+|Sn| (1.5)
When temperature gradient occurred between the joints, heat flow and carriers move to low temperature side from high temperature side, and the electromotive force generate. Making circuit with outside load, we can get the current and electricity.
-9-
Thermoelectric generation has several merits [3]. First, thermoelectric generation can
be corresponding wide temperature field such as 200~2000 K by the choice of thermoelectric materials. Second, thermoelectric generation has no drive division, and then thermoelectric generation can run silently and without vibration. Third, its system is simple and easy. We can make thermoelectric generation module easily. It has high reliability and does not need to maintain. Fourth, generating efficiency does not depend on the scale of generating institution. At last, thermoelectric generation does not exhaust gases, so environmental burden during generation is very low.
However, thermoelectric generation has few problems. First, thermoelectric materials which used in the application nowadays contained heavy metals such as Pb, Bi, and Te. Environmental burden during the making modules is not small. Second, conversion efficiency is not good (<10%) compared with steam turbine generation (about 40%) and solar cell (about 10%). At last, it is not cheap because its coverage ratio is still low.
Because of these characteristics, thermoelectric generations applied space engineering or individual battery in isolated district or deep sea, which need long durability and stability in preference to total amount of electricity and costs. Nowadays, research of new systems which can generate from waste heat of automobile or incinerator is ongoing.
-10- Fig.1.1 Model of thermoelectric generation module
1.3. Thermoelectric materials
Parameters of the conversion efficiency of thermoelectric generation are figure of merit ZT and power factor PF. These are calculated by electrical conductivity, Seebeck coefficient, thermal conductivity and absolute temperature with below equations. ZT = σS2κ-1T-1 (1.6)
PF = σS2 (1.7)
From these equations, to obtain high conversion efficiency of thermoelectric generation, it is necessary to obtain high electrical conductivity, high Seebeck coefficient, and low thermal conductivity. The materials which meet these
ΔT n-type Current Th Tl Current e p-type h+
-11-
requirements called as thermoelectric materials. For introducing practical application, ZT exceeds 1.
However, electrical conductivity σ and Seebeck coefficient S are function of carrier concentration. σ can be written by carrier concentration n, electric charge e, and electric mobility μ as
σ = neμ (1.8)
so σ increases proportional to n. In contrast, S can be written as S = (k/e){ln(Nc/n)+C} (1.9)
so S decreases when n increases. These relation called as Ioffe`s theory.
Wiedemann-Frantz law, the ratio of σ and κ is proportional to the temperature, is written by Lorentz number L as
κ/σ = LT (1.10)
κ is the sum of electrical thermal conductivity κel and lattice thermal conductivity κlat.
In these kinds of κ, κel is affected by carrier concentration strongly.
Because of Ioffe`s theory and Wiedemann-Frantz law, it is difficult to be compatible with high σ, high S, and low κ. It is important to improve these parameters in new approaches.
-12- Fig.1.2 Ioffe`s theory and Wiedemann-Frantz law
1.3.1. Oxide thermoelectric material
Thermoelectric material can be mainly divided to two categories, alloys and oxides. Alloy thermoelectric material has been already applied to practical application such as Bi-Te system [3], Pb-Te system [4],and skutterudite compounds [5]. They have high
conversion efficiency. However, alloy thermoelectric material has several issues, e.g. low durability for oxidation and vaporization at high temperature, and environmental burden and shortage of reserve of raw materials.
In contrast, thermoelectric oxides have abundant raw materials and high durability for oxidation and heat. However, carrier mobility of oxides is not high, so the
-13-
conversion efficiency is lower than that of alloys. Recently, p-type oxides with high conversion efficiency are reported such as Na-Co composite oxide[6] or Ca-Co composite
oxide[7], however, the research of n-type oxide is not enough.
1.3.2. AgSbO3
It is known that typical oxides have a low mobility (μ) and high κ (particularly, κph,
which is the thermal conductivity mediated by phonons), originating from their ionic bonding between light atoms and high electronegativity of oxygen. Different from these oxides, silver antimonite (AgSbO3), which has a defect pyrochlore structure
composed of linear chains of AgO6 and SbO6, possesses rather high μ originating from
its highly-dispersed valence band and conduction band composed of Ag 5s and Sb 5s orbitals, respectively [8] [9]. In addition, AgSbO3 has low stacking density and thus its
κph is significantly lower than those of other oxides [10] [11]. So, AgSbO3 has been
investigated as a candidate n-type TE material, e.g., by addition of CuO [8] and by
using a spark plasma sintering (SPS) method to prepare dense AgSbO3[10]. According
to Wiggers et al. , aggregated Ag islands are formed in the thermally treated AgSbO3,
causing the increase in σ by the electron hopping between such metallic islands [12].
However, the previous studies, regarding TE properties of AgSbO3, did not mention the
existence of metallic Ag. Moreover, the valency of Sb (Sb3+ (4d10), Sb5+ (4d105s2)) should
affect σ due to generation of oxygen vacancy in the presence of Sb3+; however such
discussion has not been performed. Thus, in the previous paper of our group, we characterized the AgSbO3 in details, prepared by the combination of a solid state
reaction (SSR) method and a nitric acid (HNO3) treatment [13]. In addition, the
existence of metallic silver and the ratio of Sb3+/Sb5+ in AgSbO3 are discussed in
connection with σ, S, and κ.
By the doping of CuO for AgSbO3, it was reported that CuO acted on the sintering
additive, and AgSbO3 and CuO caused chemical reaction resulting in the formation of
-14- conductivity and power factor of AgSbO3 [12].
2AgSbO3 + CuO → CuSb2O6 + Ag+1/2O2 (1.11)
Mainly, application temperature of AgSbO3 as a thermoelectric material is assumed to
be 700~1000 K.
Fig.1.3 Crystal structure of AgSbO3
Fig.1.4 Metallic island of Ag occurred by heat treatment [12]
-15- 1.4. Thermoelectric generation module
If we obtain the electricity by using Seebeck effect, we have to manufacture thermoelectric generation modules. The pair of thermoelectric materials contained p-type and n-type can generate electricity. Commercial thermoelectric module has many pairs of thermoelectric materials. Nowadays, almost commercial thermoelectric modules consist to alloy thermoelectric materials because of their high conversion efficiency and assumed condition without taking care of oxidation. In contrast, in terms of the module using oxide thermoelectric materials, several reports [14] [15] using
-16- Reference
[1] Uemura K, Nishida I, Thermoelectric semiconductor and its application, The Nikkan Kogyo Shinbun, 1998 ; 171-174
[2] Kajikawa T, Progress of thermoelectric conversion material, Written report of Shonan institute of technology, 1993 ; 27 : 26
[3] Kajikawa T, Feature Article SAWS 2002 Autumn
[4] CRC Handbook of Thermoelectrics, edited by D.M. Rowe, CRC Press, Inc. 1995 ; Ch.21, pp.257
[5] CRC Handbook of Thermoelectrics, edited by D.M. Rowe, CRC Press, Inc. 1995 ; Ch.22, pp.267
[6] Terasaki I, Sasago Y, Uchinokura K, Large thermoelectric power in NaCo2O4 single
crystals, Phys. Rev. B 1997 ; 56 : R12685(R)
[7] Takeuchi T, Kondo T, Soda K, Mizutani U, Funahashi R, Shikano M, Tsuda S, Yokoya T, Shin S, Muro T, Electronic structure and large thermoelectric power in Ca3Co4O9, J Electron Spectrosc., 2004 ; 137-140 : 595-599.
[8] Nishiyama S, Ichikawa A, Hattori T. Theromoelectric properties of CuO-added AgSbO3 ceramics. J Ceram Soc Jpn, 2004 ; 112 : 298–300.
[9] Allen, J.P., Nilsson, M.K., Scanlon, D. O., Watson, G. W. Comparison of the defective pyrochlore and ilmenite polymorphs of AgSbO3 using GGA and hybrid DFT, Phys. Rev.
B, 2011 ; 83 : 035207
[10] Sang,H.-Y. and Li, J.-F., Thermoelectric Properties of AgSbO3 with Defect
Pyrochlore Structure. Journal of Alloys and Compounds, 2010 ; 493 : 678-682.
[11] Li, F., Li, J.-F., Microstructure and Thermoelectric Properties of AgSbO3 Ceramics
Prepared by Ion-Exchange Powder Synthesis and Normal Sintering, J. Electro. Mater., 2011 ; 40 : 1035.
[12] Wiggers, H., Simon, U., Schon, G., Conductivity studies on AgSbO3 channel
structure by impedance spectroscopy, Solid State Ionics, 1998 ; 107 : 111
[13] Kobayashi R, Tanigawa S, Takashima T, Ohtani B, Irie H. Silver-inserted heterojunction photocatalysts for Z-scheme overall pure-water splitting under
-17-
visible-light irradiation. J Phys Chem C, 2014 ; 118 : 22450−22456.
[14] E Sudhakar Reddy, J G Noudem, S Hebert and C Goupil, Fabrication and properties of four-leg oxide thermoelectric modules, Journal of Physics D : Applied Physics, 2005 ; Volume 38, Number 19 : 3751
[15] Funahashi R, Mikami M, A portable thermoelectric-power-generating module composed of oxide devices, Journal of Applied Physics, 2006 ; 99 : 066117
-18-
2. Reduction and defect introduction for AgSbO3 by HNO3 treatment
2.1. Objectives
It is reported that the treatment of AgSbO3 by HNO3 caused removal of metallic Ag
from the bulk and introduction Ag defect for the crystal structure [1]. These phenomena
will be effective to improvement S. Therefore, measurements of thermoelectric properties carried out about HNO3 treated AgSbO3.
2.2. Experimental procedure
AgSbO3 was synthesized by solid state reaction using Ag2O (>99.0%, Kanto Kagaku)
and Sb2O3 (>98.0%, Kanto Kagaku) as raw materials. The raw materials were weighed
to the stoichiometric molar ratio, and were mixed by ball milling for 20 h, and then the mixed powder was calcined at 900 oC for 2 h. The calcined powder was washed by 5.0
mol/l HNO3 (preparation from nitric acid 1.42, Kanto Kagaku) to remove metallic Ag
and to generate Ag defects, then dried at 90 oC for 20 h. The obtained powder was
uniaxially pressed into a rectangular pellet with the dimensions ~ 4 5 20 mm, followed by calcination in an electric furnace (HPM-1N, AS-ONE) in air at 900 oC for 2
h (denoted by NAT-NS. The sample without HNO3 treatment denoted NS).
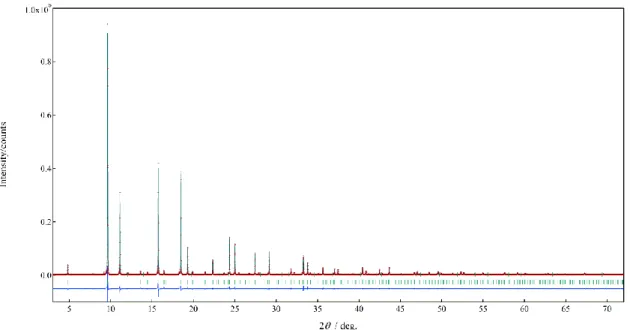
In this study, synchrotron radiation powder diffraction analysis was carried out for identification of sintering bodies by supported SPring-8. Synchrotron radiation powder diffraction patterns were obtained at BL02B2 in SPring-8 (wavelength, 0.0496 nm) after pulverizing bodies into fine powders. The patterns were collected in the 2 range of 3°–73° in a step scanning mode, with a step length of 0.01°. The Rietveld analyses using a RIETAN-FP software (a multipurpose pattern-fitting system) were performed on the synchrotron radiation diffraction patterns. For the analysis, the space groups Fd-3m (cubic, No. A-227) and Fm-3m (cubic, No. A-225) were used as the starting structural model of AgSbO3 (a = 10.23 nm) and Ag (a = 4.0857 nm).
-19-
For the purpose of investigate affection of HNO3 treatment for AgSbO3, inductively
coupled plasma (ICP) mass spectroscopy was carried out. Measurement of AgSbO3
bulk was impossible because AgSbO3 was insoluble in water, HCl, HNO3, and aqua
regia. Then, HNO3 after introduction of defect to AgSbO3 was measured by ICP mass.
A scanning electron microscope (SEM; JSM-6500F, JEOL) was used to observe the morphology of cross-sectional surfaces of the samples.
To measure σ, four Pt wires were attached by an Ag-conductive region to the prepared rectangular pellet samples. The temperature dependence of σ (Agilent Technologies, E5273A) was measured from 473 K to 873 K by pseudo four-probe methods.
To measure S, either two Pt wires were attached by an Ag-conductive region to the prepared rectangular pellet samples. The temperature dependence of S (Yokogawa, Model 7563) with a temperature gradient of 5-20 K was measured from 473 K to 873 K by conventional two-probe steady-state methods.
Harman method was introduced for the measurement of thermal conductivity. Figure of merit ZT can be obtained by measuring DC and AC resistance. ZT can be written by Rdc and Rac from equation (2.1) as
ZT = σS2κ-1T-1 (2.1)
ZT = {Rac(a/L)}-1S2T{aΔT /(STIL)}
ZT = SΔT/RacI = (Vdc-Vac) / RacI
ZT = (Rdc-Rac) / Rac (2.2)
In these equations, I, a, and L mean current, cross-sectional area of the bulk, and distance between electrodes, respectively. We have already measured power factor of the sample, so we can calculate thermal conductivity from figure of merit and power factor. From equation (2.1) and (2.2), κ can be written as
κ= (PF×T) / ZT (2.3)
-20- Fig.2.1 Model of pseudo four-probe method
2.3. Results of characterization
2.3.1. Relative density
Relative density of NS sample showed 58.9%, and that of NAT-NS sample showed 56.6% calculated from ideal AgSbO3.
2.3.2. Synchrotron radiation powder diffraction analysis at SPring-8
Obtained peaks by synchrotron radiation powder diffraction analysis from NS and NAT-NS are shown in Fig.2.2 and Fig.2.3, respectively. Results of Rietveld analysis are summarized in Table 2.1.
Both of NS and NAT-NS showed defect pyrochlore structure of AgSbO3 as main
component. Not shown here, calcined AgSbO3 indicated the homogeneous defect
pyrochlore structure by the conventional XRD. In the NS sample, the Ag/Sb ratio estimated from Rietveld analysis is unity, and good agreement with the stoichiometric ratio, although Ag exists separately in spite of the stoichiometric ratio of starting materials, Ag2O and Sb2O3. This is reasonable because Sb element volatilized during
sintering. As a result of HNO3 treatment, peak shift to lower angle, increase of lattice
constant, and decrease of metallic Ag were observed. Defected silver antimonate, Ag1-xSbO3-y was obtained by HNO3 treatment.
-21-
Fig.2.2 Peak pattern of synchrotron radiation powder diffraction analysis of NS
Fig.2.3 Peak pattern of synchrotron radiation powder diffraction analysis of NAT-NS
Table 2.1 Result of Rietveld analysis of NS and NAT-NS
Sample NS NAT-NS
Ag content / mol% 1.12 0.83
Composition of AgSbO3*) Ag1.00Sb1.00Oy Ag0.98Sb1.00Oy
-22- 2.3.3. Inductively coupled plasma mass spectroscopy
Table 2.2 shows the amounts of silver and antimony solved in nitric acid used in experiment. Silver and antimony ratio was approximately three hundred forty to one. Antimony has less solved to HNO3. Amounts of solved Ag was 5 mol% of whole AgSbO3
treated in HNO3. Shown in chapter 2.3.2., Ag defects in calculated composition by
Rietveld analysis was two to three mol%. Hence metallic Ag in calcined powder was solved into HNO3.
Table 2.2 Result of ICP of HNO3 used in the treatment
HNO3 Treatment Ag(ppm) Sb(ppm) Ag/Sb
5.0 mol/l 5min 490595 1450 338.34
2.3.4. Observation by scanning electron microscope
SEM images of the cross-sectional surfaces of NS and NAT-NS are shown in Fig.2.4 and Fig.2.5, respectively. These particle sizes were estimated to 100~200 nm in diameter. The particles appeared aggregated, indicating both of them were porous.
-23-
Fig.2.5 SEM image of cross-sectional surface of NAT-NS sintered body
2.3.5. X-ray photoelectron spectroscopy
For investigate affection of the valence of Ag and Sb, X-ray photoelectron spectroscopy (XPS; Axis-Ultra, Shimadzu) was carried out about the pulverized powders of NS and NAT-NS.
The binding energies corresponding to Ag 3d5/2 of Ag0 (Ag), Ag+ (Ag2O), and Ag2+ (AgO)
are quite similar, and are 368.0–368.3, 367.6–367.8, and 367.3–367.4 eV, respectively
[2]. Since all the energies are in such a narrow range, it is quite difficult to perform a
quantitative analysis of the Ag oxidation states from a deconvolution analysis of XPS spectra with high certainty. However, qualitatively, as shown in Fig.2.6, the spectrum peaks of NAT-NS shifted to the higher binding energy side (inset in Fig.2.6), and had tailing in the lower binding energy region.
The Sb 3d3/2 XPS spectra of NS and NAT-NS are shown in Fig.2.7 and Fig.2.8,
respectively. As for the oxidation states of Sb, the peaks at 540.7 and 539.7 eV are assigned to the 3d3/2 orbital of Sb5+ and Sb3+, respectively [3]. To quantitatively evaluate
the Sb3+/Sb5+ atomic ratios, peak deconvolution was performed using a Gaussian
lineshape. The component Sb3+ and Sb5+ spectra determined by deconvolution and
fitted peaks are also shown in Fig.2.7 and Fig.2.8. The atomic ratios of Sb3+ /Sb5+,
-24-
we compare the Sb3+/Sb5+ ratio between NS and NAT-NS, the amount of Sb5+ increased
after HNO3 treatment. This is reasonable because HNO3 acts as an oxidant. So, it
could be considered that Ag2+ also increased, and then Ag0 might increase to maintain
charge neutrality.
Fig.2.6 XPS spectra about Ag 3d orbital of NS and NAT-NS
365
366
367
368
369
370
Binding energy/eV
N
orm
al
iz
ed i
nt
ens
it
y/
A
.U
.
Ag Ag + Ag2+ NS NAT-NS-25- Fig.2.7 XPS spectrum about Sb 3d3/2 orbital of NS
Fig.2.8 XPS spectrum about Sb 3d3/2 orbital of NAT-NS
537
538
539
540
541
542
0
10000
20000
30000
40000
50000
60000
Int
ens
it
y/
cps
Binding Energy/eV
Sb
5+Sb
3+NS
537
538
539
540
541
542
0
20000
40000
60000
Int
ens
it
y/
cps
Binding Energy/eV
NAT-NS
Sb
3+Sb
5+-26-
2.4. Measurement of thermoelectric conversion efficiency
2.4.1. Measurement of electrical conductivity
Figure 2.9 shows the temperature dependence of σfor NS and NAT-NS. All the values of σ increased with increasing temperature, which is typical semiconductor behavior. When NS and NAT-NS were compared in which the amount of metallic Ag and the relative density were quite similar, the AgSbO3 with the larger amount of Sb3+ showed
higher σ than that with the larger amount of Sb5+. So, producing Sb3+ is the key to
increase σ. This could be plausible because generating Sb3+ causes the generation of
more oxygen vacancies in the material, and thus the corresponding donor levels are created in the bandgap.
-27- Fig.2.9 Electrical conductivities of NS and NAT-NS
2.4.2. Measurement of Seebeck coefficient
Temperature dependence of Sfor NS and NAT-NS is shown in Fig.2.10. S values of all the samples were negative, indicating the occurrence of n-type conduction. The trend of the absolute values of S almost covers the Ioffe’s theory, that is, the absolute value of S decreases when σ increases. Absolute value of S of NAT-NS is higher than that of NS. The existence of Ag decreases S as the carriers tends to be transported through Ag particles acting as bypasses. Also, it could be considered that the increase in the amount of Sb3+ causes the decrease in the absolute value of S because σ increases as
mentioned above.
0
200
400
600
800
-4
-3
-2
-1
0
log
/
S
・cm
-1
Temperature / °C
NS
NAT-NS
-28-
Figure 2.11 shows the temperature dependence of power factor (PF), which was calculated from the equation (1.7). The highest PF observed in this chapter (~110-6 W
m-1 K-2) was obtained for NS at 600 °C.
Fig.2.10 Seebeck coefficients of NS and NAT-NS
0
200
400
600
800
-1000
-800
-600
-400
-200
0
S
/
VK
-1
Temperature / °C
NS
NAT-NS
-29- Fig.2.11 Power factor of NS and NAT-NS
2.4.3. Measurement of thermal conductivity by Harman method
Result of the measurements of DC and AC resistance are described in fig.2.12 to fig.2.15, respectively. ZT of NS and NAT-NS at 600℃ was calculated 0.009 and 0.007, respectively.
Thermal conductivities of NS and NAT-NS were estimated 0.42 and 0.38, respectively. That is mentioned κel is decreased by HNO3 treatment.
0
200
400
600
800
-9
-8
-7
-6
-5
-4
logP
F/
W
m
-1K
-2Temperature / °C
NS
NAT-NS
-30- Fig.2.12 DC resistance of NS sample at 600℃
Fig.2.13 AC resistance of NS sample at 600℃
0
20
40
60
80
-0.39
-0.38
-0.37
|V|dc=0.372V
Idc=11.62±0.2mA
Time/min
V
ol
ta
ge
/V
0
10
20
-1
0
1
Time/min
V
ol
ta
ge
/V
|Vac|=0.365V Iac=11.47±0.05mA
-31-
Fig.2.14 DC resistance of NAT-NS sample at 600℃
Fig.2.15 AC resistance of NAT-NS sample at 600℃
0
10
20
-1
0
1
Time/min
V
ol
ta
ge
/V
|Vac|=0.833V Iac=2.95±0.05mA
0
10
20
30
0.85
0.851
0.852
0.853
0.854
0.855
Vdc=0.853V
Idc=3.0±0.1mA
Time/min
V
ol
ta
ge
/V
-32- 2.5. Chapter conclusion
HNO3 treatment for calcined powder of AgSbO3 caused introduction structural defect
for AgSbO3, increase of the valence of antimony. Sb3+ in AgSbO3 has important role to
obtain high electrical conductivity and power factor, however, HNO3 treatment
oxidized antimony from Sb3+ to Sb5+, and decrease of electrical conductivity was
occurred. In contrast, Seebeck coefficient was improved by HNO3 treatment. It was
ruled by Ioffe`s theory. Thermal conductivity was decreased by HNO3 treatment. These
results mentioned that carrier density of AgSbO3 was decreased, and electron thermal
conductivity was decreased.
Reference
[1] Kobayashi R, Tanigawa S, Takashima T, Ohtani B, Irie H. Silver-inserted heterojunction photocatalysts for Z-scheme overall pure-water splitting under visible-light irradiation. J Phys Chem C, 2014 ; 118 : 22450−22456.
[2] Melin EP, Diaz OG, Rodrigues JMD, Colon G, Navio GC. Effect of deposition of silver on structural characteristics and photoactivity of TiO2-based photocatalysts.
Appl Catal B: Environ., 2012 ; 127 : 112–120.
[3] Zhang H, Sun K, Feng Z, Ying P, Li C. Studies on the SbOx species of SbOx/SiO2
catalysts for methane-selective oxidation to formaldehyde. Appl Catal A: General 2006 ; 305 : 110–119.
-33-
3. Improvement of density by using Spark plasma sintering
3.1. Objectives
Low relative density is one of the issues of AgSbO3. Low relative density prevents to
obtain expected thermoelectric parameter such as electric conductivity, and to fabricate modules or devices. Objective of this chapter is improvement of density and electrical conductivity by introduction of Spark plasma sintering.
3.2. Spark plasma sintering (SPS)
Spark plasma sintering (SPS) is a method using pulse current for pressing. Merit of SPS is to prepare dense bulk with short time. Sintering forces of SPS are electromagnetic energy by pulse current, self-heating of target sample, and spark plasma energy between the particles in addition to thermal and mechanical energy used in normal sintering method. In contrast, grain growth is difficult to occur because sintering time is very short.
3.3. Experimental procedure
Reagents and synthesized procedure until the calcination is the same as those in chapter 2.2.. Some portions of calcined powder were treated by HNO3 to introduce the
defects. Calcined powder was also pressed uniaxially into a disc pellet with the dimensions ~ 15 mm diameter 20 mm thickness, followed by calcination in a SPS apparatus (SPS-515, Fuji Denpa Kouki) under pressure of 40 MPa at three-step temperatures, 700, 750, and finally 800 oC. Each step of the temperature was
maintained for 5 minutes. Disk pellets after the SPS were cut into rectangular pellets with the dimensions ~ 5 12 12 mm for measurements of thermoelectric properties.
-34-
Obtained samples denoted by SPS and NAT-SPS (HNO3 treated SPS sample).
Procedures of characterization and thermoelectric measurement are same as those in chapter 2.2..
3.4. Results of characterization
3.4.1. Relative density
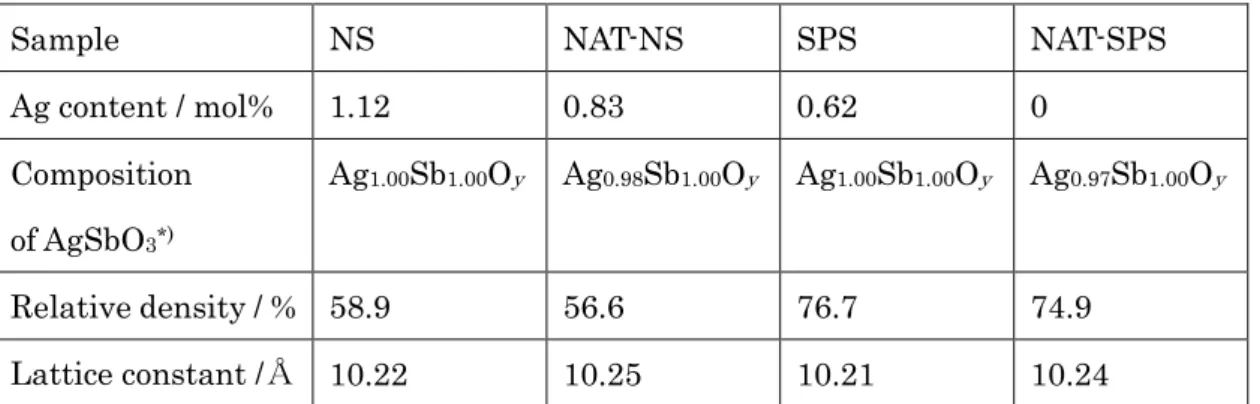
The relative densities of SPS and NAT-SPS pellets were 76.7 and 74.9%, respectively. Those of NS and NAT-NS indicated small, only ~60 % of the theoretical ones, which is considered to be attributable to the evaporation of Sb[1]. Improvement of densities of
the AgSbO3 bulks was successful by SPS method.
3.4.2. Synchrotron radiation powder diffraction analysis at SPring-8
The observed diffraction patterns by the synchrotron radiation are shown in Fig.3.1 and Fig.3.2, respectively. The molar percentages of AgSbO3 and Ag in all samples, their
lattice parameters, and their compositions were determined by Rietveld refinement and are summarized in Table 3.1.Both of SPS and NAT-SPS showed defect pyrochlore structure of AgSbO3 as main component. In the SPS samples, the Ag/Sb ratio is unity,
in good agreement with the stoichiometric ratio same as NS sample. About NAT-SPS, defected silver antimonate, Ag1-xSbO3-δ was obtained by HNO3 treatment same as
NAT-NS.
SPS method caused decrease of lattice constant. SPS or NAT-SPS samples have smaller lattice constant compared with NS or NAT-NS. And metallic Ag was decreased during the SPS method. Interestingly, the separated Ag was not detected in NAT-SPS, owing to the evaporation of Ag during SPS[2].
-35-
Fig.3.1 Peak pattern of synchrotron radiation powder diffraction analysis of SPS sample
Fig.3.2 Peak pattern of synchrotron radiation powder diffraction analysis of NAT-SPS sample
-36-
Table 3.1 Summary of the result of Rietveld analysis
Sample NS NAT-NS SPS NAT-SPS
Ag content / mol% 1.12 0.83 0.62 0 Composition of AgSbO3*) Ag1.00Sb1.00Oy Ag0.98Sb1.00Oy Ag1.00Sb1.00Oy Ag0.97Sb1.00Oy Relative density / % 58.9 56.6 76.7 74.9 Lattice constant /Å 10.22 10.25 10.21 10.24
*) Estimated from the occupancies of Ag and Sb in AgSbO3
3.4.3. Observation by scanning electron microscope
SEM images of the cross-sectional surfaces of SPS and NAT-SPS are shown in Fig.3.4 and Fig.3.5, respectively. As for the SPS-treated samples, although SPS and NAT-SPS became denser than NS (shown in Fig.2.3) and NAT-NS (shown in Fig.2.4), reflecting the relative density of the samples. Necking growth was observed from the samples sintered by SPS process.
-37-
Fig.3.5 SEM image of cross-sectional surface of NAT-SPS sintered body
3.4.4. X-ray photoelectron spectroscopy
Peak regions using to deconvolution are same to those described in chapter 2.3.4.. The Ag 3d XPS spectra of four samples are shown in Fig.3.6. Spectrum of SPS was quite similar to NS. The same trend was observed between NAT-NS and NAT-SPS. In the case of the samples sintered by SPS method, HNO3 treatment had same effect to
AgSbO3 systems sintered by SPS process.
The Sb 3d3/2 XPS spectra of SPS and NAT-SPS are shown in Fig.3.7 and Fig.3.8,
respectively. SPS process reduced Sb. In comparing the Sb3+/Sb5+ ratio between NS and
SPS, and between NAT-NS and NAT-SPS, the samples sintered by SPS method indicate more amounts of Sb3+ than the samples sintered by normal sintering, because
-38- Fig.3.6 XPS spectra of Ag 3d orbital
Fig.3.7 XPS spectrum about Sb 3d3/2 orbital of SPS
537
538
539
540
541
542
0
20000
40000
60000
80000
Int
ens
it
y/
cps
Binding Energy/eV
SPS
Sb
3+Sb
5+ Ag Ag+ Ag2+ NS NAT-NS SPS NAT-SPS365
366
367
368
369
370
Binding energy/eV
N
orm
al
iz
ed i
nt
ens
it
y/
A
.U
.
-39-
Fig.3.8 XPS spectrum about Sb 3d3/2 orbital of NAT-SPS
Fig.3.9 Ratio of Sb3+ and Sb5+
537
538
539
540
541
542
0
20000
40000
60000
80000
Int
ens
it
y/
cps
Binding Energy/eV
NAT-SPS
Sb
3+Sb
5+ 0% 10% 20% 30% 40% 50% 60% 70% 80% 90% 100% NS NAT_NS SPS NAT_SPS Sb5+ Sb5+ Sb5+ Sb5+ Sb3+ Sb3+ Sb3+ Sb3+-40-
3.5. Measurement of thermoelectric conversion efficiency
3.5.1. Measurement of electric conductivity
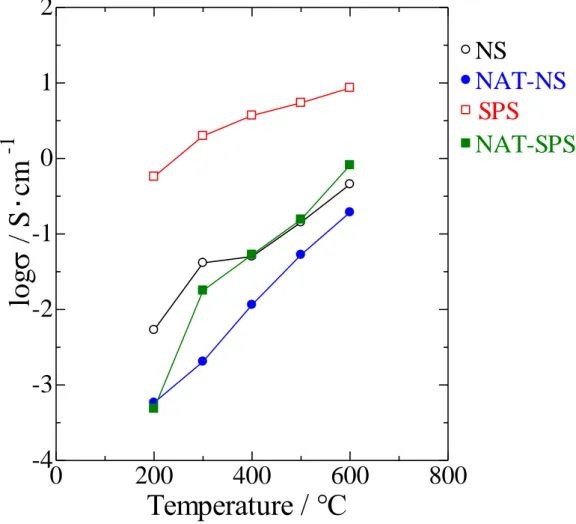
Figure 3.10 shows the temperature dependence of σ. All the values of σ increased with increasing temperature. SPS sample indicated higher σ than NS, and the same trend
was observed between NAT-NS and NAT-SPS. SPS containing larger amount of Sb3+
and metallic Ag, and with high relative density indicated higher σ. SPS sample indicated the highest electrical conductivity in four samples. Electrical conductivity of NAT-SPS was higher than NAT-NS, however, the trend of increase of σ was less than SPS from NS because the amount of Sb3+ of SPS was more than NAT-SPS.
Fig.3.10 Electrical conductivity
0
200
400
600
800
-4
-3
-2
-1
0
1
2
log
/
S
・cm
-1
Temperature / °C
NS
SPS
NAT-SPS
NAT-NS
-41- 3.5.2. Measurement of Seebeck coefficient
Temperature dependence of S is shown in Fig.3.11. The trend of the absolute values of S was almost covered the Ioffe’s theory, that is, the absolute value of S decreases when σ increases. SPS process caused improvement density and σ, however, |S| was decreased.
Figure 3.12 shows the temperature dependence of power factor. The highest PF
observed in this study (~110-5 W m-1 K-2) was obtained for SPS at 600 °C. Although
this value needs to be increased by more than one order of magnitude to be suitable for practical use, this study provides that the introduction of Sb3+ and conductive Ag in
AgSbO3 with high relative density enhanced the thermoelectric property.
Fig.3.11 Seebeck coefficients
0
200
400
600
800
-4
-3
-2
-1
0
1
2
log
/
S
・cm
-1
Temperature / °C
NS
SPS
NAT-SPS
NAT-NS
-42- Fig.3.12 Power factor
3.5.3. Measurement of thermal conductivity by Harman method
Figure of merits, ZT for NS, NAT-NS, SPS, and NAT-SPS sample at 600℃ are shown in Fig.3.13. SPS sample indicated the highest ZT in these four samples.
Thermal conductivities of these four samples are shown in Fig.3.14 In comparing the κ between NS and SPS, and between NAT-NS and NAT-SPS, it is mentioned that SPS process caused increase of κ by improvement of density. However, the trend of increase of κ about NAT-SPS from NAT-NS is less than about SPS from NS because NAT-SPS sample has no metallic Ag in the bulk.
0
200
400
600
800
-9
-8
-7
-6
-5
-4
log
PF
/W
m
-1K
-2Temperature / °C
NS
NAT-NS
SPS
NAT-SPS
-43- Fig.3.13 Figure of merits
Fig.3.14 Thermal conductivity 0.009 0.007 0.011 0.004 0 0.002 0.004 0.006 0.008 0.01 0.012 NS NAT_NS SPS NAT_SPS ZT 0.42 0.38 0.56 0.42 0 0.1 0.2 0.3 0.4 0.5 0.6 NS NAT_NS SPS NAT_SPS κ/ Wm -1K -1
-44- 3.6. Chapter Conclusion
SPS process caused necking of particles and improvement density of the bulk, decrease of and Seebeck coefficients, increase of thermal conductivity, and improvement of electrical conductivity. SPS process reduced Sb in the bulk, and samples sintered by SPS process have more Sb3+.
Following Ioffe`s theory, it is estimated that SPS process improved both of bulk density and carrier density. SPS sample showed the highest power factor and figure of merits in this chapter, however, it is necessary to enhance figure of merits about two orders of magnitude for practical use.
Reference
[1] Nishiyama S, Ichikawa A, Hattori T. Theromoelectric properties of CuO-added AgSbO3 ceramics. J Ceram Soc Jpn, 2004 ; 112 : 298–300.
[2] Kawano T, Kakemoto H, Irie H. Niobium (V) oxide with added silver as a thermoelectric material prepared by spark plasma sintering. Mater Lett, 2015 ; 156 : 94−97.
-45- 4. Doping of Cu and improvement density by SPS
4.1. Objectives
It has reported that doping of Cu for AgSbO3 caused improvement of σ and power
factor [1], however, its density is still low. SPS process is effective to improve density, so
we introduced SPS process to Cu doped AgSbO3. To recover S, same approach was
introduced HNO3 treated AgSbO3 (Ag1-xSbO3-y) which has higher S than non-treated
AgSbO3.
4.2. Experimental procedure
Reagents and synthesized procedure until the calcination of AgSbO3 is the same as
those described in chapter 2.2..
After calcination of AgSbO3, 5 mol% CuO (>99.9%, Kanto Kagaku) doped into AgSbO3,
and they were mixed by ball milling for 20 h. and mixed powder was sintered by SPS. SPS conditions and procedures are the same as those described in chapter 3.3.. Obtained sample denoted Cu5-SPS.
Some calcined powder was treated by HNO3 to introduce structural defect such as
chapter 2.2.. Then, treated powder mixed with 1 mol% CuO with above procedure, and mixed powder was sintered by SPS. Obtained sample denoted NAT-Cu1-SPS.
Conventional X-ray powder diffraction spectroscopy (XRD; PANalytical, PW-1700) was carried out for identification of sintering bodies. One part of sintered bodies of Cu5-NS and NAT-Cu1-SPS were pulverized for measurement.
Measuring procedures about electrical conductivity and Seebeck coefficient are same as those described in chapter 2.2..
-46- 4.3. Results of characterization
4.3.1. Relative density
Relative density of Cu5-SPS and NAT-Cu1-SPS is 82.8% and 86.2%, respectively. This result mentioned that Cu has performed as sintering additive.
4.3.2. X-ray powder diffraction spectroscopy
Figure 4.1 shows XRD pattern of Cu5-SPS. The peaks of trirutile CuSb2O6 and
metallic Ag were appeared other than defect pyrochlore AgSbO3.
Figure 4.2 shows XRD pattern of NAT-Cu1-SPS. In this pattern, CuSb2O6 and
metallic Ag peaks were disappeared. This result mentioned that chemical reaction of AgSbO3 and CuO (1.11) did not occur because of Ag defect of calcined powder
introduced by HNO3 treatment. In the process of synthesizing NAT-Cu1-SPS, CuO has
performed only sintering attitude. In comparison with Cu5-SPS, peak shift to lower angle was occurred by HNO3 treatment.
-47- Fig.4.1 XRD pattern of Cu5-SPS
Fig.4.2 XRD pattern of NAT-Cu1-SPS
10
20
30
40
50
60
70
0
1000
2000
3000
4000
5000
6000
Int
ens
it
y/
A
.U
.
2
/degree
Ag
CuSb
2
O
6
10
20
30
40
50
60
70
0
1000
2000
3000
4000
2
/degree
Int
ens
it
y
-48-
4.4. Measurement of thermoelectric conversion efficiency
4.4.1. Measurement of electrical conductivity
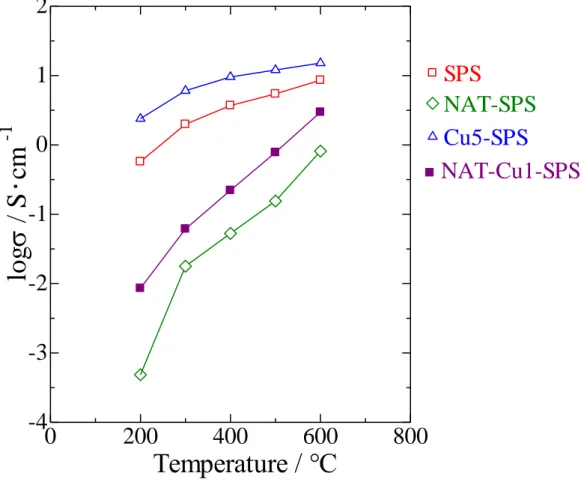
Figure 4.3 shows temperature dependence of σ of Cu5-SPS and NAT-Cu1-SPS. Cu doping caused improvement of σ by improvement relative density. Cu5-SPS shows highest σ in this study. Temperature dependence was kept regardless of the presence of Cu. The trend of rising σ about Cu5-SPS from SPS is similar to NAT-Cu1-SPS nevertheless doping amount of Cu is different. Improvement of σ is caused by Cu performance of sintering additive mainly.
Fig.4.3 Electrical conductivities of Cu-doped samples
0
200
400
600
800
-4
-3
-2
-1
0
1
2
log
/
S
・cm
-1
Temperature / °C
SPS
Cu5-SPS
NAT-SPS
NAT-Cu1-SPS
-49- 4.4.2. Measurement of Seebeck coefficient
Temperature dependence of S of Cu5-SPS and NAT-Cu1-SPS is shown in Fig.4.4. S was decreased by doping of Cu. In comparison with Cu5-SPS and NAT-Cu1-SPS, effect of HNO3 treatment was quite small. NAT-Cu1-SPS indicated higher density than
Cu5-SPS, it is estimated that density of the bulk has an important role on S.
Temperature dependence of PF is shown in Fig.4.5. Improvement of PF by Cu doping for the samples sintered by SPS process could not be achieved because of decrease of S.
Fig.4.4 Seebeck coefficients of Cu doped samples
0
200
400
600
800
-400
-300
-200
-100
0
S
/
VK
-1Temperature / °C
SPS
Cu5-SPS
NAT-Cu1-SPS
NAT-SPS
-50- Fig.4.5 Power factor of Cu doped samples
0
200
400
600
800
-9
-8
-7
-6
-5
-4
logP
F/
W
m
-1K
-2Temperature / °C
SPS
NAT-SPS
Cu5-SPS
NAT-Cu1-SPS
-51- 4.5. Chapter conclusion
Cu doping for AgSbO3 calcined powder was executed. CuSb2O6 and metallic Ag were
appeared in the case of 5 mol% doping. These byproducts were not detected from NAT-Cu1-SPS sample. SPS process is also effective to improve density in Cu doped samples.
Cu doping for AgSbO3 caused improvement of bulk density and electrical conductivity,
however, Seebeck coefficient decreased drastically; therefore power factor was not improved. The trend of rising of electrical conductivity about Cu5-SPS from SPS is similar to NAT-Cu1-SPS from NAT-SPS nevertheless doping amount of Cu and contained byproducts are different. Improvement of electrical conductivity is caused by Cu performance of sintering additive mainly.
Reference
[1] Nishiyama S, Ichikawa A, Hattori T. Theromoelectric properties of CuO-added AgSbO3 ceramics. J Ceram Soc Jpn, 2004 ; 112 : 298-300.
[2] G Laurita, K Page, A W Sleight, M A Subramanian. Structural Investigation of the Substituted Pyrochlore AgSbO3 through Total Scattering Techniques. Inorg Chem,
2013 ; 52 (19) : pp 11530-11537
[3] G Laurita, J Vielma, F Winter, R Berthelot, A Largeteau, R Pöttgen, G Schneider, M A Subramanian. From Ag2Sb2O6 to Cd2Sb2O7 : Investigations on an anion-deficient to
-52- 5. Bi substitution of Ag site of AgSbO3
5.1. Objectives
In this chapter, Ag site of AgSbO3 was substituted by Bi for the enhancement of
carrier density and improvement of σ. Kröger-Vink equation on this substitution is shown in (5.1). The substitution will cause appearance of Bi-Sb composite oxide and metallic Ag such as chemical formula (5.2).
AgAg. → BiAg… + VAg`` (5.1)
Ag2O + Sb2O3 + xBi2O3 → Ag1-xBixSbO3-δ + BiaSbbOc +Ag (5.2)
5.2. Experimental procedure
Ag2O, Sb2O3, and Bi2O3 (>99.9%, Kanto Kagaku) were weighed to the ratio of 1-x : 1 :
x (x=0.01, 0.05, 0.10, and 0.20), and were mixed by ball milling for 20 h. Procedures since calcination are same to those described in chapter 2.2..
In these samples, Ag0.9Bi0.1SbO3-δ was also sintered by SPS process described in
chapter 3.3.. This sample denoted Ag0.9Bi0.1SbO3-δ-SPS.
For the purpose of characterization of Ag1-xBixSbO3-δ, conventional XRD and XPS
analysis were introduced. The analysis procedure is the same to that described in before chapter. (XRD : chapter 4.2., XPS : chapter 2.2..)
-53- 5.3. Results of characterization
5.3.1. Relative density
Bi doping has not caused improvement density of the bulk. Relative density of Ag0.9Bi0.1SbO3-δ-SPS is 78.7%, higher than the samples without SPS process.
5.3.2. X-ray diffraction powder analysis
XRD patterns of calcined powder of Bi doped AgSbO3 are shown in Fig.5.1, and
relation between doping amount of Bi and intensity of the strongest peaks is shown in Fig.5.2.. This figure mentioned about crystallinity of the samples. Patterns of Bi doped AgSbO3 have small peak of Bi-Sb composite oxide, BiSbO4 or BiSb2O7. As more Bi
doped, crystallinity of the bulk was deteriorated. Ag1-xBixSbO3-δwith large doping rate
of Bi indicated lower intensity of XRD peak than that of low doping rate sample.
Fig.5.1 XRD patterns of Ag1-xBixSbO3-δ
10
20
30
40
50
60
70
Int
ens
it
y/
A
rbi
tra
ry U
ni
t
2
/degree
AgSbO
3(NS)
Ag
0.9Bi
0.1SbO
3-Ag
0.8Bi
0.2SbO
3-Ag
0.95Bi
0.05SbO
3-Ag
0.99Bi
0.01SbO
3--54-
Fig.5.2 Bi amount dependence of the strongest intensity of XRD peaks
5.3.3. X-ray photoelectron spectroscopy
The Ag 3d XPS spectra of Ag1-xBixSbO3-δare shown in Fig.5.3. Expected to
Ag0.95Bi0.05SbO3-δ, XPS spectra of Ag1-xBixSbO3-δis shifted to the high energy side, and
it is mentioned that Ag was reduced.
The Bi 4f XPS spectra of Ag1-xBixSbO3-δare shown in Fig.5.4. Bi doping was successful
because Ag1-xBixSbO3-δindicated Bi 4f peaks. Until 10 mol% Bi substitution, intensity
of Bi 4f peaks was increased and chemical state of Bi were assigned Bi3+ (159.1 eV).
Only Bi 20 mol% substitution sample indicated lower energy state estimated to Bi0.
Result of peak deconvolution [1] of Bi 4f orbital of Ag0.8Bi0.2SbO
3-δis shown in Fig.5.5.
The Sb 3d 3/2 XPS spectra of Ag1-xBixSbO3-δare shown in Figs.5.6-9, and ratio of Sb3+
to Sb5+ on Ag1-xBixSbO
3-δ is shown in Fig.5.10. Excepted to Ag0.95Bi0.05SbO3-δ, amounts
for Sb3+ in the bulk were decreased compared with non-doped sample. As described in
chapter 2.4.1. and chapter 3.5.1 previously, Sb3+ has an important role to enhance
0
10
20
0
10000
20000
Bi doping amount/mol %
T
he
s
tronge
st
int
ens
it
y/
cps
-55-
electrical conductivity. Improvement of σ is expected to only Ag0.95Bi0.05SbO3-δin the
sight of antimony valences. In this sample, Bi2Sb2O7 was dominated than BiSbO4 as
byproducts of substitution because of its Sb valences. Due to change valences of Sb, Ag valences changed to maintain charge neutrality. In Ag0.8Bi0.2SbO3-, valences of Ag, Sb,
and Bi are disordered because of its deterioration of crystallinity.
Fig.5.3 XPS spectrum about Ag 3d orbital of Ag1-xBixSbO3-δ
Fig.5.4 XPS spectra about Bi 4f orbital of Ag1-xBixSbO3-δ
155
160
165
0
10000
20000
Binding energy/eV
Int
ens
it
y/
cps
Ag
Ag
0.99Bi
0.01SbO
3- 0.95Bi
0.05SbO
3-Ag
0.9Bi
0.1SbO
3-Ag
0.8Bi
0.2SbO
3-365
366
367
368
369
370
Binding energy/eV
N
orm
al
iz
ed i
nt
ens
it
y/
A
.U
.
AgSbO
3(NS)
Ag
0.99Bi
0.01SbO
3-Ag
0.95Bi
0.05SbO
3-Ag
0.9Bi
0.1SbO
3-Ag
0.8Bi
0.2SbO
3- Ag Ag+ Ag2+-56-
Fig.5.5 XPS spectrum about Bi 4f orbital of Ag0.8Bi0.2SbO3-δ
Fig.2.6 (reproduced) XPS spectrum about Sb 3d3/2 orbital of AgSbO3
155
160
165
170
0
10000
20000
Binding energy/eV
Int
ens
it
y/
cps
Bi 4f 7/2
Bi 4f 5/2
Bi
3+
Bi
3+
Bi
0
Bi
0
537
538
539
540
541
542
0
10000
20000
30000
40000
50000
60000
Int
ens
it
y/
cps
Binding Energy/eV
Sb
5+Sb
3+NS
-57-
Fig.5.6 XPS spectrum about Sb 3d3/2 orbital of Ag0.99Bi0.01SbO3-δ
Fig.5.7 XPS spectrum about Sb 3d3/2 orbital of Ag0.95Bi0.05SbO3-δ
537
538
539
540
541
542
0
20000
40000
60000
80000
Int
ens
it
y/
cps
Binding Energy/eV
Sb
5+
Sb
3+
Ag
0.99
Bi
0.01
SbO
3-
537
538
539
540
541
542
0
10000
20000
30000
40000
50000
Int
ens
it
y/
cps
Binding Energy/eV
Sb
5+
Sb
3+
Ag
0.95
Bi
0.05
SbO
3-
-58-
Fig.5.8 XPS spectrum about Sb 3d3/2 orbital of Ag0.9Bi0.1SbO3-δ
Fig.5.9 XPS spectrum about Sb 3d3/2 orbital of Ag0.8Bi0.2SbO3-δ
537
538
539
540
541
542
0
0.2
0.4
0.6
0.8
1
[
10
5
]
Int
ens
it
y/
cps
Binding Energy/eV
Sb
5+
Sb
3+
Ag
0.9
Bi
0.1
SbO
3-
537
538
539
540
541
542
0
10000
20000
30000
40000
50000
Int
ens
it
y/
cps
Binding Energy/eV
Sb
5+Sb
3+Ag
0.8Bi
0.2SbO
3--59-
Fig.5.10 Ratio of Sb3+ and Sb5+ about Bi substituted samples
5.4. Measurement of thermoelectric conversion efficiency
5.4.1. Measurement of electrical conductivity
Figure 5.10 shows temperature dependence of σ for Ag1-xBixSbO3, and Fig.5.11 shows
the relationship between doping amount of Bi and σ at 600℃. Ag0.95Bi0.05SbO3-δ
showed the highest σ in these five samples. Nevertheless Bi doping amount was larger, Ag0.9Bi0.1SbO3-δ and Ag0.8Bi0.2SbO3-δ-SPS indicated lower σ than Ag0.95Bi0.05SbO3-δ. As
described in chapter 5.3.2., large amount of Sb3+ caused improvement of σ.
Figure 5.12 shows temperature dependence of σ for Ag0.9Bi0.1SbO3-δ-SPS. SPS process
caused improvement of σ for Ag0.9Bi0.1SbO3-δlikewise chapter 3.5.1.. 0% 10% 20% 30% 40% 50% 60% 70% 80% 90% 100%
Bi 0mol% Bi 1mol% Bi 5mol% Bi 10mol% Bi 20mol%
Sb5+ Sb3+
-60- Fig.5.10 Electrical conductivity of Ag0.9Bi0.1SbO3-δ
Fig.5.11 Bi amount dependence of electrical conductivity at 600℃
0
200
400
600
800
-6
-4
-2
0
2
log
/
S
・cm
-1Temperature / °C
AgSbO
3(NS)
Ag
0.9Bi
0.1SbO
3-Ag
0.95Bi
0.05SbO
3-Ag
0.99Bi
0.01SbO
3-Ag
0.8Bi
0.2SbO
3-0
10
20
-3
-2
-1
0
1
2
Bi doping amount/mol %
log
a
t 600
℃
/S
cm
-1
-61-
Fig.5.12 Electrical conductivity of Ag0.9Bi0.1SbO3-δ-SPS
5.4.2. Measurement of Seebeck coefficients
Temperature dependences of S of Ag1-xBixSbO3-δ are shown in Fig.5.13, and the
relationship between doping amount of Bi and S at 600℃ is shown in Fig.5.14. S of Ag1-xBixSbO3-δis affected Ioffe`s theory up to x≦0.01, however S of Ag0.8Bi0.2SbO3-δ
was low nevertheless its σ was also low because of its bad crystallinity. The power factor of Ag1-xBixSbO3-δis shown in Fig.5.15. In this chapter, Ag0.95Bi0.05SbO3-δ showed
the highest power factor. Bi doping caused not only improvement of electrical conductivity by charge enhancement, but also decrease of S by deterioration of crystallinity.
S and PF of Ag0.9Bi0.1SbO3-δ-SPS are shown in Fig.5.16 and Fig.5.17, respectively.
SPS process caused decrease of S likewise chapter 3.5.2. and chapter 4.4.2.. Introduction of SPS process could not achieve improvement of power factor in Ag0.9Bi0.1SbO3-δ.
0
200
400
600
800
-6
-4
-2
0
2
4
log
/
S
・cm
-1Temperature / °C
Ag
0.9Bi
0.1SbO
3-Ag
0.9Bi
0.1SbO
3-
SPS
-62- Fig.5.13 Seebeck coefficients of Bi doped AgSbO3
0
200
400
600
800
-600
-500
-400
-300
-200
-100
0
S
/
VK
-1Temperature / °C
AgSbO
3(NS)
Ag
0.9Bi
0.1SbO
3-Ag
0.95Bi
0.05SbO
3-Ag
0.99Bi
0.01SbO
3-Ag
0.8Bi
0.2SbO
3--63-
Fig.5.14 Bi amount dependence of Seebeck coefficients at 600℃
Fig.5.15 Power factor of Ag1-xBixSbO3-δ
0
10
20
-500
-400
-300
-200
-100
0
Bi doping amount/mol %
Se
ebe
ck c
oe
ff
ic
ie
nt
a
t 600
℃
/
VK
-1
0
200
400
600
800
-12
-11
-10
-9
-8
-7
-6
-5
-4
logP
F/
W
m
-1K
-2Temperature / °C
NS
Ag
0.8Bi
0.2SbO
3-Ag
0.9Bi
0.1SbO
3-Ag
0.95Bi
0.05SbO
3-Ag
0.99Bi
0.01SbO
3--64-
Fig.5.16 Bi amount dependence of power factor at 600℃
Fig.5.17 Seebeck coefficients of Ag0.9Bi0.1SbO3-δ-SPS
0
10
20
-12
-10
-8
-6
-4
Bi doping amount/mol %
logP
F a
t 600
℃
/Wm
-1
K
-2
0
200
400
600
800
-600
-500
-400
-300
-200
-100
0
S
/
VK
-1Temperature / °C
Ag
0.9Bi
0.1SbO
3-Ag
0.9Bi
0.1SbO
3-
SPS
-65- Fig.5.18 Power factor of Ag0.9Bi0.1SbO3-δ-SPS
5.5. Chapter conclusion
Ag1-xBixSbO3-δ(x= 0.01, 0.05, 0.1, 0.2) were synthesized by the solid state reaction.
They have some byproducts such as bismuth antimonate and metallic Ag. Excess amounts of substitution caused occurring unexpected impurities and degradation of thermoelectric properties. Sb3+ has also important role in Bi substituted samples for
enhancement electrical conductivity and power factor. SPS can also improve density and electrical conductivity of Ag1-xBixSbO3-δ. However, power factor could not be
enhanced in this chapter.
Reference
[1] Huiyan F, Guonian W, Lili H, Infrared, Raman and XPS spectroscopic studies of Bi2O3–B2O3–Ga2O3 glasses. Solid State Sciences ; 2009 : vol.11, issue 12 : 2065-2070
0
200
400
600
800
-10
-9
-8
-7
-6
-5
-4
PF
/l
og(W
m
-1K
-2)
Temperature / °C
Ag
0.9Bi
0.1SbO
3-
SPS
Ag
0.9Bi
0.1SbO
3--66-
6. Fabrication of thermoelectric module from commercial Peltier device and field test at a factory
In this chapter, we have reported about fabricating thermoelectric module and field test in practical factory for gathering the data of practical performance of thermoelectric generation.
6.1. Fabrication of thermoelectric modules
36 commercial Peltier devices (TEC1-12712) were pasted on 30 × 30 cm aluminum substratum disk and connected thermal parallel and electrical directly. Each device was equipped radiating fin at opposite side from Al disk. Fig.6.2 shows temperature dependence of S of a Peltier device TEC1-12712.
-67-
Fig.6.2 Temperature dependence of S of a Peltier device TEC1-12712
6.2. Field test at the factory
We use the wall of batch-type furnace as heat source. Module was stood up facing to the wall of furnace, and generated the electricity by using waste heat of the furnace. Distance between furnace and module is 1~12 cm. Temperature of each part (heat source, Th, Tl, and atmosphere) and thermoelectric voltage were measured by multi-tester (cores, core-900 and core-1000).
30
40
50
60
70
80
90
0
0.005
0.01
0.015
Temperature of heating side/℃
S of one
P
el
ti
er uni
t/
V
K
-1
-68- Fig.6.3 Experimental scene
6.3. Influence of heat absorber
To prevent the effect of cooling by atmosphere in high temperature side, glass fiber containing Si was covered on high temperature side of the module as a heat absorber.
Wall of Furnace
←Th Tl→
-69- Fig.6.4 Heat absorber
6.4. Temperature irregularity at the surface of module
It is estimated that generation efficiency of each Peltier devices has the difference between inside and outside of module because the outside cooled by atmosphere. To investigate affection of temperature irregularity, the module is divided to two parts shown in Fig.6.6 from the state of Fig.6.5.
-70- Fig.6.5 Circuit of whole module
Fig.6.6(a)(b) Circuits of divided modules. (a) is outside part, (b) is inside part, respectively.