DEVELOPMENT OF MICROBIOLOGICAL WATER
DENITRIFICATION UNDER ANAEROBIC CONDITION
BY HYDROGEN GAS SUPPLY
水素ガス供給によって形成される嫌気水環境条件下における微生物
学的脱窒の高効率化
September 2017
DEVELOPMENT OF MICROBIOLOGICAL WATER
DENITRIFICATION UNDER ANAEROBIC CONDITION
BY HYDROGEN GAS SUPPLY
水素ガス供給によって形成される嫌気水環境条件下における微生物
学的脱窒の高効率化
A dissertation submitted in partial fulfillment of the requirements for the degree of Doctor of Philosophy in Engineering
Special Doctoral Course on Integrated River Basin Management Interdisciplinary Graduate School of Medicine and Engineering
University of Yamanashi Japan
Examination committee : Prof. Kazama Futaba
Assoc. Prof. Mori Kazuhiro
Assoc. Prof. Toyama Tadashi Prof. Nishida Kei
Assoc. Prof. Eiji Haramoto Prof. Sakamoto Yasushi
September 2017 Rawintra Eamrat
Acknowledgements
I would like to express my profound gratitude to my academic and research advisor and chairman of this examination committee, Prof. Futaba Kazama, for her valuable guidance, encouragement, and invaluable suggestions during my research.
I also express my sincere gratitude, appreciation, and thanks to my committee members, Assoc.Prof. Mori Kazuhiro, Assoc.Prof. Toyama Tadashi, Prof. Nishida Kei, Assoc. Prof. Eiji Haramoto, and Prof. Sakamoto Yasushi for their kind supports, critical suggestion and recommendations, which led to the completion of this thesis.
My thanks to the Japanese Government (Monbukagukusho) scholarship (MEXT) for generously providing a scholarship for this research grant. This research was also partially funded with assistance from the “Project for Hydro-Microbiological Approach for Water Security in Kathmandu Valley, Nepal” under the JST and JICA Science and Technology Research Partnership for Sustainable Development (SATREPS) program, and the Japan Society for the Promotion of Science KAKENHI GRANT number 26340059.
I would like to extend my deep appreciation to Laboratory staff member Ms. Yuki Yoneyama for technical support in chemical analysis. I would also like to thank Dr. Tatsuru Kamei, Kazama Lab members, and the ICRE members for their support during my research.
Lastly, I would like to sincerely thank my parents, who have given me everything, encourage, and kindly supported me, and taken care of me in all regards.
Abstract
Nitrate contamination in groundwater has increased significantly in recent years worldwide, and especially in developing countries, where most residents (especially in remote areas) consume groundwater directly without treatment. Therefore, nitrate contamination of groundwater is a serious environmental and health issue in developing countries. Moreover, important factors in groundwater treatment design, such as electricity, power supply, funds, manpower, and materials, are often limited in developing countries. Therefore, the biological denitrification process is selected for nitrate remediation in groundwater due to low cost and simple management as compared with physicochemical technologies. Among biological technologies, hydrogenotrophic denitrification (HD) is the most well known process that leaves no residual organic carbon in treated water (using H2 as the electron donor and a
bicarbonate as carbon source) which suitable for drinking water. However, this process involves drawbacks such as the low solubility, low gas-liquid mass transfer, and high cost of hydrogen gas. To overcome these drawbacks, advance treatment technologies have been developed to increase H2 utilization and treatment capacity and eliminate
sludge washout. Advanced treatment technology is expensive and requires secondary treatment and skillful technicians for operation and maintenance. To overcome these drawbacks, a simple HD reactor was developed in this study and applied in developing countries for remediating nitrate (NO3-N) contamination in groundwater. Design criteria
for improving the operational bottleneck in simple HD reactors were investigated, including minimizing the hydrogen gas supply, increasing the nitrogen efficiency, and maintaining high energy effectiveness. To fulfill the goals of this study, the problem outlined above was explored via four main approaches experimental investigation, mathematical models, scale up scenarios, and microbial communities.
During the experimental investigation, various factors were studied in order to
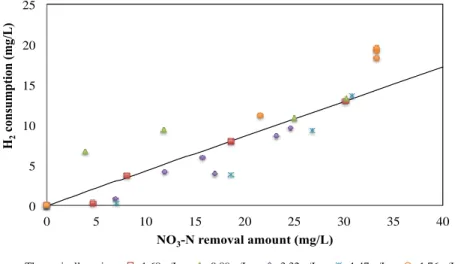
improve the simple HD system to achieve high nitrogen removal efficiency and hydrogen effectiveness. Before the star-up of the HD reactor, the minimum amount of H2 required to remove 1 mg of NO3-N was determined. The results indicate that
0.45±0.06 mg of H2 is needed to remove 1 mg of N under a bacterial mixed-culture
was used for complete denitrification. However, the real HD system is an open system in which most of the H2 is released to the air. To improve the operational bottlenecks in
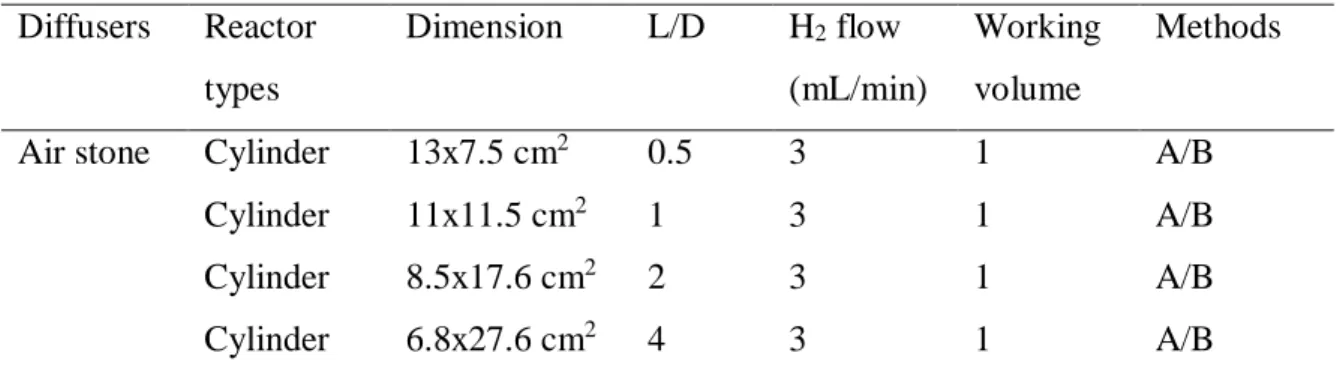
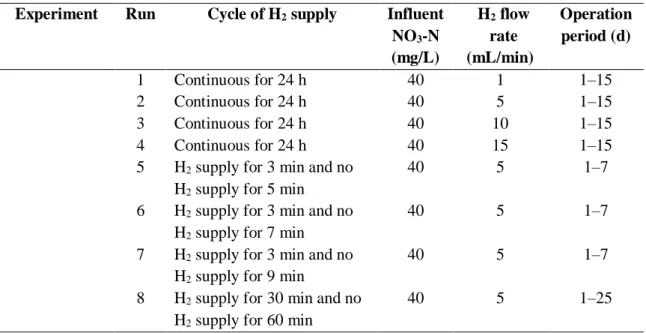
this simple HD reactor, various design parameters were investigated; these design parameters consist of reactor configurations (using L/D ratios of 0.5, 1, 3, and 4), gas diffusers (either a traditional and microbubble diffuser), H2 flow patterns (using a
continuous H2 supply of 1, 5, 10, and 15 mL/min and an intermittent H2 supply in
cycles of 3/5, 3/7, 3/9, and 30/60 min; ON:OFF), biological carrier materials (using Biofringe, PVA gel, Biofix, and Aqua cube), HRTs (of 12 to 2 hours), and temperature (32 and 24 ℃). The optimized results reveal that the HD reactor should involve a tall reactor with a ratio of length/diameter of more than 2 in order to enhance hydrogen utilization and nitrogen removal efficiency. The optimized reactor design shows that the use of microbubble technology under the attached growth on a Biofix (biological carrier) reactor is effective for achieving high nitrogen removal capacity, H2
effectiveness, and percent H2 use by microorganisms, and has great potential for the
enhancement of simple HD reactors. The maximum nitrogen removal capacity is found to be 186.91± 0.11 g/m3/day at 15.5 L-treated/g-H2 for the treated capacity. The
maximum H2 effectiveness is found to be 600 mg-N/g-H2, which is 28% of the total H2
usage by microorganisms. Therefore, microbubble technology in an attached growth reactor (using Biofix as the biological carrier) is an appropriate option with great potential for enhanced simple HD reactors and convenient on-site system application.
Mathematical models, and specifically a kinetic model involved in HD process, were
developed to simulate nitrogen removal efficiency and biomass generation. The goals were to explain the HD mechanism and to predict the optimal operating conditions. A double Monod model with two-substrates limitation produces good agreement between the batch test data and the model prediction. The estimated values of the maximum specific growth rate, yield coefficient, and half saturation constant are 0.0056 h-1, 19.22 mg/L, and 1.44 mg-VS/mg-N for nitrate and 0.0032 h-1, 18.51 mg/L and 0.67
mg-VS/mg-N for nitrite, respectively. A modified Monod model with non-carrier and carrier materials (a combination of the double Monod and CSTR models) can be used to predict the optimal operating conditions for nitrate removal, degradation rate, HRT, reactor volume, and H2 supply required, which can save costs related to operating
The on-site HD system installation scenario was performed based on laboratory-scale
experimental data. This section consisted of two operational phases: the start-up period and a 30-day operation period. Each period consisted of four hydrogen gas supply scenarios. Scenario analysis shows that a single HD reactor with a tall reactor, which has an L/D ratio of more than 2, contains Biofix as a biological carrier material, and uses microbubble technology in the hydrogen gas diffuser (average bubble size < 25 𝜇m), was appropriate for on-site scale HD reactor for application in developing countries.
Last, microbial communities involved in HD processes under different conditions
were analyzed by high-throughput sequencing using Illumina sequencing technology. These results indicated that class Betaproteobacteria belonging to phylum Proteobacter was the main predominant in all samples. Hydrogenophaga spp., Thauera spp., and an unclassified genus in Rhodocyclaceae were the predominant genera in the reactors and were responsible for HD, resulted in excellent nitrogen removal performance in synthetic groundwater and used hydrogen gas as an electron donor and bicarbonate as a carbon source. Thauera spp. was the predominant genus in the low hydrogen supply experiments (using optimized conditions including a continuous hydrogen supply, an intermittent hydrogen supply, and microbubble reactor). However, the system performance was not remarkably different with high hydrogen supply patterns. This result suggests that Thauera spp. might be responsible for HD under low hydrogen conditions.
Table of Contents
Chapter Title Page
Title Page Acknowledgements i Abstract ii Table of Contents v List of Table x List of Figures xi
List of Abbreviations xvi
1 Introduction 1
1.1 Background 2
1.2 Objectives 4
1.3 The Scope of this research 4
2 Literature Review 8
2.1 Nitrate (NO3-N) contamination in water resource and its
impact………
9
2.1.1 Potable standards and the problem caused by high nitrates……….. 9
2.2 Nitrate control methods……… 10
2.2.1 Physicochemical methods………. 10
2.2.2 Biological denitrification……….. 10
2.2.2.1 Heterotrophic denitrification……… 11
2.2.2.2 Hydrogenotrophic denitrification-theory………. 11
2.3 Factor controlling HD performance………. 13
2.3.1 Reactor configuration………. 13 2.3.2 Hydrogen concentration……… 15 2.3.2 Temperature……….. 15 2.3.4 pH………. 16 2.3.5 Substrate concentration………. 16 2.4 Microbial community………... 17
2.5 Mathematic kinetic model expected of HD……….. 17
2.5.1 Evaluation of kinetic parameters from the Monod equation.. ………. 18
2.5.2 Evaluation of a modified Monod equation with a two-step reaction (Switching function)……… 19
2.5.3 Evaluation of modified Monod equation kinetic parameter in a continuous substrate feed model……….. 21
3 Minimum H2 Amount Required for the HD process…… 24
3.1 Introduction……….. 25
Table of Contents
Chapter Title Page
3.3 Methodology………... 26
3.3.1 Synthetic groundwater preparation………... 26
3.3.2 Batch experiment for minimum hydrogen gas consumption………... 26
3.3.3 Analytical methods………... 27
3.4 Results and Discussion………. 28
3.4.1 Minimum hydrogen gas amount required by mix-culture of microorganism 26 3.4.2 Comparison with the literature………..……….. 29
3.5 Summary……….. 29
4 Reactor Configurations to Improve Operational Bottlenecks of a Simple HD Reactor……….. 32
4.1 Introduction………... 33
4.2 Specific objectives..……….. 34
4.3 Methodology………. 34
4.3.1 The effect of reactor configuration……….. 34
4.3.2 Physicochemical methods…..……….. 35
4.3.3 Biological methods………. 36
4.4 Results and Discussion………. 36
4.4.1 The effect of reactor L/D ratio on physicochemical properties………. 36
4.4.2 The effect of reactor L/D ratio on biological properties.. 39
4.5 Summary.….………. 38
5 Enhancement of HD Performance using a Traditional Diffuser (Air stone)……….. 40
5.1 Introduction……….. 41
5.2 Specific objectives..……….. 41
5.3 Methodology………. 42
5.3.1 Reactor setup and operating condition………. 42
5.3.2 Nitrogen removal efficiency and HD performance calculation……… 43
5.3.3 Hydrogen gas effectiveness calculation……… 44
5.4 Results and Discussion……… 44
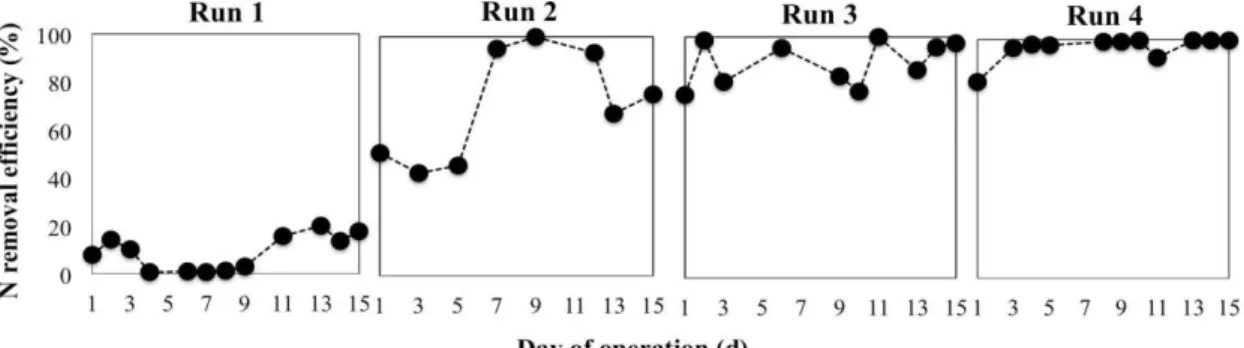
5.4.1 Performance with continuous hydrogen supply………… 44
5.4.2 Performance with intermittent hydrogen supply……….. 47
5.5 Summary……….. 49
6 Carrier Materials for the Enhancement of simple HD reactor. ……… 51 6.1 Introduction………. 52
Table of Contents
Chapter Title Page
6.3 Methodology………. 53
6.3.1 Biological Carrier materials……….. 53
6.3.2 Reactor setup and operation conditions……… 54
6.3.3 Statistical analysis……… 55
6.4 Results and Discussion.……… 56
6.4.1 The effect of HRT on different biological carrier materials……… 56
6.4.2 The effect of hydrogen gas effectiveness on different biological carrier materials………... 59
6.4.3 A comparison of reactors with and without suitable biological carriers ……… 60
6.4.4 The effect of hydrogen flow rate on different carrier materials………... 61
6.4.5 The effect of temperature on HD performance………… 64
6.5 6.3.3 Summary………. 67
7 The Application of Microbubble Technology for Simple HD Reactor Enhancement……….. 69
7.1 Introduction……….. 70
7.2 Specific objectives……… 71
7.3 Methodology……… 71
7.3.1 Microbubble diffusers characteristics……….. 71
7.3.2 Reactor setup and operating conditions……… 72
7.3.3 Physicochemical characteristics………... 73
7.4 Results and Discussion………. 74
7.4.1 The performance of millibubbles and microbubbles in HD ……….………. 74
7.4.2 Optimized HD performance with micro-hydrogen bubble (without a carrier material)……….. 77
7.4.3 Optimized HD performance with micro-hydrogen bubble and Biofix as a carrier material………. 79
7.4.4 The physicochemical properties and mechanism of micro-hydrogen bubble………. 81
7.5 Summary………... 83
8 Mathematic Model of main reactions involve in the HD process……….. 86
8.1 Introduction……….. 87
8.2 Specific objectives……….. 88
Table of Contents
Chapter Title Page
8.3.1 Flow chart of the overall modified kinetic models
process………. 88
8.3.2 Experimental setup………. 92
8.3.3 Measurement of microbial growth………. 93
8.4 Results and Discussion……… 94
8.4.1 Kinetic parameters from batch test……….. 94
8.4.2 Model validation………. 95
8.4.3 Parameter sensitivity………. 102
8.4.4 A combination double Monod and continuous substrate feed (CSTR) model………. 102
8.4.5 A combination double Monod and continuous substrate feed (CSTR) model with biological carrier material…. 104 8.5 Summary……… 106
9 An On-Site HD System Scenario and Preliminary Cost Analysis………. 107 9.1 Introduction………….……… 108
9.2 Specific objectives………. 109
9.3 Methodology……… 109
9.3.1 Preliminary cost analysis based on laboratory-scale reactors……….……….. 109
9.3.2 Scenario for an on-site HD system………. 111
9.4 Results and discussion……….... 112
9.4.1 Preliminary cost analysis……… 112
9.4.2 Scenario for an on-site or pilot-scale HD unit………… 113
9.5 Summary………. 116
10 Bacterial Communities Involved in HD Process……… 119
10.1 Introduction………….……… 120
10.2 Specific objectives..……… 121
10.3 Methodology……… 121
10.3.1 Samples collection……….. 121
10.3.2 DNA extraction……… 121
10.3.3 Quantification of total bacteria by real-time PCR analysis……….. 122 10.3.4 Next generation sequencing (NGS) analysis for bacterial community characterization……… 122
10.3.5 Statistical analysis……… 123
Table of Contents
Chapter Title Page
10.4.1 The effect of hydrogen gas flow pattern with traditional
diffuser……… 125
10.4.2 The effect of bubble size: a comparison of milli-and micro-hydrogen bubbles……… 129
10.4.3 The effect of HRT on the bacterial community, which was attached on the carrier material……… 131
10.5 Discussion……… 134
10.6 Summary……… 139
11 Conclusions and Recommendations……… 141
11.1 Conclusions………. 142
11.2 Recommendation………. 146
List of Tables
Table Title Page
3.1 The detail of chemical for Synthetic groundwater preparation… 26
3.2 Minimum H2 gas amount required by mixed-culture of
hydrogenotrophic denitrifying bacteria……… 31
4.1 Summary of operating condition about reactor configurations… 35
5.1 Summary of the operating conditions of the hydrogenotrophic
denitrification
reactors……… 43
6.1 Characteristics of carrier materials……….. 53
6.2 Summarized of operating condition under various parameters… 55
7.1 Summary of the operating conditions of the hydrogenotrophic
denitrification reactors under microbubble diffusers……… 73
7.2 Summarize the comparison between microbubble and
macrobubble in physical properties……….. 82
7.3 Performance of HD systems in the literature……… 85
8.1 Kinetic parameters with two substrates limitation under mix-culture of hydrogenotrophic denitrifier bacteria (batch test)…… 95
8.2 Double Monod model with two-step of hydrogenotrophic
denitrification process with batch mix-culture test………... 98
8.3 Kinetic parameters with sensitivity analysis……… 102
9.1 Comparison between investment cost and effective for five options………..
118 9.2 The minimum H2 amount required from different scenario (start
up) ……… 114
9.3 The minimum H2 amount required from different scenario (30
day) ………
115 10.1 Detail of samples collections under various operating condition. 124 10.2 Percent of Relative abundances at the family and genus levels
of main bacterial communities under different hydrogen supply
List of Figures
Figure Title Page
1.1 Research framework flowchart ………. 7
3.1 Schematic representation of batch assay for the mass
consumption ratio between nitrogen removal and H2 gas
consumption……… 27 3.2 Correlation of H2 consumption and nitrate removal at various
biomass concentrations. ………. 31
4.1 Drawing diagram of cylinder reactor with Length/Diameter
(L/D)
ratio……… 34 4.2 DH concentration change with time at difference L/D ratio
(L/D of 0.5 in black cycle, L/D of 1 in white rectangular, L/D of 2 in black diamond and L/D of 4 in white triangle)
36
4.3 Nitrogen removal efficiency change with time (A) and
degradation rate (B) at difference L/D ratio (L/D of 0.5 in black cycle, L/D of 1 in white rectangular, L/D of 2 in black diamond and L/D of 4 in white triangle) ………
38
4.4 Percentage of H2 usage by microorganism (H2 utilization) at
different L/D reactor ratio (L/D of 0.5 in black cycle, L/D of 1 in white rectangular, L/D of 2 in black diamond and L/D of 4 in white triangle) ………
38
5.1 Schematic diagram of the lab-scale hydrogenotrophic
denitrification reactor; (a) drawing photo and (b) photo of the actual experimental setup……….
43
5.2 Nitrogen removal efficiencies of the continuous hydrogen
supply reactors. Run 1: 1 ml/min of H2, Run 2: 5 ml/min of H2,
Run 3: 10 ml/min of H2, and Run 4: 15 ml/min of hydrogen….
45
5.3 Dissolved hydrogen concentrations in the continuous hydrogen
supply reactors. Run 1: 1 ml/min of hydrogen, Run 2: 5 ml/min of hydrogen, Run 3: 10 ml/min of hydrogen, and Run 4: 15 ml/min of hydrogen……….
46
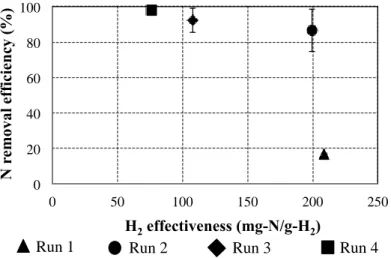
5.4 The relationship between hydrogen effectiveness and nitrogen removal efficiency at various hydrogen flow rates……….
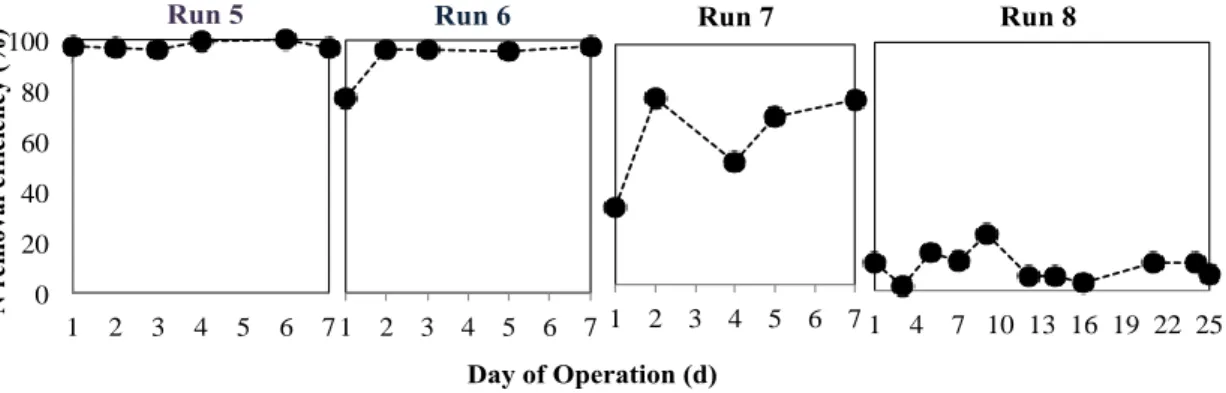
46 5.5 Nitrogen removal efficiencies of the intermittent hydrogen
supply reactors. Run 5: 3/5 min of hydrogen (ON/OFF), Run 6: 3/7 min of hydrogen (ON/OFF), Run 7: 3/9 min of hydrogen (ON/OFF), and Run 8: 30/60 min of hydrogen (ON/OFF)…….
List of Figures
Figure Title Page
5.6 Profiles of dissolved hydrogen concentrations in the
intermittent hydrogen supply reactors on the 5th day of operation. Run 5: 3/5 min of hydrogen (ON/OFF), Run 6: 3/7 min of hydrogen (ON/OFF), Run 7: 3/9 min of hydrogen (ON/OFF), and Run 8: 30/60 min of hydrogen (ON/OFF)…….
48
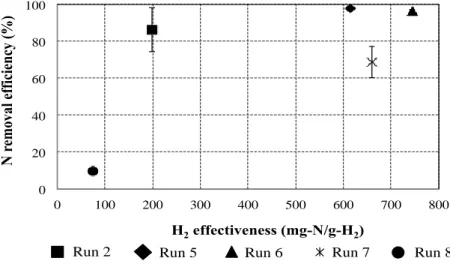
5.7 Comparison of the hydrogen effectiveness and nitrogen
removal efficiency under continuous and intermittent hydrogen supply………
49 6.1 Real photo of biological carrier material; (A) Bio-fringe, (B)
PVA gel beads in soft type, (C) Aqua cube and (D) Biofix……. 54 6.2 Laboratory-scale HD reactor with biological carrier materials;
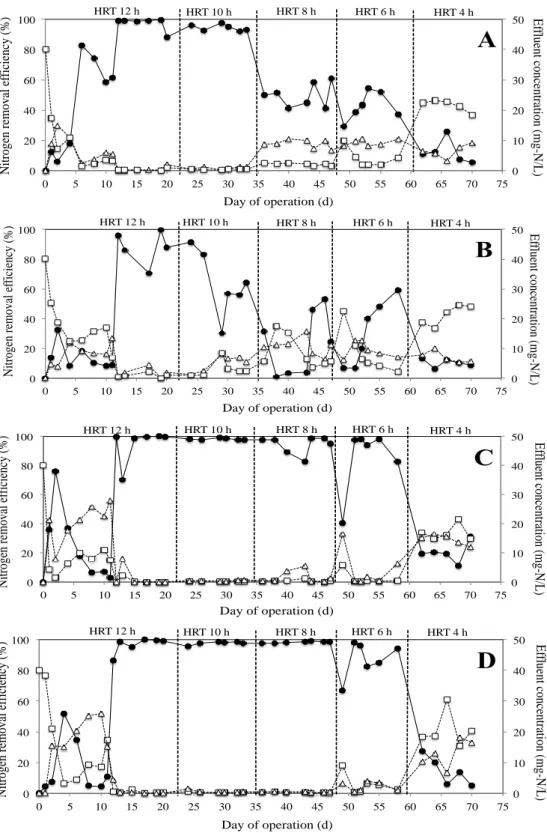
(A) drawing detail reactor and (B) real photo……….. 55 6.3 The Effect of HRTs on the nitrogen removal efficiency with
Biofringe as carrier material (A), PVA gel as carrier material (B), Aqua cube as carrier material (C) and Biofix as carrier material (D)………..
58
6.4 Comparison of the hydrogen effectiveness and maximum
nitrogen removal capacity under non-carrier and carrier materials as supporting media for HD reactor (Bio-fringe, PVA gel, Aqua cube and Biofix) ……….
59
6.5 Comparison between non-carrier reactor and suitable carrier reactor (Aqua cube and Biofix as biological carrier materials)… 60
6.6 The Effect of hydrogen gas and HRT on the system
performance by (A) HRTs, (B) Hydrogen gas flow rate (mL/min), (C) performance with Aqua cube and (D) performance with Biofix as carrier materials………
62
6.7 The relative of hydrogen gas effectiveness and nitrogen
removal capacity under various hydrogen gas flow rate under Aqua cube and Biofix as carrier materials………..
63 6.8 The nitrogen removal efficiency under effect of temperature
with two temperature of 24 ± 1.2℃ and 32 ± 1.5 ℃ by (a) Aqua cube as carrier material and (b) Biofix as carrier material……..
65 6.9 Relative of denitrification rate under various temperatures by
(a) Aqua cube reactor and (b) Bio-fix reactor……….. 66 6.10 Relationship between R*ln(k) and 1000/T for Aqua cube and
Biofix reactors based on Arrhenius-type………. 66 7.1 Micro-hydrogen bubble diffusers; (a) Ultrasonic oscillating
mesh system (name is MiBos) from environmental engineering lab (Gunma University, Japan) and (b) Swilling-Type micro-bubble diffuser FBT 50 (SWTMs)………..
72
7.2 Change of dissolved hydrogen concentration during the
experiment
List of Figures
Figure Title Page
7.3 Performance of two systems in term of nitrogen removal
efficiency and effluent concentration by (a) microbubble reactor and (b) millibubble reactor………..
75
7.4 Percentage of biological hydrogen gas consumption for
denitrification and hydrogen released in (a) microbubble and (b) millibubble……….
76 7.5 The trend of total hydrogen supply, nitrogen removal capacity
(A) and the performance (B) under the optimized HD with micro-hydrogen bubble supply; Run 1 is optimized performance with MiBos as microbubble diffuser, Run 2 is optimized performance with SWTMs as microbubble diffuser...
78
7.6 The comparison under optimized condition of millibubble
reactor and microbubble reactor. ………. 79
7.7 The trend total hydrogen supply, nitrogen removal capacity (A)
and the performance (B) under the optimized HD with micro-hydrogen bubble supply and Biofix as biological carrier material……….
80
7.8 Comparison of the performance with different operating
condition with Air stone with Biofix, microbubble with non-carrier and microbubble with Biofix as non-carrier material. ………
80 7.9 Bubble distributions from three diffusers; (a) MiBos, (b)
SWTMs and (c-d) Air stone………. 82
8.1 Overall flowchart for developed modified kinetic models…….. 91
8.2 Batch experimental set up for identifies the kinetic parameter in step 1 and step 2………
92 8.3 Monod plot for estimation of kinetic parameters, A is specific
growth rate of nitrate at 40 mg-N/L, B is Monod plot with experimental data (NO3-N), C is specific growth rate of nitrite
at 40 mg-N/L, D is Monod plot with experimental data (NO2
-N) ………..
96
8.4 Model variation of experimental data and computed data
(modified model) for biomass generation, Nitrate and Nitrite concentration for a batch mix-culture test at various nitrogen concentration of 40, 80, 120 and 160 mg-N/L……….
97
8.5 The simulated results based on sensitivity analysis from nine
kinetic parameters………. 101
8.6 The simulated results of biomass generation and nitrogen removal efficiency from combination model of double Monod and CSTR model and experimental data………..
List of Figures
Figure Title Page
8.7 The correlation between the model simulation and experimental
data by a) Biomass generation and b) nitrogen removal efficiency………..
103
8.8 The comparative results between the experimental data under carrier reactor from chapter 6 and modified Monod with continuous feed of substrate model………..
104
8.9 Model simulation and validation with experimental data by (a)
Model simulation based on combination model of double Monod model and CSTR model (b) N removal performance (experimental data) and (c) Biomass generation (Experimental data) ………
105
9.1 Comparison between investment cost and effective for five options……….
118
9.2 Diagram of on-site HD unit for treated contaminated from
groundwater (scenario) ……… 111
9.3 On-site HD unit for treat groundwater contamination………… 113
10.1 Relative abundance values at the phylum level with continuous
hydrogen supply (Run1–4) or intermittent hydrogen supply (Run 6). Abundance values lower than 0.5% were included in the “Other” group………
126
10.2 Detail view of the microbial community at the Family and Genus levels under a continuous hydrogen supply (Run 1–4) and intermittent hydrogen supply (Run 6). ………..
128
10.3 Concentration of each gene (dominant) calculated based on 16S
rRNA gene of total bacteria (A: MiBos (microbubble, B: 1 mL /min, C: 5 mL/min, D: 10 mL/min, E: 15 mL/min and F:
intermittent H2 supply (3/7 min)) ………
129
10.4 Relative abundance values at the phylum levels with two hydrogen-bubble systems; (a) microbubble system and (b) millibubble system………
130
10.5 Relative abundance values at the family and genus levels with two hydrogen bubble systems during microbubble system and millibubble system; The abundance values lower than 5% were included in “other” group………
List of Figures
Figure Title Page
10.6 Relative abundance values at the phylum levels in six samples with different HRTs. The six samples were collected on day 0 (start up), 20 (HRT 12h), 35 (HRT 10 h), 50 (HRT 8 h), 65 (HRT 6 h), 80 (HRT 4 h) ……….
132
10.7 Detail view of the microbial community at the Family and Genus levels under different HRTs during HD operation with Biofix as carrier material; the abundance values lower than 5% were included in “other” group………
133
10.8 Concentration of each gene (dominant) calculated based on 16S
rRNA gene of total bacteria (different HRTs from 12, 10, 8, 6 and 4 h) ………
134
10.9 RDA of ordination diagram plot showing the relationship between environment variables (total nitrogen removal efficiency) and bacterial genus in the pyrosequencing data (copies/g-biomass) under response variable of hydrogen flow pattern (microbubble from MiBos, Air stone: 1, 5, 10 and 15 mL/min) ……….
138
10.10 RDA of ordination diagram plot showing the relationship between environment variables (total nitrogen removal efficiency) and bacterial genus in the pyrosequencing data (copies/g-biomass) under response variable of hydraulic retention time (HRT: 12h, 10h, 8h, 6h and 4h) ………..
139
CSTR Continuous flow stirred-tank reactor
D Dilution rate
DH Dissolve hydrogen concentration
DO Dissolve oxygen concentration
H2 Hydrogen gas
HD Hydrogenotrophic denitrification
HFMBR Hallow fiber membrane biological reactor
HRT Hydraulic retention time
Kd Dead rete constant
KLa Total gas-liquid mass transfer rate
Ks Half-saturation constants or Monod constant
L/D length/diameter ratio
MLSS Mixed liquor suspended solids
N2 Nitrogen gas
NLR Nitrogen loading rate
NO2-N Nitrite-nitrogen
NO3-N Nitrate-nitrogen
NRR Nitrogen removal rate
Q Flow rate
qPCR Real time polymerase chain reaction
S Substrate concentration
SBR Sequencing batch reactor
t Time Temp. Temperature TN Total nitrogen V Volume VS Volatile solid X Biomass concentration Y Biomass yields
F NO3−N Switch function of nitrite occurs at low nitrate concentration
q NO2−N Nitrite removal rate
q NO3−N Nitrate removal rate
μ Specific growth rate
μ max Maximum specific growth rate
υ Kinematic viscosity of water (m2/s)
Chapter 1
Chapter 1
Introduction
1.1 Background
Nitrate contamination of groundwater has been associated with serious environmental problems in several developing countries, such as Nepal, the Philippines, Vietnam, and Thailand (Khatlwada et al. 2002; Tirado 2007). Groundwater is an important water resource in these countries, and most residents, especially in remote areas, consume groundwater directly without treatment. Therefore, the consumption of nitrate-contaminated water affects human. The rising incidence of several diseases, such as methemoglobinemia (blue baby disease), gastric cancer, and non-Hodgkin’s lymphoma (Bouchard et al. 1992), has prompted the World Health Organization to establish guidelines for safe drinking water quality: nitrate-nitrogen (NO3-N) concentrations
should not exceed 11 mg/L and nitrite-nitrogen (NO2-N) should be less than 0.9 mg/L
(Anon 2011). The three most significant causes of nitrate contamination are extensive use of fertilizers, discharge of domestic wastewater, and unsanitary disposal of sewage waste. Rapid urbanization in recent decades has also led to increases in nitrate contamination in terms of concentration values and contaminated area. To ensure the safety of drinking water, it is necessary to treat pumped groundwater in contaminated areas.
Methods for remediating nitrate contamination in groundwater are categorized into two common technologies: physicochemical process (i.e., chemical precipitation, membrane filtration, electro-dialysis, and catalysis) and biological process (i.e., heterotrophic denitrification and autotrophic denitrification; (K.A. Karanasios et al. 2010). The limitations of physicochemical technologies, including high investment and construction costs, facility maintenance, and the generation of waste brine, are not conductive to their application in remote areas (Shrimali & Singh 2001). In contrast, biological technologies have the advantages of low cost and simple management. Therefore, they may be applicable to the improvement of groundwater quality in remote
areas. Among biological technologies, hydrogenotrophic denitrification (HD) is the most well known process that leaves no residual organic carbon in the treated water. HD is an autotrophic denitrification process in which hydrogen acts as an electron donor and bicarbonates act as a carbon source under anoxic conditions. The stoichiometric expression of the HD reaction is shown in Eq. 1.1.
NO3- + 3.03 H2 + H+ + 0.229 HCO3- 0.48 N2 + 3.60 H2O + 0.0458 C5H7O2N (1.1)
However, the low solubility, low gas-liquid mass transfer, and high cost of H2 limit its
widespread application. To overcome this drawback, advance treatment technologies (including hollow fiber membrane reactors, gas permeable membrane bioreactors, fiber membrane bioreactors and bio-electrochemical reactors) have been developed for increased H2 utilization and performance capacity. The hydrogen utilization has been
optimized to reach 100 % of the total hydrogen supply (Karanasios et al. 2012; Lee & Rittmann 2002; Mohseni-Bandpi et al. 2013), but these systems are complicated, require specialists and skillful staffs to maintenance, and necessitate a post-treatment process, making them unsuitable for application in developing countries. Therefore, simple HD reactors (including suspended growth reactors and attached growth reactors) are applied more readily in developing countries due to easy maintenance and operation. Importantly, the simple HD reactor is an open system; the high level of energy consumption and high cost of H2 due to the low solubility of H2 are significant
limitations in the simple HD reactor.
In this study, a new simple HD reactor design was developed that addresses the aforementioned simple HD reactor bottlenecks and is appropriate for groundwater treatment in developing countries. The design criteria were evaluated based on physicochemical and biological properties for enhance HD performance and H2
effectiveness. The overall and specific objectives for this research are introduced in below.
1.2 Objectives
The overall objective of this research is to develop a platform for the design and operation of a hydrogenotrophic denitrification (HD) reactor under minimized hydrogen gas supply for enhanced nitrogen removal from groundwater. The specific objectives are as follows:
1. To determine the minimum H2 amount required by mixed-culture
hydrogenotrophic denitrifying bacteria
2. To investigate various design parameters for the improvement of the operational bottleneck in simple HD reactor (i.e., reactor configurations, hydrogen flow patterns, hydrogen delivery, supporting material, and temperature).
3. To develop and validate a mathematic model of the main reactions involved in the HD process
4. To optimize the operating conditions and cost for large-scale application. 5. To understand the bacterial community structure relative to HD performance.
1.3 The scope of this research
The scope of this study is summarized as a research framework; it is illustrated in
Figure 1.1. The aim of each chapter is explained below:
Chapter 3: The minimum H2 amount required for the conversion of nitrate to
nitrogen gas by mixed-culture microorganisms is investigated. Batch tests are used to examine the activity of initial HD sludge and the minimum H2 for biological nitrate
removal. Moreover, this value is compared with stoichiometric HD values and used to calculate the minimum H2 amount required for HD reactor startup.
Chapter 4: Various design parameters are investigated to improve the
operational bottleneck in a simple HD reactor. The drawbacks of the simple HD reactor include low H2 solubility and the open system design. The high level of energy (H2)
consumption from a continuous large amount of H2 supply necessary for complete
accumulation, significantly limit these technologies. The effect of reactor configuration is investigated in this chapter, and Length to Diameter (L/D) ratios ranging from 0.5 to 4 are considered. The optimal reactor ratio in term of performance and effectiveness is obtained.
Chapter 5: The high level of energy consumption from the use of a continuous
hydrogen supply, high cost of hydrogen, and risk of expelled hydrogen accumulation are significant limitations inthese studies. Therefore, the optimization of the HD system under a minimized hydrogen supply is evaluated in this chapter. Hydrogen gas flow patterns, including continuous and intermittent hydrogen, at low hydrogen supply are evaluated in this chapter. Optimized conditions involving the lowest possible hydrogen gas supplies are achieved using a traditional diffuser and are applied in next chapter.
Chapter 6: After optimizing the reactor in term of hydrogen supply, this chapter
continues the study from Chapter 5 via a discussion of methods to improve performance and cost-effectiveness in the simple HD reactor. An additional biological carrier is selected to improve the performance and reduce the environmental sensitivity. Four types of biological carriers (Biofringe, soft type PVA gel, Aqua cube, and Bio-fix) are investigated under various conditions such as effect of HRTs, hydrogen gas flow, and temperature. The optimal conditions, which must have high nitrogen removal efficiency, mechanical strength, high H2 effectiveness, low sensitivity, and easy microorganism
adhesion, is identified in this chapter.
Chapter 7: Hydrogen delivery (i.e., specific bubble characteristics) is
investigated to improve the operational bottlenecks in simple HD reactors. Microbubble technology is introduced to enhance the HD reactor. The physicochemical characteristics of the bubbles and the biological characteristics under microbubble technology are investigated in this chapter. Moreover, the HD reactor is compared with the traditional HD reactor in terms of maximum nitrogen removal rate, maximum treated capacity, H2 effectiveness, and percentage of biological hydrogen consumption.
Lastly, the new HD design, which was optimized in Chapter 4 and 6, was constructed to improve the operational bottlenecks in simple HD reactors. A combination of
microbubble technology and biological carrier is introduced to enhance the simple HD reactor. The physicochemical and biological characteristics, H2 effectiveness, and
system capacity are demonstrated in this chapter. The optimized conditions are used to design the scaled-up HD reactor and calculate the H2 supply amount required for
large-scale operations.
Chapter 8: Mathematical models of the main reactions involved in the HD
process are developed and validated in this chapter. The double Monod and CSTR models are combined to simulate the nitrogen removal efficiency and biomass generation based on two conditions: batch testing and continuous substrate feeding. The purpose of the model is to explain the HD mechanism and predict biomass and system performance. Moreover, the optimal operating conditions for the HD reactor are derived in this chapter.
Chapter 9: A scenario for on-site HD reactor installation is developed based on
the optimized conditions found in Chapter 3-7 and the model predictions in Chapter 8. Two main cost categories, construction costs and operating costs, are considered with a focus on the H2 cost for completed HD reaction. Moreover, other cost effective methods
and applications for enhanced on-site HD reactors proposed in this chapter.
Chapter 10: In this chapter, the bacterial community involved in the HD
processes outlined in Chapters 5 to 7 is discussed. The next-generation, high throughput sequencing method by Illumina sequencing is used to investigate the bacterial communities present. The dominant microorganism with the ability to convert nitrate to nitrogen gas using hydrogen gas as an electron donor is identified in this chapter. Moreover, the relationship between performance and bacterial communities in redundancy analysis (RDA) is discussed in this chapter.
Chapter 11: The results, limitations, and recommendations arising from this
Figure 1.1 Research framework flowchart
Minimum H2 Requirement Determination of the minimum H2 requirement by mix-culture of HD bacterial
Develop platform for design and operation for optimization HD reactor
Effect of H2 supply : The optimum condition with lowest H2 supply amount
Bubble size / Diffuser : Microbubble for enhancing HD performance and energy efficient
Carrier materials :
Examine the suitable carrier material under Effect of HRTs, H2 flow rate and Temperature
Modeling development involved in HD :
Modified Monod model to simulate N removal and biomass generation
The various design parameters for improve
the operational bottleneck (H
2gas supply)
Bacterial Community: Bacterial community were characterized under various conditions
Chapter 7 Chapter 6
Chapter 10 Chapter 8
Chapter 3
Chapter 1 Introduction Chapter 2 Literature Review
Chapter 9
Reactor configuration: Effect of L/D ratio for enhance the physicochemical and biological properties of simple HD reactor
Chapter 5 Chapter 4
Scenario for on-site HD unit and preliminary cost-effective analysis
Chapter11
Chapter 2
Chapter 2
Literature review
2.1 Nitrate (NO3-N) contamination in water resources and its impact
Nitrate contamination in groundwater has increased significantly worldwide in recent year. Nitrate is very soluble in water and soil, which enables it to move easily through the soil, contaminate groundwater, and cause serious environmental and health problems. Such contamination mainly arises from point sources such as sewage disposal systems, livestock facilities, and industrial effluent, and non-point sources such as fertilized cropland, leaking sewage, lawns, and so on (K A Karanasios et al. 2010). Nitrate is soluble and has a negative charge, which increases its mobility and potential for loss by leaching from the unsaturated zone. Nitrate in water is undetectable without testing because it is tasteless, odorless and colorless. Nitrate leaching is a complex interaction involving various factors such as on-ground nitrogen loading, soil characteristics, land use practices, groundwater recharge, water table characteristics, and soil nitrogen dynamics (Almasri 2007). Therefore, water testing is strongly recommended to check nitrate concentrations in household with infants, nursing mothers, and pregnant women.
2.1.1 Potable standards and the problem caused by high nitrate
Because groundwater is the most important source of drinking water, the consumption of nitrate-contaminated water often affects human health. Nitrate in water is undetectable, as it is without color, taste or odor. Excessive NO3-N and NO2-N
concentrations in drinking water can be a health hazard, and especially to pregnant woman and infants, as it can cause methemoglobinemia or blue baby syndrome. Moreover, long-term consumption of contaminated water can cause stomach and gastrointestinal cancer and non-Hodgkin’s lymphoma (Ghafari et al. 2009). Therefore, The World Health Organization (WHO) has established standards for safe drinking water as follows: nitrate-nitrogen should be lower than 11 mg-N/L and nitrite-nitrogen should be lower than 0.9 mg-N/L. Moreover, the Environmental Protection Agency
(EPA) has set lower maximum contamination levels (MCLs) for nitrate-nitrogen and nitrite-nitrogen, at 10 mg-N/L and 1 mg-N/L, respectively.
2.2 Nitrate control methods
Nitrate and nitrite contamination has a detrimental impact on groundwater and human health. Groundwater is an important water resource in the aforementioned countries, where residents, and especially those in remote areas, consume groundwater without treatment. Therefore, nitrate removal technologies have been become increasingly important. There are two common types of treatment technology for the removal of nitrate contamination from groundwater: physicochemical processes (abiotic) and biological processes (biotic).
2.2.1 Physicochemical methods
Physicochemical processes such as chemical precipitation, membrane filtration, reverse osmosis, catalysis, and electro-dialysis have been applied widely due to their high efficiency and short processing times. However, they involve waste brine disposal and high capital, energy consumption, and operating costs, which are inappropriate for groundwater treatment systems in remote areas. Owing to the limitations of physicochemical technologies, biological denitrification groundwater treatment processes are gaining increasing interest in developing countries and remote areas (Shrimali & Singh 2001).
2.2.2 Biological denitrification
Biological denitrification is an attractive treatment for groundwater nitrate removal due to its solid biological waste products, environmental friendliness, and low operating and capital costs. Biological denitrification involves a respiration process in which facultative bacteria use nitrate as a terminal electron acceptor under anaerobic or anoxic conditions (Ghafari et al., 2008). In this technique, the complete conversion of nitrate (NO3-N) to harmless nitrogen (N2) is achieved through four reduction steps:
microorganisms first reduce nitrate (NO3-N) to nitrite (NO2-N), then to nitric oxide
(NO), to nitrous oxide (N2O), and finally to nitrogen gas (N2). The oxidation step for
NO3- NO2- NO N2O N2 (2.1)
Biological denitrification processes are broadly categorized as either heterotrophic denitrification or autotrophic denitrification.
2.2.2.1 Heterotrophic denitrification
Heterotrophic denitrification is an effective nitrogen removal process that uses insoluble carbon compounds (i.e. newspaper, cotton and wheal straw) or any of a variety of carbon compounds, such as methanol, ethanol, and acetate, as electron and energy sources. Heterotrophic denitrification is widely used in wastewater treatment plants but is ineffective in groundwater and drinking water treatment due to the residual carbon, sloughed cells and potential for bacterial contamination in treated water arising from byproducts (Chang et al. 1999). This process thus requires cumbersome secondary and polishing treatments. Thus, autotrophic denitrification processes have been widely selected and used for drinking water treatment.
2.2.2.2 Hydrogenotrophic denitrification-theory
Hydrogenotrophic denitrification is one type of autotrophic denitrification. Autotrophic denitrifiers reduce inorganic compounds such as nitrate and nitrite using hydrogen gas, sulfur, and iron as electron donor sources and bicarbonate or carbon dioxide for biosynthesis (Korom 1992). The main groups of autotrophic denitrifiers include reduced sulfur oxidation bacteria, hydrogen oxidation bacteria, and ferrous oxidation bacteria, which depend on the use of electron donors in the system (Matějů et al. 1992). The choice of autotrophic denitrification over heterotrophic denitrification for drinking water and groundwater treatment is driven by the low organic carbon content in groundwater, low biomass generation (which can reduce reactor clogging), and lack of residual organic compound contamination in treated water, which has a significant affect on human health (K.A. Karanasios et al. 2010). In this study, hydrogen was selected as the electron donor for the treatment of nitrate contamination in groundwater.
Autotrophic denitrification with hydrogen gas (termed hydrogenotrophic denitrification, or HD) appears to be more effective for drinking water nitrate elimination than that
using other inorganic energy sources. The stoichiometric equation for the reactions involved in hydrogenotrophic denitrification using hydrogen as an electron donor, nitrate as an electron acceptor, and bicarbonate or carbon dioxide as a carbon source are summarized in Eq. 2.2-2.5.
Nitrate reductase
NO3- + H2 NO2- + H2O (2.2)
Nitrite reductase
NO2- + 0.5H2 + H+ NO(g) + H2O (2.3)
Nitric oxide reductase
2NO(g) + H2 N2O(g) + H2O (2.4)
Nitrous oxide reductase
N2O(g) + H2 N2(g) + H2O (2.5)
Overall reaction for the HD process (Eq. 2.6)
2NO3- + 2H+ + 5H2 N2 + 6H2O (2.6)
In other cases, the stoichiometry includes carbon sources for microbial cell synthesis and biomass generation; this equation is shown in Eq. 2.7 (Lee & Rittmann 2003)
NO3- + 3.03 H2 + H+ + 0.229 HCO3- 0.48 N2 + 3.60 H2O + 0.0458 C5H7O2N (2.7)
HD has significant advantages over heterotrophic denitrification. The main advantages of hydrogenotrophic denitrification include the promise of high removal efficiency, cleanliness, case of removal of non-toxic hydrogen gas from treated water, low biomass yield, adaptability to oligotrophic drinking water environments, lack of organic carbon requirement (which in turn eliminates residual organic carbon contamination in treated water), and lack of need for post treatment (Lee & Rittmann 2002; Smith et al. 2005; Ergas & Reuss 2001). Ergas & Reuss (2001) proposed a hollow fiber membrane bioreactor for drinking water treatment by hydrogenotrophic denitrification that reached a maximum nitrate utilization rate of 770 g-N/m3/day. Vasiliadou et al. (2009) developed a packed bed reactor to treat initial nitrate concentrations of 80 mg/L, achieving a removal efficiency of 90% and a maximum removal capacity of 2260
g-N/m3/day. Due to the many advantages of hydrogenotrophic denitrification, numerous
researchers have applied and developed this drinking water treatment method. The main drawbacks of this process are the low solubility of hydrogen gas in the surrounding liquid, high explosively, and high flammability. The high level of energy consumption involved in using a continuous hydrogen supply, high cost of hydrogen, and risk of expelled hydrogen accumulation also contribute significantly to the limitations of these method (Haugen et al. 2002). Various HD systems with high nitrogen removal efficiency that overcome these drawbacks have been developed for groundwater treatment in previous studies; these systems include hollow fiber membrane reactors, gas permeable membrane bioreactors, fiber membrane bioreactors and bio-electrochemical reactors. The hydrogen utilization has been optimized to reach 100% of the total hydrogen supply (Karanasios et al. 2012; Lee & Rittmann 2002; Mohseni-Bandpi et al. 2013) but these systems are complicated, require specialists and skillful staffs for maintenance, and necessitate a post-treatment process, making them unsuitable for application in developing countries.
2.3 Factors controlling HD performance
Several environmental parameters control the process of hydrogenotrophic denitrification, including temperature, pH, nitrogen concentration, hydrogen concentration, and reactor design. An overview of the environmental factors that must be controlled in order to achieve suitable or optimized HD conditions is given below.
2.3.1 Reactor configuration
A number of reactor configurations have been selected for HD nitrate contamination treatment operations, such as suspended growth reactors, attached growth reactors, fixed-bed and fluidized-bed reactors, biofilm electrode reactors, membrane reactors, and so on. These reactors have been tested in numerous studies in order to mitigate the operational bottleneck, improve nitrogen removal efficiencies and reduce operational costs. The advanced and traditional technologies are summarized in below in terms of their advantages and disadvantages.
Regarding the HD limitation caused by low hydrogen gas solubility, advanced technologies for groundwater treatment such as membrane reactors use highly selective technology to overcome this drawback; these technologies include hollow fiber membrane reactors, gas permeable membrane bioreactors, fiber membrane bioreactors, and bio-electrochemical reactors. The hydrogen utilization in these reactors can reach 100% of the total hydrogen supply, which can minimize hydrogen costs and increase nitrogen removal capacity. Some membrane types (such as hollow fiber membranes) require only a small space for set up, which is appropriate for limited treated water area. Moreover, counter-current diffusion systems, which involve high fluxes of nitrate and hydrogen, minimize the hydraulic retention time (Karanasios et al. 2012; Lee & Rittmann 2002; Mohseni-Bandpi et al. 2013). However, this technology also has disadvantages, which include complicated equipment, a need for skillful maintenance specialists and staff, high infrastructure and maintenance costs (i.e. membrane cleaning), and necessary post treatment, which make them unsuitable for application in developing countries.
Simple biological HD reactors that have been widely applied for cost-effective in treatment in developing countries include suspended growth reactors and attached growth reactors (such as fixed-bed reactors, packed bed reactors, immobilized reactors and so on). These systems have the advantages of being easy to operate and maintain, needing no skillful maintenance staff, and having low space requirements in terms of the attached growth reactor. Vasiliadou et al. (2009) developed a packed bed reactor to treat initial nitrate concentration of 80 mg/L, achieving a removal efficiency of 90% and a maximum removal capacity of 2260 g-N/m3/day. Similarly, a system proposed by Khanitchaidecha et al. (2012) achieved 96% efficiency under a hydrogen flow of 70 mL/min. Importantly, the large energy consumption involved using a continuous hydrogen supply, high cost of hydrogen, and risk of expelled hydrogen accumulation were significant limitations in these previous studies. Moreover, these systems feature drawbacks such as low denitrification efficiency and long retention time as compared with membrane reactors.
2.3.2 Hydrogen concentration
Hydrogen gas supply amount and dissolved hydrogen concentration significantly affect hydrogenotrophic denitrification performance. Hydrogen gas is an electron donor for hydrogenotrophic denitrifiers in the conversion of nitrate to harmless nitrogen gas. However, hydrogen gas characteristically has a low solubility, which causes high-energy consumption and high cost when hydrogen is used in the electron donor supply. Chang et al. (1999) reported that the dissolved hydrogen (DH) concentration should be at least 0.2 mg/L in order to avoid incomplete denitrification and nitrite accumulation in the system. The DH saturation in the 1.1-1.4 mg/L range has been found suitable to complete the denitrification reaction process which numerous prior reports (K A Karanasios et al. 2010; Eamrat et al. 2016; Eamrat et al. 2017). Khanitchaidecha & Kazama (2012) reported that the denitrification efficiency increased with hydrogen gas flow rate, and that a sufficient hydrogen supply (i.e., high flow rate) results in effective denitrification and manifests in the reactor as DH concentration at saturation. The nitrate removal efficiency can reach 90% under a 70 mL/min continuous hydrogen gas supply. According to prior reports, hydrogen gas and DH concentration are among the factors controlling the hydrogenotrophic denitrification process. Hydrogen gas limitations can inhibit the denitrification rate, which causes incomplete denitrification and high nitrite accumulation.
2.3.3 Temperature
Temperature is one factor that controls biological activity and system performance. The most suitable temperatures for hydrogenotrophic denitrification have been found range from 30 to 35 ℃. The denitrification rate increases with increased temperature from 25 to 35 ℃, and high nitrite accumulation is observed at temperatures below 25 ℃ (Zhou et al. 2007). Dawson & Murphy (1972) reported a reduction in biological activity associated with decreased temperature. Kurt et al. (1987) reported that the reaction rate doubled when temperature increased by 10 ℃ using observations from a fluidized-bed reactor (and based on the Arrhenius rate raw). Therefore, operating temperature has a significant affect on hydrogenotrophic denitrification performance and is the one of the critical process parameter in reactor design engineering. Svante Arrhenius proposed the
formula for the dependence of reaction rate on temperature. This equation can explain the effect of temperature on system performance and is shown in Eq. 2.8.
𝑘 = 𝐴𝑒−𝐸𝑎/(𝑅𝑇) (2.8) where k is the rate constant, A is the pre-exponential factor, Ea is the activation energy
for the reaction (J/mol), R is the universal gas constant (8.314 J/mol/K) and T is absolute temperature (K).
A modification of Eq. 2.8 incorporates the temperature coefficient, which is widely used in engineering design for biological process as shown in Eq. (2.9).
𝑘𝑇 = 𝑘20𝜃(𝑇−20) (2.9) where kT is the reaction rate coefficient at temperature T (℃), k20 is the reaction rate
coefficient at 20 ℃ , and 𝜃 is the temperature activity coefficient (Metcalf & Eddy, Tchobanoglous, George.Burton, Franklin L. Stensel 2003).
2.3.4 pH
According prior reports, the optimum condition for hydrogenotrophic denitrification was found to range from pH 7.6 - 8.6. A pH of lower than 7 causes decreased denitrification rates, while a pH of more than 8.6 causes high nitrite accumulation in the system. At low pH, carbon dioxide stripping and decomposition of carbonate ions can inhibit the removal rate. To avoid pH inhibition, pH adjustments using carbon dioxide and phosphate buffers were considered during the denitrification process (K.A. Karanasios et al. 2010).
2.3.5 Substrate concentration
High nitrate concentration inhibits system performance and encourages nitrite accumulation. Zhou et al. (2007) observed inhibition of the denitrification process at nitrate concentration of more than 30 mg/L. Moreover, I. A. Vasiliadou et al. (2006)
also demonstrated that the HD rate was inhibited at nitrate concentrations above 40 mg/L due to nitrite accumulation in the system.
2.4 Microbial community
Several research studies have investigated bacterial populations in hydrogenotrophic denitrification systems using both attached biofilms and suspended solids. The bacteria were isolated from HD reactors with mixed and pure cultures. These microorganisms must have the ability to utilize nitrate using inorganic carbon and hydrogen gas as electron donors. Prior reports indicate that most of the hydrogen-oxidizing denitrifiers belong to phylum Proteobacter (Chen et al. 2015; Eamrat et al. 2017; Wang et al. 2015).
Proteobacter consists of Betaproteobacteria, Alphaproteobacteria, and
Gammaproteobacteria. Mao et al. (2013) reported that hydrogenotrophic denitrifiers belong to Proteobacteria in the class Betaproteobacteria consist of Hydrogenophaga sp., Alcaligenes sp., and Rhodocyclus sp.. The Alphaproteobacteria class consists of Paracoccus denitrificans, and class Gammaproteobacteria consists of Pseudomonas sp., Aeromonas sp., Acinetobacter sp., and Shewanella sp. Classes Flavobacteria and Sphingobacteria have been reported in hydrogenotrophic denitrifier biofilm. However, the main interactions in the system are competition (in which various microorganisms utilize nitrate for self growth and nitrate removal, using inorganic carbon and hydrogen gas as electron donors) and synergy (in which microorganisms mutually use each other). Bacteria that have the ability to convert nitrate to nitrite, and then nitrite to nitrogen, have been found to coexist in HD systems (Chen et al. 2015).
2.5 Mathematic kinetic model expected of HD
Kinetic models of hydrogenotrophic denitrification have been reported recently in both mixed-culture and pure culture systems; models are commonly used to describe the mechanisms of denitrifying bacteria under substrate (nitrate and nitrite) and hydrogen gas. Kinetic modeling is important for bioreactor design, as it can describe biological performance (nitrate and nitrite removal rate), hydrogen gas, dissolved hydrogen gas, and biomass growth (K A Karanasios et al. 2010). Moreover, the kinetic model must be able to predict system safety and cost of operation. The mathematical model of hydrogenotrophic denitrification considers two denitrification steps: nitrate to nitrite and
nitrite to nitrogen. Monod models are commonly used to describe the nitrate and nitrite reduction rates and biomass generation in the hydrogenotrophic denitrification process. However, many modified Monod models, such as the double and two-step Monod models (Vasiliadou et al. 2009a; I.A. Vasiliadou et al. 2006), the Monod model with a switching function (Tiemeyer et al. 2007), and so on, have been developed to describe the two hydrogenotrophic denitrification processes. Therefore, the kinetic parameters of the Monod model, which are also important for Chapter 9, are explained below.
2.5.1 Evaluation of kinetic parameters in the Monod equation
Experimental data are used to identify kinetic parameters such as the specific growth rate (𝜇), maximum specific growth rate (𝜇𝑚𝑎𝑥), biomass yield (Y), half-saturation or Monod constant (Ks), and death rate constant (Kd), which are determined using the
Michaelis-Menten equation or Monod equation and a Lineweaver-Burk plot. The details of each parameter are described below.
The Monod equation is used to describe the relationship between the specific biomass growth rate and the growth limitation of the substrate concentration. The 𝜇𝑚𝑎𝑥 and Ks
parameters are attained via this equation.
𝜇 = 𝜇𝑚𝑎𝑥𝑆
𝐾𝑠+𝑆 (2.10)
where 𝜇 is the specific growth rate (1/hour), 𝜇𝑚𝑎𝑥 is the maximum specific growth rate (1/hour), S is the substrate concentration (mg/L) and Ks is the half-saturation constant
(mg/L).
Specific growth rate (𝜇) is the quantitative measurement of biomass generated per time under a given substrate concentration. During the log phase, biomass increases exponentially at the constant maximum rate, which is calculated based on biomass concentration per time as shown below.
𝑑𝑋
We can rewrite this equation in terms of the natural logarithm of biomass concentration versus time, in which case the slope of the equation is equal to the specific growth rate as shown in Eq. 2.12.
𝜇 = 𝑠𝑙𝑜𝑝𝑒 = ln (𝑋1− 𝑋2)
𝑡1− 𝑡2 (2.12)
The biomass yield coefficient (Y) indicates the amount of new biomass generated per unit of substrate utilized. The relationship between biomass generated and substrate consumed in term of mg of VS per mg of nitrate removal can be expressed by:
𝑑𝑋
𝑑𝑡 = 𝑌 ∙ (− 𝑑𝑆
𝑑𝑡) (2.13)
where X is the biomass concentration VS/L), S is the substrate concentration (mg-N/L), and Y is the yield coefficient (mg-VS/mg-N).
Using the Monod model, a simple model for biomass growth and substrate removal can be expressed in the balance of biomass and substrate as shown below.
For biomass balance:
𝑑𝑋
𝑑𝑡 = 𝜇𝑋 = 𝜇𝑚𝑎𝑥𝑆
𝐾𝑠+𝑆 𝑋 − 𝐾𝑑𝑋 (2.14)
For substrate balance:
𝑑𝑆 𝑑𝑡 = − 1 𝑌𝜇𝑋 = 𝜇𝑚𝑎𝑥𝑆 𝐾𝑠+𝑆 𝑋 − 𝐾𝑑𝑋 (2.15)
2.5.2 Evaluation of a modified Monod equation with a two-step reaction (Switching function)
In this section, a modified Monod model that considers denitrification in two steps is developed to predict total nitrogen removal via hydrogenotrophic denitrification. The modified Monod model can be expressed by the following equations.
For biomass balance: Nitrate (NO3-N)
The specific growth rate of nitrate with a substrate limitation
𝜇𝑁𝑂3−𝑁 = 𝜇𝑚𝑎𝑥,𝑁𝑂3−𝑁𝑆𝑁𝑂3−𝑁
𝐾𝑠,𝑁𝑂3−𝑁+ 𝑆𝑁𝑂3−𝑁 (2.16)
The biomass generation rate
𝑑𝑥𝑁𝑂3−𝑁
𝑑𝑡 = 𝜇𝑁𝑂3−𝑁𝑋 − 𝐾𝑑𝑋 (2.17)
where 𝜇𝑁𝑂3−𝑁 is the specific growth rate of nitrate (1/hour), 𝜇𝑚𝑎𝑥,𝑁𝑂3−𝑁 is the maximum specific growth rate of nitrate (1/hour), 𝑆𝑁𝑂3−𝑁 is the nitrate concentration (mg-N/L), 𝐾𝑠,𝑁𝑂3−𝑁 is the half-saturation constant of nitrate, X is the biomass concentration (mg-VS/L), and Kd is the death rate (1/hour).
For biomass balance: Nitrite (NO2-N) for the modified model
The specific growth rate of nitrite with a substrate limitation
𝜇𝑁𝑂2−𝑁 = 𝜇𝑚𝑎𝑥𝑆𝑁𝑂2−𝑁 𝐾𝑠,𝑁𝑂2−𝑁+ 𝑆𝑁𝑂2−𝑁 ∙ 𝐹𝑁𝑂3−𝑁 𝐹𝑁𝑂3−𝑁+ 𝑆𝑁𝑂3−𝑁 ∙ 𝑆𝑁𝑂3−𝑁 𝑆𝑁𝑂3−𝑁,𝐼𝑛 (2.18)
The biomass generation rate
𝑑𝑥𝑁𝑂2−𝑁
𝑑𝑡 = 𝜇𝑁𝑂2−𝑁𝑋 − 𝐾𝑑𝑋 (2.19)
where 𝜇𝑁𝑂2−𝑁 is the specific growth rate of nitrite (1/hour), 𝜇𝑚𝑎𝑥,𝑁𝑂2−𝑁 is the maximum specific growth rate of nitrite (1/hour), 𝑆𝑁𝑂2−𝑁 is the nitrite concentration (mg-N/L), 𝑆𝑁𝑂3−𝑁,𝐼𝑛 is 40 mg/L of initial nitrate concentration (mg-N/L), 𝐾𝑠,𝑁𝑂2−𝑁 is the half-saturation constant of nitrite, 𝐹𝑁𝑂3−𝑁 is the switch function (which follows observations of nitrite at low nitrate concentration), X is the biomass concentration (mg-VS/L), and Kd is the death rate (1/hour).
For substrate balance: Nitrate (NO3-N)
The cell-specific substrate uptake rate of nitrate
𝑞𝑁𝑂3−𝑁 = 𝜇𝑁𝑂3−𝑁
𝑌𝑁𝑂3−𝑁 (2.20)
The concentration of nitrate
𝑑𝐶𝑁𝑂3−𝑁