Study on Mass Transport inside PEMFCs by Simultaneous
Visualization
of
Oxygen-Partial-Pressure
and
Current-Density Distributions during Power Generation
A Doctoral Thesis
Presented to
Special Doctoral Program for Green Energy Conversion
Science and Technology
Interdisciplinary Graduate School of Medicine and Engineering
University of Yamanashi
March 2017
Contents
Chapter 1 General introduction
1.1. Background ... 1
1.2. Polymer electrolyte fuel cells (PEFCs) ... 2
1.3. Problems of PEFCs ... 4
1.4. Various visualization techniques of reaction distribution inside PEFCs ... 5
1.5. Objective ... 6
1.6. References ... 8
Chapter 2 Development of Novel Cells for Simultaneous Visualization of
Oxygen Partial Pressure and Current Density
2.1. Introduction ... 122.2. Principle of p(O2) visualization ... 13
2.3. 9-segmented see-through PEFC ... 16
2.3.1 Structure of a 9-segmented see-through PEFC ... 16
2.3.2. Visualization system for p(O2) and current density using a 9-segmented see-through PEFC ... 20
2.4. 78-segmented see-through PEFC ... 22
2.4.1. Structure of a 78 segmented see-through PEFC ... 22
2.4.2. Visualization system for p(O2) and current density using a 78-segmented see-through PEFC ... 26
2.6. Conclusions ... 30
Chapter 3 Visualization of Oxygen Partial Pressure under the
Single-serpentine Flow Channel and the Ribs in a
Polymer Electrolyte Membrane Fuel Cell during the
Power Generation
3.1. Introduction ... 33
3.2. Experimental setup ... 34
3.3. Results and Discussion ... 35
3.3.1. Distributions of p(O2) at different Uo2 ... 35
3.3.2. p(O2) under the channel and ribs ... 40
3.4. Conclusions ... 45
3.5. References ... 46
Chapter 4 Simultaneous Visualization of Oxygen Partial Pressure,
Current Density, and Water Droplets in Serpentine Fuel
Cell during Power Generation for Understanding Reaction
Distributions
4.1. Introduction ... 474.2. Experimental setup ... 48
4.3. Results and Discussion ... 49
4.3.1 Simultaneous visualization of p(O2) and current density at a higher temperature ... 49
4.3.2. Simultaneous visualization of p(O2), current density, and water droplets at a lower temperature ... 51
4.3.3. p(O2) and current density along GFC ... 55
4.4. Conclusions ... 58
Chapter 5 Performance of 78-segmented See-through PEFC for
Studying Mass Transport: Distribution of Oxygen Partial
Pressure and Current Density during Power Generation
5.1. Introduction ... 60
5.2. Experimental setup ... 61
5.3. Results and Discussion ... 62
5.3.1 Simultaneous visualization of p(O2) and current density at 90% RH ... 62
5.3.2. p(O2) and current density along GFC ... 65
5.4. Conclusions ... 67
5.5. References ... 68
Chapter 6 General Conclusions and Future Prospects
6.1 General conclusions ... 696.2 Future prospects ... 75
List of Publications ... 77
Meetings Abstracts ... 78
1
Chapter 1
General Introduction
1.1. Background
Present life and society are based on the consumption of a large amount of energy. The supply and demand of energy rely mostly on fossil fuels such as oil, coal and natural gas. The fossil fuels are finite, but the demands are expected to increase continuously because of the growth of the world population, the economic growth of developing countries and the improvement of living standards [1]. Huge use of fossil fuels has caused serious environmental problems such as the global warming and the atmospheric pollution. As a low emissions energy source, nuclear power generation has been used. However, after the Fukushima Daiichi nuclear disaster in 2011 in Japan, the safety of nuclear power generation was considered questionable. Therefore, renewable energy sources with zero emission and safety (solar, wind, hydroelectric and geothermal power generation etc.) are required. However, these sources do not stably produce energy and fit to the demand for the electric power due to unpredictable weather patterns. To mitigate this instability, the electricity is stored generally in battery, but the battery is not suitable for storing massive amount of electricity. In order to solve these problems, hydrogen has attracted attention as a promising energy carrier produced from electricity generated by the renewable energy sources. Hydrogen also can be produced from various resources; fossil fuels for reforming, byproducts in industrial processes, biomass and water for electrolysis [2]. This produced hydrogen is converted to electricity by using fuel cells.
Fuel cells are devices that covert the chemical energy into electricity through a reaction of oxygen with fuels. As a fuel, hydrogen is commonly used. Fuel cells were first conceptualized by Sir William Robert Grove in 1839. The fuel cells are typically classified into four types by electrolytes and operating temperatures they employ, such as polymer electrolyte fuel cells (PEFCs), solid oxide fuel cells (SOFCs), phosphoric
2
acid fuel cells (PAFCs) and molten carbonate fuel cells (MCFCs). Fuel cells have many advantages over the internal combustion engines currently used, such as highly efficiency, compactness and quietness. Research and development (R&D) of PEFCs and SOFCs are in active for vehicle and residential use, and these fuel cells have already been commercialized. In 2009, a residential co-generation fuel cell system named “ENE-FARM” was released by electronic manufacturers and gas companies. ENE-FARM simultaneously produces electricity and heat, resulting in the energy utilization ratio of 95%. Fuel cell vehicle (FCV) has started to sell under the name of “MIRAI” by Toyota Motor Corporation in 2014 and “CLARITY FUEL CELL” by Honda Motor Co., Ltd. in 2016. These FCVs also serve as power sources on wheels capable of supplying electricity for several days for an average household.
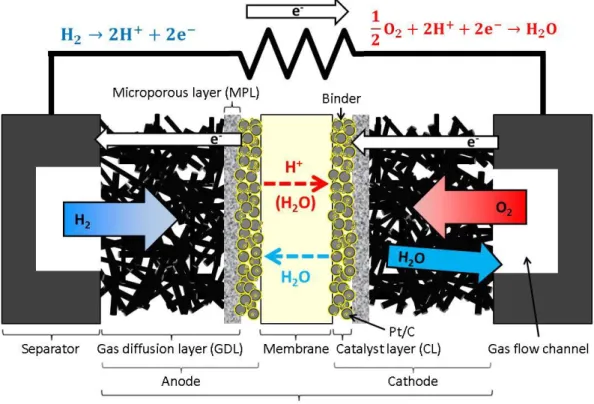
1.2. Polymer electrolyte fuel cells (PEFCs)
Of the different types of fuel cells, PEFCs most attract attentions and are actively researched because of their advantages, such as high-power density, low operating temperature, quick start-up and shut down and easy maintenance. PEFCs can be further distinguished into two types due to their operating temperatures; low operating temperature below 100 oC and high temperature over 100 oC. The operating temperature depends on the composition of the electrolyte membranes. Fig. 1-1 shows a schematic drawing of a PEFC. PEFC generally consists of two conductive separators with gas flow channels (GFCs) and a membrane electrode assembly (MEA) combined with a polymer electrolyte membrane (PEM), the two catalyst layers (CLs) and two gas diffusion layers (GDLs) at the anode and the cathode. There are two kinds of PEMs: proton and anion exchange membranes. Proton exchange membranes, perfluorosulfonated acid membranes such as Nafion® (E. I. Du Pont Nemours & Company, Inc.) as an example, are widely used due to their high proton conductivity and mechanical stability at various temperatures and humidities. Anion exchange membranes are also actively studied as viable alternatives to proton exchange membranes in recent year, due to the possible usability of less expensive non precious metal catalysts mainly because of the anti-dissolution properties and the faster oxygen
3
reduction reaction (ORR) in alkaline environments than in acidic environments. The CL is generally composed of electrocatalyst (highly distributed Pt-based nanoparticle supported on carbon black (Pt/C) with highly surface area) covered with thin layers of electrolyte ionomers as ion conductive binders. GDL is a porous material typically consisting of a macroporous fibrous backing material (carbon fiber paper) and a microporous-layer (MPL) containing polytetrafluoroethylene (PTFE). The GDL has important roles for the water management, the electronic connection between the separator and the electrode, the mechanical support for MEAs, and the protection of catalyst layers from the corrosion or the erosion caused by gas/water flows and other factors [3]. The GCF fabricated on separators works for the supply of the reactant gases to the CL and the removal of generated water. There are various types of GFC designs; parallel, serpentine, interdigitated and bio-inspired [4]. In the PEFCs, Hydrogen and oxygen (or air) are supplied to the CLs through the GFCs and the GDLs at the anode and the cathode, respectively. During the cell operation, the hydrogen oxidation reaction (HOR) and the ORR occur at the anode (Eq. 1) and the cathode (Eq. 2), respectively, and H2O is generated at the cathode (Eq. 3).
Anode : H2 → 2H++ 2e− (Eq. 1) Cathode : 12O2+ 2H++ 2e− → H2O (Eq. 2) Overall reaction : H2+12O2 → H2O (Eq. 3)
Protons and electrons from hydrogen generated on the triple phase boundary, where contact ionomers, reactants and catalysts, move to the cathode through the membrane and external circuit, respectively. Then, oxygen, protons and electrons react and produce water on the triple phase boundary. The generated water is partially incorporated into the membrane by the back-diffusion from the cathode to the anode by the gradient of the water concentration inside the MEA. The equilibrium cell voltage of a single PEFC defined by the Nernst equation is 1.23 V at the standard ambient temperature and pressure (25 oC, 100 kPa), but the actual voltage of a single cell is lower due to the
4
overpotentials both at the anode and cathode, such activation, ohmic and concentration overpotentials. Practically, several hundreds of single cells are stacked in series to produce the desired level of electric power.
Fig. 1-1 Schematic drawing of a PEFC
1.3. Problems of PEFCs
The PEFCs have already been commercialized with many advantages over other fuel cells, but higher cell performance/durability and cost reduction are still needed for the wider use of PEFCs. The Ministry of Economy, Trade and Industry (METI) of Japan has set a target of 40,000 FCVs, 1.4 million co-generation FCs and 160 hydrogen stations (80 operated in March, 2017) by 2020 on its roadmap [5]. The METI has also set a price target of 800,000 yen for the co-generation FCs by 2019. To achieve these goals, the R&Ds are in progress in the fields of the improvement and optimization of the MEA components (CL, PEM, GDL), the cell design (separator and GCF structures) and the operating conditions (temperature, humidification, start/stop processes, load cycles and impurities in the fuel and air). Since the cost of the PEM and the Pt-based catalysts
5
accounts for a large portion in the total FCV cost [6], inexpensive materials and reducing their usage, while keeping or improving the performance and durability, are required. Improvement and optimization of the GFC design and the water management [7] are also important to further increase the cell performance and durability, because the effective gas supply could eventually increase the drainage of the excess liquid water, which could block the gas diffusion infilling the CL and the GDL. Meanwhile, the deficient water decreases the proton conductivity of PEMs, resulting a significant degradation of the cell performance. In addition, the durability of the CLs decreases under the load cycles and start/stop processes [8]. The corrosion of the carbon support at high electrode potentials causes the agglomeration and detachment of Pt catalyst accompanying by the cell performance loss.
1.4. Various visualization techniques of reaction distributions inside PEFCs
Various reactions occur inside a PEFC during the operation. These reactions may generate inhomogeneous distributions of the power generation, which could cause a lower cell performance and durability. Therefore, it is essentially important to reveal the distributions of chemical (O2, H2, H2O, CO2, H2O2, etc.) and physical (temperature, current density, gas flux, pressure etc.) parameters inside a PEFC during the power generation. In order to achieve these demands for the cell diagnosis, various in situ and
operando measurement techniques, including visualizations, have been proposed.
Among those parameters, liquid water have been actively studied in the MEA and the GFCs by direct optical observation [9-12], X-ray imaging [13-16], neutron imaging [17-24] and magnetic resonance imaging [25-27]. The water distribution inside PEM has also been reported by using Raman spectroscopy [28]. These studies revealed that the reaction distributions are greatly influenced by the generated liquid water in PEFCs. The distribution of current density at the MEA has also been actively measured for optimizing the operating conditions and designing MEAs and cells by using segmented current collectors [18,29-37] or magnetotomography [38,39]. These obtained results also exhibit a better understanding of the water transport mechanism inside a PEFC, because the mechanism is related to the transport of electrons, protons, reactants and
6
products. The geometry of the GFCs and ribs is one of the major factors influencing the reaction distribution, because of the effects not only on the gas diffusivity and the formation of liquid water [13,14,17,18,29,30,40] but also on the electron transport resistance [41,42] and the heat transfer [43,44] particularly under the wet condition. The temperatures inside the MEAs have been measured by a black-body radiation [45], thermoelectric sensors [46] and optical fiber temperature sensors [47]. Temperature affects nearly all chemical kinetics and mass transport mechanisms in a PEFC. The power generation, the membrane conductivity and the water diffusivity, are highly dependent upon the temperature as well. The degradation mechanism of carbon supports during start/stop cycles has also been investigated by the visualization of CO2 [48] and the measurement of internal current at the cathode using a segmented cell [49]. CO2 visualization detects and quantifies the amount of carbon corrosion and the corroded areas. By the internal current measurement, it was found that a segmented cell exposed to air for a long time was most degraded by the carbon corrosion. For the improvement of PEFCs, one of the most important parameters is the oxygen partial pressure (p(O2)).
p(O2) is influenced by the consumption of oxygen for the power generation, generated liquid and gaseous water, the cross flow through the GDL and the internal pressure. Visualization of the p(O2) distribution has been performed by using an oxygen-sensitive dye film both on the upper GFCs and the GDLs [11,50-55]. The oxygen concentration and presence of liquid water inside the GDL was measured by an oxygen micro-sensor with a micro-positioning system in operating PEFCs [56]. Additionally, these parameters are numerically simulated to elucidate the transport phenomena with various cell components and under different operating conditions [53,55]. The simulated data have been commonly compared with the experimental data. Besides the visualizations of individual parameters, the combination of multiple parameters gives rich and precise information.
1.5. Objective
As described above, the visualization of the reaction distributions inside a PEFC gives us invaluable information. The visualization of p(O2) with serpentine and straight
7
GFCs have been studied mainly in the University of Yamanashi. However, many parameters at the catalyst layer is still not clear. The combination of chemical/physical parameters is helpful in understanding the materials transport derived by the reaction distributions inside a cell. In this thesis, the visualization of p(O2) and the current density is simultaneously carried out using newly developed segmented see-through PEFCs. This thesis consists of six chapters. In Chapter 2, the details of the newly-developed segmented see-through PEFCs and the visualization system setups are explained. In Chapter 3, the visualization of the p(O2) distribution at the surface of the GDL both under the GFC and the ribs using a developed 9-segmented see-through PEFC was carried out in a running PEFC. The performance and the effectiveness of the 9-segmented p(O2) visualization system were confirmed, and the differences between under the GFC and the ribs are discussed. In Chapter 4, p(O2), current density, and water droplets were visualized simultaneously inside a PEFC using a 9-segmented see-through PEFC with different temperatures for understanding the reaction distributions. In Chapter 5, the 78-segmented see-through PEFC performance was examined by visualizing the distribution of p(O2) and current density. Finally, in Chapter 6, some representative results are summarized and the future prospects are overviewed.
8
1.6. References
[1] INTERNATIONAL ENERGY OUTLOOK 2016 published by U.S. Energy
Information Administration (EIA): https://www.eia.gov/outlooks/ieo/world.cfm [2] Hydrogen energy white paper published by New Energy and Industrial
Technology Development Organization (NEDO) :
http://www.nedo.go.jp/library/suiso_ne_hakusyo.html
[3] S. Park, J.W. Lee, B.N. Popov, Int. J. Hydro. Energy 37 (2012) 5850-5865.
[4] B.H. Lim, E.H. Majlan, W.R.W. Daud, T. Husaini, M.I. Rosli, Ionics 22 (2016) 301-316.
[5] The Strategic Roadmap for Hydrogen and Fuel Cells published by the Ministry of
Economy, Trade and Industry (METI):
http://www.meti.go.jp/press/2015/03/20160322009/20160322009.html
[6] Fuel Cell System Cost – 2015 published by the United States Department of
Energy (DOE):
https://www.hydrogen.energy.gov/program_records.html#fuel_cells
[7] H. Li, Y. Tang, Z. Wang, Z. Shi, S. Wu, D. Songa, J. Zhang, K. Fatih, J. Zhang, H. Wang, Z. Liu, R. Abouatallah, A. Mazza J. Power Sources 178 (2008) 103-117. [8] S. Zhang, X.Zi. Yuan, J.Ng.C. Hin, H. Wang, K.A. Friedrich, M. Schulze, J.
Power Sources 194 (2009) 588-600.
[9] K. Tüber, D. P ocza, C. Hebling, J. Power Sources 124 (2003) 403-414.
[10] K. Sugiura, M. Nakata, T. Yodo, Y. Nishiguchi, M. Yamauchi, Y. Itoh, J. Power Sources 145 (2005) 526-533.
[11] K. Takada, Y. Ishigami, J. Inukai, Y. Nagumo, H. Takano, H. Nishide, M. Watanabe, J. Power Sources 196 (2011) 2635-2639.
[12] K. Takada, Y. Ishigami, S. Hirakata, M. Uchida, Y. Nagumo, J. Inukai, H. Nishide, M. Watanabe, Electrochemistry 79 (2011) 388-391.
[13] P. Deevanhxay, T. Sasabe, S. Tsushima, S. Hirai, Int. J. Hydrogen Energy 36 (2011) 10901-10907.
[14] J. Eller, J. Roth, F. Marone, M. Stampanoni, A. Wokaun, F.N. Büchi, J. Power Sources 245 (2014) 796-800.
9
[15] P.K. Sinha, P.P. Mukherjee, C.-Y. Wang, J. Mater. Chem. 17 (2007) 3089-3103. [16] J. Lee, J. Hinebaugh, A. Bazylak, J. Power Sources 227 (2013) 123-130.
[17] A. Turhan, K. Heller, J.S. Brenizer, M.M. Mench, J. Power Sources 180 (2008) 773-783.
[18] I.A. Schneider, S. von Dahlen, M.H. Bayer, P. Boillat, M. Hildebrandt, E.H. Lehmann, P. Oberholzer, G.G. Scherer, A. Wokaun, J. Phys. Chem. C 114 (2010) 11998-12002.
[19] J.P. Owejan, T. A. Trabold, and M. M. Mench,Int. J. Heat and Mass Transfer 71 (2014) 585 -592.
[20] M.A. Hickner, N.P. Siegel, K.S. Chen, D.N. McBrayer, D.S. Hussey, D.L. Jacobson, M. Arif, J. Electrochem. Soc. 153 (2006) A902-A908.
[21] A. Turhan, K. Heller, J.S. Brenizer, M.M. Mench, J. Power Sources 180 (2008) 773-783.
[22] M.A. Hickner, N.P. Siegel, K.S. Chen, D.S. Hussey, D.L. Jacobson, M. Arif, J. Electrochem. Soc. 155 (2008) B294-B302.
[23] H. Murakawa, T. Ueda, T. Yoshida, K. Sugimoto, H. Asano, N. Takenaka, K. Mochiki, H. Iikura, R. Yasuda, M. Matsubayashi, Nucl. Instrum. Meth. A 605 (2009) 127-130.
[24] P. Oberholzer, P. Boillat, A. Kaestner, E.H. Lehmann, G.G. Scherer, T.J. Schmidt, A. Wokaun, J. Electrochem. Soc. 160 (2013) F659-F669.
[25] S. Tsushima, K. Teranishi, S. Hirai, Electrochem. Solid-State Lett. 7 (2004) A269-A272.
[26] K.W. Feindel, S.H. Bergens, R.E. Wasylishen, Phys. Chem. Chem. Phys. 9 (2007) 1850-1857.
[27] S. Tsushima, T. Nanjo, S. Hirai, ECS Trans. 11 (2007) 435-443.
[28] M. Hara, J. Inukai, B. Bae, T. Hoshi, K. Miyatake, M. Uchida, H. Uchida, M. Watanabe, Electrochim. Acta 82 (2012) 277-283.
[29] U.N. Shrivastava, K. Tajiri, M. Chase, J. Power Sources 299 (2015) 189-194. [30] U.N. Shrivastava, K. Tajiri, J. Electrochem. Soc. 163 (2016) F1072-F1083.
10
28 (1998) 663-672.
[32] J. Stumper, S.A. Campbell, D.P. Wilkinson, M.C. Johnson, M. Davis, Electrochim. Acta 43 (1998) 3773-3783.
[33] Ch. Wieser, A. Helmbold, E. Gülzow, J. Appl. Electrochem. 30 (2000) 803-807. [34] M.M. Mench, C.Y. Wang, M. Ishikawa, J. Electrochem. Soc. 150 (2003)
A1052-A1059.
[35] M. Noponen, J. Ihonen, A. Lundblad, G. Lindbergh, J. Appl. Electrochem. 34 (2004) 255-262.
[36] F.N. Büchi, A.B. Geiger, R.P. Neto, J. Power Sources 145 (2005) 62-67.
[37] T.V. Reshetenko, A. Kulikovsky, J. Electrochem. Soc. 163 (2016) F1100-F1106. [38] J.R. Claycomb, A. Brazdeikis, M. Le, R. A. Yarbrough, G. Gogoshin, and J. H.
Miller, IEEE Trans. Appl. Supercond. 13 (2003) 211-214.
[39] H. Lustfeld, M. Reißel, B. Steffen, J. Fuel Cell Sci. Technol. 4 (2009) 474-481.
[40] D. Natarajan, T.V. Nguyen, J. Power Sources 115 (2003) 66-80. [41] P.C. Sui, N. Djilali, J. Power Sources 161 (2006) 294-300.
[42] H. Butsch, C. Roth, D. Ritzinger, G. Hoogers, A. Bock, J. Electrochem. Soc. 159 (2012) B709-B713.
[43] E.F. Medici, J.S. Allen, Int. J. Heat Mass Transfer 65 (2013) 779-788. [44] J.G. Pharoah, O.S. Burheim, J. Power Sources 195 (2010) 5235-5245.
[45] A. Hakenjos, H. Muenter, U. Wittsstadt, C. Hebling, J. Power Sources 131 (2004) 213-216.
[46] G. Zhang, L. Guo, L. Ma, H. Liu, J. Power Sources 195 (2010) 3597-3604. [47] K. Inman, X. Wang, J. Electrochem. Soc. 160 (2013) F496-F500.
[48] Y. Ishigami, I. Maeda, K. Takada, T. Hyakutake, T. Suga, J. Inukai, M. Uchida, Y. Nagumo, H. Nishide, M. Watanabe, Electrochem. Solid-State Lett. 15 (2012) B51-B53.
[49] A. Lamibrac, G. Maranzana, O. Lottin, J. Dillet, J. Mainka, S. Didierjean, A. Thomas, C. Moyne, J. Power Sources 196 (2011) 9451-9458.
11
[50] J. Inukai, K. Miyatake, K. Takada, M. Watanabe, T. Hyakutake, H. Nishide, Y. Nagumo, M. Watanabe, M. Aoki, H. Takano, Angew. Chem. Int. Ed. 47 (2008) 2792-2795.
[51] Y. Ishigami, K. Takada, H. Yano, J. Inukai, M. Uchida, Y. Nagumo, T. Hyakutake, H. Nishide, M. Watanabe, J. Power Sources 196 (2011) 3003-3008.
[52] T. Hyakutake, Y. Ishigami, J. Kato, J. Inukai, K. Miyatake, H. Nishide, M. Watanabe, Macromol. Chem. Phys. 212 (2011) 42-47.
[53] Y. Ishigami, W. Waskitoaji, M. Yoneda, K. Takada, T. Hyakutake, T. Suga, M. Uchida, Y. Nagumo, J. Inukai, H. Nishide, M. Watanabe, J. Power Sources 269 (2014) 556-564.
[54] K. Nagase, T. Suga, Y. Nagumo, M. Uchida, J. Inukai, H. Nishide, M. Watanabe, J. Power Sources 273 (2015) 873 –877.
[55] K. Nagase, H. Motegi, M. Yoneda, Y. Nagumo, T. Suga, M. Uchida, J. Inukai, H. Nishide, M. Watanabe, ChemElectroChem 2 (2015) 1495-1501.
12
Chapter 2
Development of Novel Cells for Simultaneous
Visualization of Oxygen Partial Pressure and
Current Density
2.1. Introduction
Operando visualizations of the distributions of multiple chemical/physical parameters inside a PEFC during the power generation are important to elucidate the reaction distributions as described in Chapter 1. New visualization systems allowing the simultaneous visualization of p(O2), current density and liquid water were developed prior to the measurements. In this chapter, the developed visualization systems are explained.
The new systems enable us to simultaneously measure the p(O2) and current density distributions during the operation by employing segmented current collectors. The concept of the visualization systems of p(O2) on the upper GFC and the GDL having been developed at the University of Yamanashi [1] was fully employed. The current correctors at the cathode, therefore, were embedded in the transparent window as in the previous see-through cells.
First, a see-through PEFC with 9 segmented current collectors was developed, and then was a see-through PEFC with 78 segmented current collectors for more accurate measurements. These two see-through PEFCs are explained in this chapter.
13
2.2. Principle of p(O2) visualization
As an oxygen sensor, a luminescent porphyrin dye film ([tetrakis(pentafluorophenyl)porphyrinato]platinum (PtTFPP) (Fig.2-1 (a)) + poly(1-trimethylsilyl-1-propyne) (pTMSP) (Fig. 2-1 (b)), 5 wt%) was used to visualize
p(O2) [2,32]. PtTFPP absorbs blue light (ca. 400 nm) and emits red light (ca. 650 nm)
(Fig. 2-2). pTMSP is a matrix with high oxygen permeability, compatibility with the dye, good film forming, and stability under the fuel-cell operating conditions. 5 wt% PtTFPP with respect to pTMSP was mixed in toluene (Fig. 2-1 (c)). The dye was spray-coated uniformly with a thickness of 2 µm on the GDL surface at the cathode [1,4,5]. Fig. 2-3 shows the photographs with (a) and without (b) a dye on the GDL surface. Without a dye, carbon fibers with diameters of 5-20 m were clearly seen. The pore sizes varied from several micrometers to several hundreds of micrometers. Accordingly, the surface was not flat but with many pores with different sizes. With a dye film of an average thickness of 2 m, the film covered the carbon fibers and was not easily detected with a microscope as in Fig. 2-3(b). In some locations indicated by red circles, the accumulation of the dye as spheres was seen but not occasionally. Therefore, the influence of the dye coating of the GDL surface on the gas diffusivity of the GDL is expected to be negligibly small. The emission intensity from the dye film corresponds to
p(O2) around PtTFPP, and the intensity lowers as p(O2) increases. The change in the
emission intensity as a function of the temperature was very small (ca. 0.5% K-1) and the influence of humidity was negligible [6]. The luminescent life time of PtTFPP is 120
s [xx], and the oxygen permeability coefficient of pTMSP is 13,000 cm3(STP)cm cm-2 s-1 cmHg-1 [7]. Therefore, the approximate time resolution of the dye film for the oxygen detection is estimated to be 1 ms. In this way, p(O2) was accurately quantified with the new system.
14
Fig.2-1 Chemical structures of [tetrakis(pentafluorophenyl)porphyrinato]platinum (PtTFPP) (a) and poly(1-trimethylsilyl-1-propyne) (pTMSP) (b). Photograph of a dye solution mixed with PtTFPP and pTMSP in toluene (c).
15
Fig. 2-3 Photograph of the surface of the GDL (25BCH) with (a) and without (b) a dye film.
16
2.3. 9-segmented see-through PEFC
2.3.1 Structure of a 9-segmented see-through PEFC
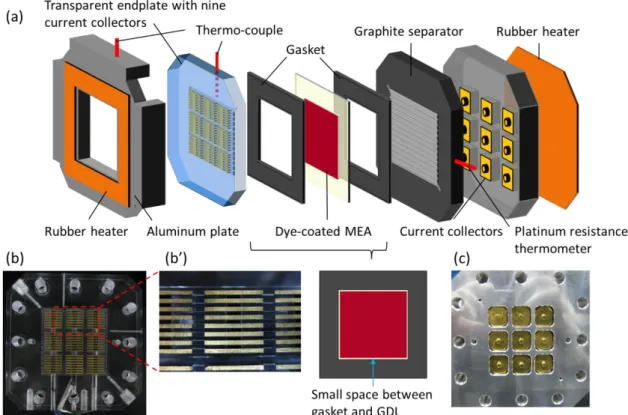
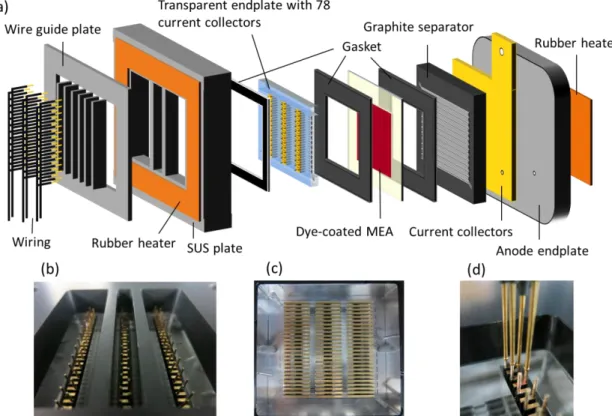
Fig. 2-4(a) schematically shows the new segmented see-through PEFC. In order to look through the cell, a cathode endplate (110 x 110 mm x 25 mm in thickness), identical to that of the Japan Automobile Research Institute (JARI) standard cell, was made of a transparent acrylic resin (Fig. 2-4(b)) [1]. For this single cell, nine segmented
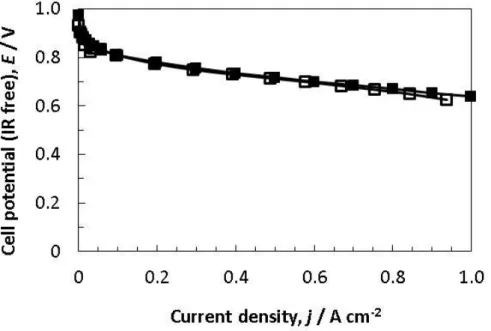
current collectors (14 mm x 15 mm) were equipped with, both at the cathode (Fig. 2-4(b)) and the anode (Fig. 2-4(c)), and the current density was measured at each collector [8-10]. The cathode transparent endplate was dipicted in Fig. 2-5(a). Current collectors and an aluminum endplate at the anode were isolated by using Kapton® tapes. Between the copper ribs plated with gold (14 mm in length, 1 mm in width), the ribs were made of acrylic resin(3 mm in length, 1 mm in width) (Fig. 2-4(b’)), so the GDL surface was able to be seen through the transparent ribs. Therefore, p(O2) was detected not only on the GDL under the GFC but also under the transparent ribs. The potentials of the current collectors were controlled to be the same by the external circuit so that the nine current collectors could be regarded as a single current collector. The anode separator was made of resin-impregnated isotropic graphite. The cathode endplate and the anode separator have a single serpentine GFC (channel length = 1430 mm, rib width = 1 mm, channel width = 1 mm, channel depth = 1 mm, 26 curves). The counter-flow arrangement (Fig. 2-5) was taken for the gas flows. To control the operating temperature, the cathode acrylic endplate, which has a low thermal conductivity, was covered by an aluminum plate and heated by a rubber heater. Thermocouples were inserted both inside the cathode acrylic endplate and the anode separator (Fig. 2-4(a)). The area of the visualization window was 56 mm x 56 mm. Between gaskets (54.5 mm x 54.5 mm) and the dye-coated GDL (54.0 mm x 54.0 mm) a small space inevitably existed (Fig.2-4 (a)). The cell was fastened with M6 bolts at the pressure of 10 kgf cm-2. The cell performance of the 9-segmented see-through PEFC with a dye coated on the GDL was nearly identical to that of the JARI standard cell as shown in Fig. 2-6 at current densities lower than 800 mA cm-2. In this study, the highest current density at a collector was 570 mA cm-2, so the influence of the cell structure should be small on the distribution of
17
current density.
Fig. 2-4 Schematic drawing of a 9-segmented see-through PEFC (a), photographic view of the cathode side with a transparent acrylic plate (b), embedded metal ribs for the current collections (b’), and photographic view of the anode side with nine current collectors (c). Transparent acrylic ribs exist between the metal ribs.
18
Fig. 2-5 Schematic drawing of the cathode transparent endplate: front view (a), back view (b), embedded metal ribs for the current collections (b’) and overall view (c).
19
Fig. 2-6 I-E curves obtained using a 9-segmented see-through PEFC with a dye on the GDL (open squares) and using a JARI standard cell (filled squares). Cell temperature = 80 °C; relative humidity = 100% RH; gas utilization of the anode and the cathode = 70% and 40%, respectively.
20
2.3.2. Visualization system for p(O2) and current density using a 9-segmented see-through PEFC
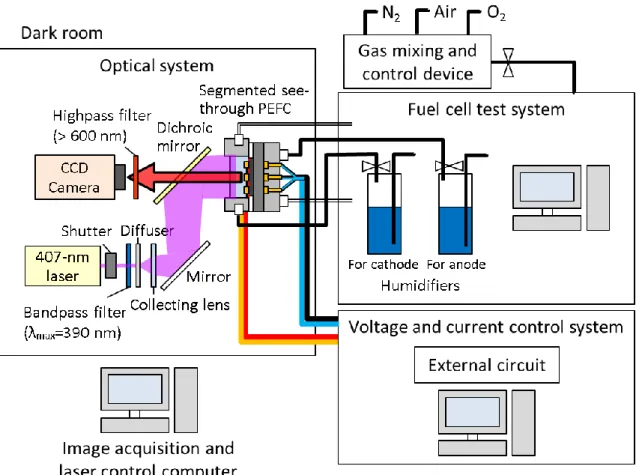
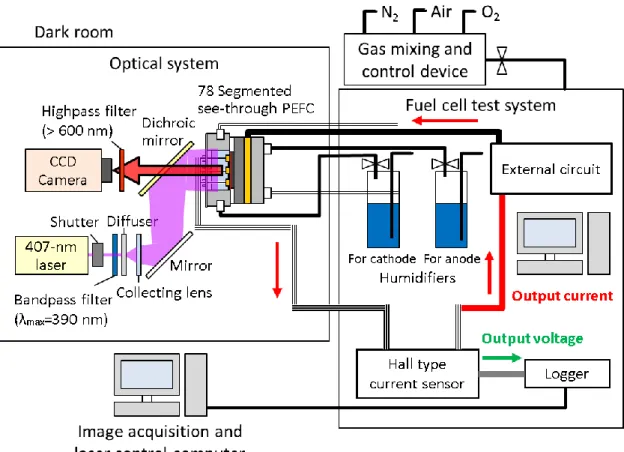
Fig. 2-7 shows a schematic diagram of the visualization system for p(O2) and current density using a 9-segmented see-through PEFC. In a dark room, the excitation light from a 407-nm laser was filtered (λmax = 390 nm), diffused, spread, and distributed uniformly onto the cell at the cathode. The emission from the dye on the MEA was filtered (>600 nm) and captured with a CCD camera (500 pixels x 500 pixels, 1 pixel = approximately 120µm x 120 µm, Hamamatsu Photonics K.K.). The shutter for the irradiation was controlled by a computer placed out of the dark room. For decreasing the stray light, reflecting materials of the cell were masked in black. With this visualization system of p(O2), liquid water is able to be detected as previously reported because of the light scattering by water inside cells [4,11,12]
The voltage and the current were controlled by using an external circuit. The voltages at all current collectors were continuously measured, while the current at each collector was continuously and simultaneously increased/decreased so that the voltages at all collectors became identical. This process took time. When the current density was changed, it took approximately 30 s for the voltage of the nine collectors to be stabilized.
The cell temperature and the gas flow rates were controlled by using a fuel-cell test system (Panasonic Production Engineering Co., Ltd). For obtaining calibration curves (Section 2.5), a gas-mixture device was connected to the fuel cell, and gas mixtures of oxygen and nitrogen or air and nitrogen were provided to both the anode and the cathode.
21
Fig. 2-7 Schematic diagram of the visualization system for p(O2) and current density using a 9-segmented see-through PEFC.
22
2.4. 78-segmented see-through PEFC
2.4.1. Structure of a 78-segmented see-through PEFC
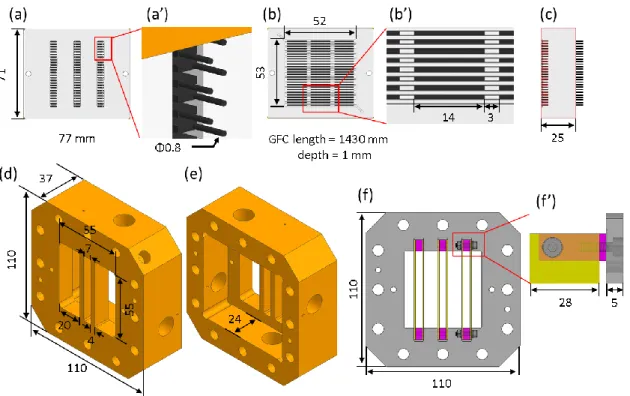
In order to measure the current density more accurately, a see-through PEFC was modified based on the design of and the results with the 9-segmented see-through PEFC. Fig. 2-8(a) schematically shows the new 78-segmented see-through PEFC. Basic concept is the same as that of the 9-segmented see-through PEFC; transparent window was used at the cathode in order to capture the emission from the dye film. Changes are (i) transparent material and size, (ii) number of segments at the cathode and (iii) current sensors. (i): the transparent acrylic resin used for the 9-segmented see-through PEFC was deformable during a long and high-temperature operation (ca. 80 oC). Therefore, a transparent cycloolefin polymer, ZEONEX®480R (Zeon Corporation) with a high thermal resistance and transparency, was used as a cathode plate. In addition, the cathode-plate size was changed small (77 mm x 71 mm and 25 mm in thickness) as shown in Fig. 2-9(a). The SUS endplate had a deformation-preventive structure at the center (Fig. 2-8(b) and 2-9(b)). (ii): the number of current collector segments at the cathode was increased from 9 to 78. These current collectors were placed at the ribs (26 vertical x 3 horizontal current collectors = 78 current collectors in total). Except copper ribs plated with gold (14 mm in length, 1 mm in width), the endplate was partially transparent, and p(O2) was able to be visualized also under the ribs at those transparent locations as with the 9-segmented see-through PEFC. (iii): With the sleeve wires inserted ((Fig. 2-8(d)), all segments were connected to Hall-effect sensors (CYS5-02, NANA ENGINEERING CO., LTD.). The output voltages were recorded by an external logger (Memory HiLogger (8423)) and a voltage/temperature measuring unit (8948)), HIOKI E.E. CORPORATION). In order to secure the visualization area, a wire-guide plate was located on the current collectors. The GFC geometry was of a single serpentine as was in the case for the 9-segmented see-through PEFC. The anode structure of a JARI standard cell was employed for that of the see-through PEFC. The cell was fastened with M6 bolts (10 kgf cm-2). The cell performance of the 78-segmented see-through PEFC with dye coating was nearly identical to that of a JARI standard cell as shown in Fig. 2-10.
23
Fig. 2-8 Schematic drawing of a 78-segmented see-through PEFC (a), photographic view of the frontal cathode transparent plate with a SUS plate (b), 78 current collectors at the cathode (c), and inserted sleeve wires (d).
24
Fig. 2-9 Schematic drawing of cell components. Front view of a cathode transparent plate (a), embedded current collectors (a’), back view (b), embedded metal ribs for the current collections (b’), side view (c), front view of an SUS endplate (d), back view of an SUS endplate (e), front view of a wire guide plate (f) and side view of a wire guide plate (f’)
25
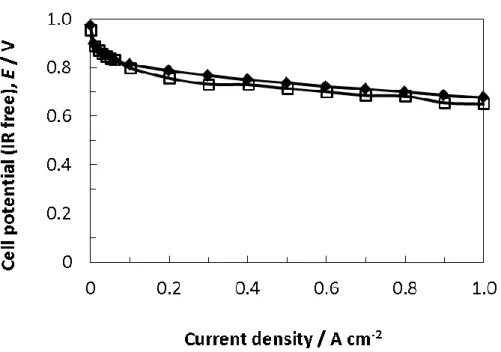
Fig. 2-10 I-E curves obtained using a 78-segmented see through PEFC with a dye on the GDL (open squares) and a JARI standard cell (filled squares). Cell temperature = 80 °C; relative humidity = 100% RH; gas utilization of the anode and the cathode = 70% and 40%, respectively.
26
2.4.2. Visualization system for p(O2) and current density using a 78-segmented see-through PEFC
Fig. 2-11 shows a schematic diagram of the visualization system for p(O2) and current density using a 78-segmented see-through PEFC. The optical system for visualizing p(O2) in a dark room was the same as that described in 2.3.2. Electric load, cell temperature and flow rates were controlled by using a fuel-cell test system. The Hall-effect sensor was connected to an external circuit, a logger and to the cell. The Hall-effect sensor is a current transducer; a magnetic flux density passing through a Hall element determines the output voltage from the sensor, which is proportional to the current from the cell [13-15]. The Hall sensors have a sensitivity of 1.33±0.04 mA mV-1. The output voltage is 1.0-4.0 V ±0.05 V and the temperature drift is ±0.1% °C-1. The offset voltage drifted up to ±2 mV °C-1. The logger was operated by a computer located out of the dark room. This computer was used to control a CCD camera and the logger at the same time. This system has a time resolution of 100 ms.
27
Fig. 2-11 Schematic diagram of the visualization system for p(O2) and current density using a 78 segmented see-through PEFC.
28
2.5. Acquisition of calibration curves for p(O2)
To obtain calibration curves before the cell operation, the cell was fully purged by supplying gas mixtures with various oxygen concentrations (0-25%) at the gas flow rate of 500 ml min-1 both in the anode and the cathode at the operating temperatures and humidities under the ambient pressure. Stern–Volmer plots were acquired by decreasing the gas flow rate of 50 ml min-1 to minimize the pressure loss [1,4-6,11,16]. The laser was irradiated onto the cell only during the acquisition of images by a CCD camera. Time required to obtain one image for the calibration was 100-3000 ms depending on the emission intensity. At each condition, the exposure time was set 60 s, and the images taken in the period were averaged. The background images were captured with the laser off, and the back ground signals were computationally eliminated using those images. Fig. 2-12 (a) shows the emission intensity in different p(O2). Fig. 2-12 (b) shows the Stern-Volmer plot obtained by using the data in Fig. 2-12 (a), where Iref is the emission intensity at p(O2)ref, or the p(O2) in air. The emission images were then converted to the p(O2) images by using the Stern–Volmer plots at each pixel.
29
Fig. 2-12 Emission intensity in different p(O2) (a) and Stern-Volmer plot (b). The emission intensity, I, was measured with different p(O2). Iref is the emission intensity at
30
2.6. Conclusions
New experimental apparatuses were developed for the simultaneous visualization of
p(O2), current density and liquid water. The visualization system of a 9-segmented
see-through PEFC consists of three systems: optical system, fuel cell eveluation system and voltage and current control system. A developed segmented see-through PEFC has nine segmented current collectors, which enable to measure the distribution of current density. An oxygen-sensitive dye film on the GDL enabled to visualize the p(O2) distribution. It was confiremed that the cell performance of the see-through PEFC with dye coating was nearly identical to that of the JARI standard cell. In order to measure the current density more accurately, a 78-segmented see-through PEFC was developed based on the 9-segmented see-through PEFC. Main differences are in the transparent material and size, the increase of the number of segments at the cathode and the Hall-effect sensors for measuring the current density. These newly developed cells allowed to elucidate the reaction distribution inside a PEFC during the operation.
The experimental results obtained by the 9-segmented see-through PEFC are described in Chapters 3 and 4 and those by the 78-segmented see-through PEFC in Chapter 5.
31
2.7. References
[1] Y. Ishigami, W. Waskitoaji, M. Yoneda, K. Takada, T. Hyakutake, T. Suga, M. Uchida, Y. Nagumo, J. Inukai, H. Nishide, M. Watanabe, J. Power Sources 269 (2014) 556-564.
[2] T. Hyakutake, H. Taguchi, J. Kato, H. Nishide, M. Watanabe, Macromol. Chem. Phys. 210 (2009) 1230-1234.
[3] T. Hyakutake, Y. Ishigami, J. Kato, J. Inukai, K. Miyatake, H. Nishide, M. Watanabe, Macromol. Chem. Phys. 212 (2011) 42-47.
[4] K. Nagase, T. Suga, Y. Nagumo, M. Uchida, J. Inukai, H. Nishide, M. Watanabe, J. Power Sources 273 (2015) 873 –877
[5] K. Nagase, H. Motegi, M. Yoneda, Y. Nagumo, T. Suga, M. Uchida, J. Inukai, H. Nishide, M. Watanabe, ChemElectroChem, 2 (2015) 1495-1501.
[6] J. Inukai, K. Miyatake, K. Takada, M. Watanabe, T. Hyakutake, H. Nishide, Y. Nagumo, M. Watanabe, M. Aoki, H. Takano, Angew. Chem. Int. Ed. 47 (2008) 2792-2795.
[7] K. Nagai, A. Higuchi, T. Nakagawa, J. Polym. Sci.: Part B: Polym. Phys., 33, (1995) 289-298.
[8] M. Noponen, T. Mennola, M. Mikkola, T. Hottinen, and P. Lund, J. Power Sources, 106 (2002) 304-312.
[9] M.M. Mench, C.Y. Wang, M. Ishikawa, J. Electrochem. Soc. 150 (2003) A1052-A1059.
[10] M. Noponen, J. Ihonen, A. Lundblad, G. Lindbergh, J. Appl. Electrochem. 34 (2004) 255-262.
[11] K. Takada, Y. Ishigami, J. Inukai, Y. Nagumo, H. Takano, H. Nishide, M. Watanabe, J. Power Sources 196 (2011) 2635-2639.
[12] J. Inukai, K. Miyatake, Y. Ishigami, M. Watanabe, T. Hyakutake, H. Nishide, Y. Nagumo, M. Watanabe, A. Tanaka, Chem. Commun. 15 (2008) 1750-1752.
[13] Ch. Wieser, A. Helmbold, E. Gülzow, J. Appl. Electrochem. 30 (2000) 803-807. [14] G. Bender, M.S. Wilson, T.A. Zawodzinski, J. Power Sources 123 (2003)
32
[15] T.V. Reshetenko, G. Bender, K. Bethune, R. Rocheleau, Electrochimica Acta 69 (2012) 220-229
[16] Y. Ishigami, K. Takada, H. Yano, J. Inukai, M. Uchida, Y. Nagumo, T. Hyakutake, H. Nishide, M. Watanabe, J. Power Sources 196 (2011) 3003-3008.
33
Chapter 3
Visualization of Oxygen Partial Pressure under the
Single-serpentine Flow Channel and the Ribs in a
Polymer Electrolyte Membrane Fuel Cell during the
Power Generation
3.1. Introduction
The local reaction rates in an MEA are affected by the geometry of the cell components, such as GFCs and GDLs. In our research group, based on the p(O2) results obtained on the upper GFC wall and on the GDL under the GFC, p(O2) under the ribs was numerically simulated [1,2], but the experimental results have not been obtained yet, as described in Chapter 1. In this Chapter, the visualization of the p(O2) distribution at the surface of the GDL both under the GFC and the ribs using a developed 9-segmented see-through PEFC (described in Chapter 2) was performed. The performance and effectiveness of the 9-segmented p(O2) visualization system were evaluated. p(O2) both under the GFC and the ribs was combined to elucidate the reaction distributions inside the MEA.
34
3.2. Experimental setup
To prepare the gas diffusion electrodes (GDEs), a catalyst paste mixed with commercial Pt catalyst supported on carbon black (CB) (46wt%-Pt, Tanaka Kikinzoku Kogyo K.K.), pure water, ethanol, and 5wt% Nafion® ionomers (ion exchange capacity = 0.9 meq g-1, DE521, E. I. Du Pont Nemours & Company, Inc.) with an ionomer / carbon ratio of 0.7 was spray-coated on the microporous-layer side of the gas diffusion layers (GDLs, SIGRACET® 25BCH, SGL Carbon Group Co., Ltd.) by using a pulse-swirl-spray apparatus (Nordson), and then dried at 60 °C for 12 hours in an electric oven. The Nafion® membrane (NRE211, E. I. Du Pont Nemours & Company, Inc.) and two GDEs were hot-pressed at 140 °C and 1.0 MPa for 3 minutes to form a membrane-electrode assembly (MEA) with the geometric area of 29.2 cm2 and the Pt loading 0.50 mg cm-2 on both the anode and the cathode. An oxygen-sensitive dye film was spray-coated uniformly (Fig. 2-3) with a thickness of 2 µm on the cathode GDL surface to visualize p(O2).
The cell was operated at a temperature of 80 °C with a relative humidity of 53% RH. After the acquisition of the calibration curves as described in Chapter 2, the gas-flow rate both at the anode and at the cathode was set at 300 ml min-1 during the operations.
p(O2) was measured at the oxygen utilization (Uo2) from 0% to 78% and at the average
current density from 0 to 500 mA cm-2.
Instrumental setups of the visualization system and the 9-segmeted see-through cell are as reported in Chapter 2.
35
3.3. Results and Discussion
3.3.1. Distributions of p(O2) at different Uo2
Fig. 3-1 shows the distributions of p(O2) with increasing Uo2 from 0 to 78%. The colors of the images correspond to p(O2) (see the color bar on the right). Metal current collectors and wires for current collecting are masked in black on the p(O2) images. The air was supplied into a single serpentine GFC from the upper right, out to the outlet at the lower left. In Fig. 3-1, p(O2) was seen to decrease from the inlet to the outlet, but not always monotonically along the GFC because of the cross flow through the GDL as reported previously [1-6]. This tendency will be later discussed using a p(O2) curve along the GFC length. The image inside the red square in Fig. 3-1(e) is enlarged as Fig. 3-1(e’). p(O2) under the ribs was clearly observed, and the value was lower than that under the neighboring GFC because of the lower gas diffusivity under the ribs as shown in white rectangles of Fig. 3-1(e’) [7-9]. The insufficient diffusivity should have lowered the oxygen concentration and increased the water vapor pressure. In the purple rectangle on the left side of Fig. 3-1(e’), p(O2) is very high on the lower part of the GDL due to the side flow thorough the GDL from a slight gap between a gasket and the GDL (Fig. 2-1(a)). As the Uo2 increased, p(O2) near the inlet was also seen to increase.
36
Fig. 3-1 Distributions of p(O2) during the power generation. Data in red rectangle in (e) was enlarged as (e’). Cell temperature = 80 o
C; relative humidity = 53% RH; constant gas flow rate for H2 and air = 300 ml min-1; oxygen utilization (Uo2) = 0 (a), 20 (b), 40 (c), 60 (d) and 78% (e). Area indicated by a red rectangle in (e) is enlarged in (e’) to show the GFC in red, the transparent ribs in white, the current collectors in blue and the wires masked in black.
37
Based on the distributions in Fig. 3-1, p(O2) was plotted along the GFC from the inlet (0 mm) to the outlet (1430 mm) at different Uo2 in Fig. 3-2. p(O2) at the inlet was 17.3 kPa at Uo2 = 0%. p(O2) then decreased gradually from the inlet to the outlet along the GFC length by approximately 1 kPa due to the total pressure loss, even there was no power generation [1,2,10]. The differential (total) pressure between at the inlet and at the outlet of the channel was measured to be 3-5 kPa under the same condition. This value is in consistent with the difference in p(O2) at the inlet and the outlet (1 kPa) assuming the percentage of oxygen to be 21% in air. At Uo2 = 20%, p(O2) at the inlet was slightly higher (17.6 kPa) than that at Uo2 = 0% (17.3 kPa). p(O2) then monotonically decreased from the inlet to the outlet because of the oxygen consumption. As discussed previously, the p(O2) decrease is not always monotonic because of the cross flow through the GDL; increases in p(O2) at L = 350 and 500 mm are seen, for example. The increase in p(O2) at the inlet was caused by the increase in total pressure inside a GFC because of the generation of water vapor. At Uo2 = 40%, p(O2) at the inlet jumped to 19.3 kPa. Along the GFC length, p(O2) decreased more because of the larger consumption of oxygen. Periodic, sharp spikes are observed in the p(O2) curve. These spikes are originated from the sudden change (both increase and decrease) in p(O2) at turns both on the right and the left sides of the serpentine channel [1,11]. These spikes are seen at the same location at different Uo2 as indicated by red arrows. Besides the spikes, p(O2) became fluctuated at Uo2 = 40%. This fluctuation was considered to be caused by the “different depths for the p(O2) measurement” from the outermost GDL surface to a depth of several µm, because a luminescent complex was coated on the GDL with micropores [1,2]. The irregularity in height at the GDL surface is shown in Fig. 2-3. During the power generation, p(O2) closer to the catalyst layer becomes smaller than that on the outermost GDL surface, and the fluctuation in p(O2) should naturally appear. At Uo2 = 60% with a larger change in p(O2) along the GFC length, the fluctuation in p(O2) became larger. The fluctuation is pronounced near the inlet between L = 0 and 900 mm, because, in this region, the oxygen consumption was larger as seen in the slope on the curve. This larger oxygen consumption near the inlet was probably caused by the accumulation of too much water in the catalyst layer and the lower
38
oxygen concentration near the outlet [1]. At Uo2 = 78%, the oxygen consumption and the water generation were larger, and p(O2) at the inlet became 24.3 kPa. Near the inlet, the fluctuation of p(O2) accordingly became the largest. Near the outlet, the slope in curve became smaller along the GFC length, and the p(O2) fluctuation became smaller.
39
Fig. 3-2 p(O2) along the GFC length from the inlet (0 mm) to the outlet (1430 mm) at Uo2 = 0, 20, 40, 60 and 78%.
40
3.3.2. p(O2) under the channel and ribs
Fig. 3-3(a) is a p(O2) image at Uo2 = 40% previously shown in Fig. 3-1(c), to which two vertical purple lines in the transparent region were added. The length along the lines was 54 mm. Along the dashed line on the right rim in Fig. 3-3(a), p(O2) was plotted in Fig. 3-3(b) at Uo2 = 0, 20, 40, 60 and 78%. At Uo2 = 0% there is no periodic undulations. During the power generation, 13 undulations appeared (Fig. 3-3(b)) with the period of 4 mm. The peaks of the undulations seen in Fig. 3-3(b) are related to the curves in the serpentine GFC as indicated by red arrows in Fig. 3-3(a’) (zoomed image of a red rectangle in Fig. 3-3(a)), where the gas flow came in in the right direction and went out in the left direction; at the curves, the gas was pushed through the GDL to make p(O2) higher. Between the neighboring two curves with high p(O2) pointed at by red arrows in Fig. 3-3(a’), p(O2) was low as seen in Fig. 3-3(b). p(O2) at the tops of the periodic modulations roughly match with that in Fig. 3-2 because of the direct influence of the gas flow inside the GFC. p(O2) was seen to increase from L = 50 to 54 mm. This unexpected increase is thought to have been caused by the side flow through the GDL from a small space between gasket and GDL as mentioned in Experimental section (Fig. 2-4(a)), where p(O2), without a catalyst layer with no oxygen consumption by the ORR, is expected to be higher than that with the catalyst layer. The influence of this small gap was seen in a slightly different manner in different cells because of slight difference in configurations. In Fig. 3-3(c), along the solid line in Fig. 3-3(a) across the GFC and the ribs, periodic undulations in p(O2) are clearly seen; the local maximum and minimum values were observed at the middles of the GFC and the ribs, respectively. The period of the undulations in Fig. 3-3(c) was 2 mm, half that in Fig. 3-3(b). The differences between the neighboring maximum and minimum values became larger with increasing Uo2 and smaller along the GFC from the inlet to the outlet. Fig. 3-4 shows schematic models for the p(O2) distributions under the GFC and the ribs along the vertical dashed line in Fig. 3-3(a) and the solid line in Fig. 3-3(a). At the open-circuit voltage (Uo2 = 0), no periodic undulations were observed between 0 and 10 mm in Fig. 3-3(c), whereas smaller undulations were seen at 10 to 53 mm. During the acquisition of the calibration curves with the mixtures of oxygen and nitrogen introduced into both the anode and the
41
cathode, the flow rate was only 50 ml min-1 for reducing the pressure loss. The data in Fig. 3-3 were obtained at the flow rate of 300 ml min-1, and the difference in diffusion of air under the GFC and the ribs was detected as undulations. The maximum and minimum values of p(O2) under the GFC and the ribs obtained from Fig. 3-3(c) are shown in Fig. 3-5(a) and (b), respectively. During the power generation, p(O2) from L = 53 to 54 mm steeply increased under the rib (Fig. 3-5(b)). This increase of p(O2) at the outlet could be due to the side flow through the GDL from the small space between gasket and GDL (Fig. 2-4(a)) as have been explained for Fig. 3-3(b). Under the ribs,
p(O2) drastically decreased between L = 0 and 10 mm during the operation, and the slopes in this region largely increased with increasing Uo2. On the other hand, p(O2) under the GFC almost linearly decreased. Under the ribs, from L = 10 to 53 mm at Uo2 = 20% and 40%, from L = 10 to 40 mm at Uo2 = 60%, and from L = 10 to 20 mm at Uo2 = 78%, the slopes were almost the same as those under the GFC. Therefore, the current densities in these regions are expected to be nearly the same both under the GFC and under the ribs; the same rates of the decrease in p(O2) should mean the same rates of the oxygen consumption during the power generation. In the regions close to the outlet at higher Uo2, (L = 40 to 53 mm at Uo2 = 60% and from L = 20 to 53 mm at Uo2 = 78%),
p(O2) under the ribs decreased only slightly by less than 3 kPa. This small p(O2) change
could mean a smaller oxygen consumption and a smaller power generation in this region. p(O2) under the ribs near the inlet with the higher decreasing ratio of p(O2) may be indicating a larger power generation by the higher gas diffusion due to the higher total pressure (Fig. 3-2). In our previous paper [2], it was also reported by numerical simulations that the power generation under the ribs differ under different conditions for the power generation.
With our see-thorough cell, p(O2) under the ribs has been clearly detected as well as under the GFC. The water and temperature distributions inside a PEFC are important issues [1,2,7-9]. Numerical simulations of water and temperature have been carried out based on the p(O2) distributions [1,2]. With using the same see-through cell, the current density distributions have been obtained during the power generation and will be reported in the next Chapter. By combining the p(O2) and current distributions, the
42
distributions of water and temperature are expected to be more accurately simulated. This technique will be further used for the elucidation of the reaction distributions inside a PEFC, for designing cells with higher performance, and for establishing suitable operation modes.
43
Fig. 3-3 (a): p(O2) image at Uo2 = 40%. (a’): Zoomed image of a red rectangle in (a). (b): p(O2) at Uo2 = 0, 20, 40, 60 and 78% under the ribs along the vertical dashed line in (a). (c): p(O2) at Uo2 = 0, 20, 40, 60 and 78% under the GFC and ribs along the solid line in (a).
Fig. 3-4 Schematic models for the p(O2) distributions under the GFC and the ribs along the vertical dashed line (a) and along the solid line (b) in Fig. 3-3(a).
44
Fig. 3-5 Maximum p(O2) under the channel (a) and minimum p(O2) under the ribs (b) obtained from Fig. 3-3(c).
45
3.4. Conclusions
The p(O2) distributions at the GDL surface under the GFC and the ribs were successfully visualized and quantified with different Uo2 for the first time. p(O2) under the GFC was higher than that under the ribs. Along the line perpendicular to the GFC, the local maximums and minimums of p(O2) were seen at the middles of the GFC and the ribs, respectively. The p(O2) differences between the neighboring maximums and minimums became larger with increasing Uo2 and smaller along the GFC from the inlet to the outlet. Near the edge of the GDL, an influence of the side flow through the GDL from a small space between the gasket and the GDL was also observed. Under a wet condition, the lower gas diffusivity under the rib might have led to a lower oxygen concentration, a higher water vapor pressure, and the accumulation of liquid water causing lower p(O2) values under the ribs. The visualization and the quantification of the reaction distributions under the GFC and the ribs should be useful for the developments of MEA and cells with higher performance and durability.
46
3.5. References
[1] Y. Ishigami, W. Waskitoaji, M. Yoneda, K. Takada, T. Hyakutake, T. Suga, M. Uchida, Y. Nagumo, J. Inukai, H. Nishide, M. Watanabe, J. Power Sources 269 (2014) 556-564.
[2] K. Nagase, H. Motegi, M. Yoneda, Y. Nagumo, T. Suga, M. Uchida, J. Inukai, H. Nishide, M. Watanabe, ChemElectroChem 2 (2015) 1495-1501.
[3] J.P. Feser, A.K. Prasad, S.G. Advani, J. Power Sources 161 (2006) 404-412. [4] H. Li, Y. Tang, Z. Wang, Z. Shi, S. Wu, D. Songa, J. Zhang, K. Fatih, J. Zhang, H.
Wang, Z. Liu, R. Abouatallah, A. Mazza J. Power Sources 178 (2008) 103-117. [5] K. Takada, Y. Ishigami, J. Inukai, Y. Nagumo, H. Takano, H. Nishide, M.
Watanabe, J. Power Sources 196 (2011) 2635-2639.
[6] K. Nagase, H. Motegi, M. Yoneda, Y. Nagumo, T. Suga, M. Uchida, J. Inukai, H. Nishide, M. Watanabe, ChemElectroChem, 2 (2015) 1495-1501.
[7] I.A. Schneider, S. von Dahlen, M.H. Bayer, P. Boillat, M. Hildebrandt, E.H. Lehmann, P. Oberholzer, G.G. Scherer, A. Wokaun, J. Phys. Chem. C 114 (2010) 11998-12002.
[8] J.P. Owejan, T. A. Trabold, and M. M. Mench,Int. J. Heat and Mass Transfer 71 (2014) 585 -592.
[9] U.N. Shrivastava, K. Tajiri, J. Electrochem. Soc. 163 (2016) F1072-F1083.
[10] S.M. Baek, D.H. Jeon, J.H. Nam, C.J. Kim. J. Mech. Sci. Technol. 26 (2012) 2995-3006.
[11] D. Gerteisen, N. Zamel, C. Sadeler, F. Geiger, V. Ludwig, C. Hebling, Int. J. Hydro. Energy 37 (2012) 7736-7744.
47
Chapter 4
Simultaneous Visualization of Oxygen Partial
Pressure, Current Density, and Water Droplets in
Serpentine Fuel Cell during Power Generation for
Understanding Reaction Distributions
4.1. Introduction
Operando visualization of the distributions of multiple chemical/physical parameters inside a PEFC during the power generation is important to elucidate the reaction distributions during the power generation. In Chapter 3, the p(O2) distributions at the GDL surface under the GFC and the ribs were visualized and quantified with different Uo2. The difference in the gas diffusivity between under the GFC and the ribs was clearly observed. In Chapter 4, the visualization of p(O2) and the current density was simultaneously carried out using a 9-segmented see-through PEFC with different temperatures. At higher humidities, water droplets were additionally observed. The combination of p(O2), the current density and liquid water droplets inside a PEFC during the operation was helpful in understanding the materials transport derived by the reaction distributions inside a cell. The influence on the cell performance of the temperature, the humidification inside an electrolyte membrane and the flooding of a catalyst layer was discussed based on the visualization data.
48
4.2. Experimental setup
The setup of the visualization system and the preparation of an MEA were described in Chapters 2 and 3, respectively. The cell was operated at temperatures of 40 and 80 °C with a relative humidity of 53% RH. After the acquisition of the calibration curves as described in Chapter 2, the gas flow rates both at the anode and at the cathode were set at 300 ml min-1 during the operations. Table 4-1 shows gas utilization and gas stoichiometry during cell operation. p(O2) and the current density were measured at the Uo2 from 0% to 80% and at the average current density from 0 to 500 mA cm-2.
With this visualization system of p(O2), liquid water was able to be detected as previously reported because of the light scattering by water inside cells [1-3]. The simultaneous visualization of p(O2) and water droplets were conducted also in this study, together with the current density.
Table 4-1 Uo2, UH2, O2 stoichiometry and H2 stoichiometry during the power generation. Gas flow rate both at the anode and at the cathode was set at 300 ml min-1.
UO2, % 10 20 30 40 50 60 70 80
UH2, % 4 8 13 17 21 25 29 34
O2 Stoichiometry 10.0 5.0 3.3 2.5 2.0 1.7 1.4 1.3 H2 Stoichiometry 23.7 11.9 7.9 5.9 4.8 4.0 3.4 3.0
49
4.3. Results and Discussion
4.3.1 Simultaneous visualization of p(O2) and current density at a higher temperature Fig. 4-1 shows the distributions of p(O2) (Fig. 4-1(a), 4-1(b-1)-(e-1)) and the current density (Fig. 4-1(b-2)-(e-2)) simultaneously obtained with increasing the Uo2 from 0 to 78% at the cell temperature of 80 °C and the relative humidity of 53%. The colors of the images correspond to p(O2) and the current density (see color bars on the right). p(O2) at 80 °C and 53% RH was discussed in the previous chapter. At Uo2 = 20, 30 and 50%, the current densities were relatively uniform throughout the cell (Fig. 4-1(b-2)-(d-2)). On the other hand, at Uo2 = 78% (Fig. 4-1(e-2)), the current densities near the inlet became higher than that near the outlet. This change in current density could be explained by the liquid water formation in the catalyst layer near the outlet, which hindered the gas transport and lowered the oxygen consumption for the ORR. Another reason for the smaller current density near the outlet at a higher Uo2, or a higher current density, with a constant gas flow rate as used in this experiment, the stoichiometry will be also significantly less (Table 4-1), and therefore the oxygen concentration and consequently the current density. Both effects should play roles.
50
Fig. 4-1 Distribution of p(O2) ((a), (b-1)-(e-1)) and current density ((b-2)-(e-2)) during operation. Cell temperature = 80 °C; relative humidity = 53%RH (H2 and air); gas flow rate for H2 and air = 300 ml min-1; oxygen utilization (Uo2) = 0% (average current density (javg) = 0 mA cm-2) (a), 20% (124 mA cm-2) (b-1)(b-2) , 30% (186 mA cm-2)
51
4.3.2. Simultaneous visualization of p(O2), current density, and water droplets at a lower temperature
In order to understand the influence of liquid water clearly, the cell temperature was lowered from 80 to 40 °C. Fig. 4-2 shows the distribution of p(O2) (Fig. 4-2(b-1)-(g-1)) and current density (Fig. 4-2(b-2)-(g-2)) simultaneously obtained with increasing Uo2 at the cell temperature of 40 °C and the humidity of 53% RH. Figs. 4-2(d-1) and 4-2(d-2) were obtained 25 minutes after the Uo2 was set at 30% (Figs. 4-2(c-1) and 4-2(c-2)), and Figs. 4-2(d-1) and 4-2(d-2) after 50 minutes. Figs. 4-2(b-1’) and 4-2(c-1’) are the images obtained by expanding the regions in red rectangles in Figs. 4-2(b-1) and 4-2(c-1), respectively. When the cell was operated at Uo2 = 20% (Fig. 4-2(b-1) and 4-2 (b-1’)), round blue circles, 0.2 - 0.5 mm in diameter, appeared on the upper GFC close to the ribs near the outlet as shown in white circles of the Fig. 4-2(b-1’). These blue circles are of water droplets observed by the scattering of light. The water droplets were also directly observed with eyes. The current densities near the outlet in Fig. 4-2(b-2) were about 10% higher than the average value because of the positive effect of the humidification of membrane by the generated liquid water near the outlet, which increased the proton transport inside the PEM and ionomer[4,5]. At Uo2 = 30% (Fig. 4-2(c-1)), the number of water droplets increased near the outlet as shown in white circles of Fig. 4-2(c-1’). After 50 minutes (Fig. 4-2(d-1)), water droplets increased up to the middle of the GFC. Near the outlet, the water droplets were accumulated to become much larger and they occasionally plugged the GFC [1,2]. Accordingly, the distributions of the current density at Uo2 = 30% at 0 minute (Fig. 4-2(c-2)) and after 30 minutes (Fig. 4-2(d-2)) became more uniform than that at Uo2 = 20%, because the current density near the outlet was slightly lowered by the water formed at the catalyst layer. After 50 minutes (Fig. 4-2(e-2)), the current densities became higher near the inlet (ca. +15%) and lower near the outlet (ca. -15%). The difference of current density between at the inlet and the outlet became the largest at Uo2 = 50% (Fig. 4-2(f-2)), because of the heavier flooding. Surprisingly, the difference in current density became smaller at the Uo2 = 80% (Fig. 4-2(g-2)) in spite of the larger water formation by the higher power generation. p(O2) was more uniformly distributed in Fig. 4-2(g-1) than in Fig. 4-2(f-1).
52
Interestingly, at Uo2 = 80%, the number of water droplets became smaller (Fig. 4-2(g-1)).
53
Fig 4-2 Distribution of p(O2) ((a), (b-1)-(g-1)) and current density ((b-2)-(g-2)) during power generation. Images in red rectangles in (b-1) and (c-1) were enlarged as (b-1’) and (c-1’), respectively. Cell temperature = 40 °C; relative humidity = 53%RH (H2 and air); a constant gas flow rate for H2 and air = 300 ml min-1; oxygen utilization (Uo2) = 20% (average current density (javg) = 142 mA cm-2) (b-1)(b-2), 30% (186 mA cm-2) at 0
minute (c-1)(c-2), 30% (186 mA cm-2) after 25 minutes (d-1)(d-2), 30% (186 mA cm-2) after 50 minutes (e-1)(e-2), 50% (311 mA cm-2) (f-1)(f-2) and 78% (484 mA cm-2) (g-1)(g-2). The color bar for the current density shows the percentages from the average values.