One-dimensional migration of interstitial
clusters in SUS316L and its model alloys at
elevated temperatures
著者
Satoh Y., Abe H., Matsukawa Y., Matsunaga
T., Kano S., Arai S., Yamamoto Y., Tanaka
N.
journal or
publication title
Philosophical Magazine
volume
95
number
14
page range
1587-1606
year
2015-05-07
URL
http://hdl.handle.net/10097/63882
doi: 10.1080/14786435.2015.1040100This is an Accepted Manuscript of an article published by Taylor & Francis Group in Philosophical Magazine on 07/05/2015, available online:
http://www.tandfonline.com/10.1080/14786435.2015.1040100
Philosophical Magazine, 95 (2015) pp.1587–1606
One-dimensional migration of interstitial clusters in SUS316L and its model alloys at elevated temperatures
Y. Satoh, H. Abe, Y. Matsukawa, T. Matsunaga*, S. Kano
Institute for Materials Research, Tohoku University, 2-1-1 Katahira, Aoba-ku, Sendai 980-8577, Japan
* Present address: National Institute for Materials Science, 1-2-1 Sengen, Tsukuba, Ibaraki 305-0047, Japan
S. Arai, Y. Yamamoto, N. Tanaka
High Voltage Electron Microscope Laboratory, Ecotopia Science Institute, Nagoya University, Furo-cho, Chikusa-ku, Nagoya 464-8601, Japan.
Abstract
For self-interstitial atom (SIA) clusters in various concentrated alloys, one-dimensional (1D) migration is induced by electron irradiation around 300 K. But at elevated
temperatures the 1D migration frequency decreases to less than one-tenth of that around 300K in iron-based bcc alloys. In this study we examined mechanisms of 1D migration at elevated temperatures using in situ observation of SUS316L and its model alloys with high-voltage electron microscopy. First, for elevated temperatures, we examined the effects of annealing and short-term electron irradiation of SIA clusters on their
subsequent 1D migration. In annealed SUS316L, 1D migration was suppressed and then recovered by prolonged irradiation at 300 K. In high-purity model alloy Fe-18Cr-13Ni, annealing or irradiation had no effect. Addition of carbon or oxygen to the model alloy suppressed 1D migration after annealing. Manganese and silicon did not suppress 1D migration after annealing but after short-term electron irradiation. The suppression was attributable to the pinning of SIA clusters by segregated solute elements, and the recovery was to the dissolution of the segregation by interatomic mixing under electron irradiation. Next we examined 1D migration of SIA clusters in SUS316L under
continuous electron irradiation at elevated temperatures. The 1D migration frequency at 673 K was proportional to the irradiation intensity. It was as high as half of that at 300 K. We proposed that 1D migration is controlled by the competition of two effects: induction of 1D migration by interatomic mixing and suppression by solute segregation.
1. Introduction
In molecular dynamics simulations of displacement collision cascades in iron and copper, self-interstitial atom (SIA) clusters are produced directly from cascade damage and escape from the damage zone through one-dimensional (1D) migration: a glide motion along the direction of the Burgers vector with low activation energies [1,2]. However, vacancies migrate through 3D random walks. The difference in the
mechanisms between SIAs and vacancies being released from cascades have been regarded as ruling the kinetics of defect structural evolution under high-energy neutron irradiation [3,4]. Although 1D migration in alloys containing both substitutional and interstitial solute elements are important in both fundamental and technical aspects, the mechanism of 1D migration in concentrated alloys remains unclear.
In-situ observation of steels and model alloys using high-voltage electron microscopy (HVEM) revealed that SIA clusters of a few nanometers in diameter cause intermittent 1D migration at irregular intervals under electron irradiation at low
temperatures (e.g., room temperature) [5–9]. The distance of 1D migration has a common distribution (<10 nm) among the alloys, which contrasts to 1D migration in iron. The distance can be greater than 100 nm depending on the specimen purity and the SIA cluster size [10,11]. The 1D migration frequency is proportional to the irradiation intensity in iron and SUS316L [9,10], indicating that electron irradiation induces 1D migration.
We proposed a mechanism for 1D migration in concentrated alloys induced by high-energy particle irradiation, taking account of interaction between SIA clusters and major substitutional solute elements as follows [12,13]. In concentrated alloys as well as in pure metals, SIA clusters are fundamentally mobile on their respective 1D migration tracks. However, the formation energy of a SIA cluster fluctuates when it glides through solute elements of random distribution. The typical amplitude of the fluctuation exceeds a few electron volts for nanometer-sized SIA clusters, which acts as a severe barrier for 1D migration. Consequently, SIA clusters are stationary at the position with a local minimum in the fluctuating formation energy [12]. Under high-energy particle irradiation, the microscopic distribution of solute elements changes through atomic displacement and recovery of the produced Frenkel pairs (i.e., interatomic mixing effect), which induces SIA clusters’ 1D migration into new stable positions [13].
Under electron irradiation at elevated temperatures, however, the frequency of 1D migration decreases to less than one-tenth of that around room temperature in Fe-Cr [6] and A533B [8]. In the latter, also annealing at 673 K decreases the frequency under the subsequent electron irradiation at room temperature. The frequency recovers by
prolonged irradiation. The suppression and recovery of 1D migration are interpreted as follows: some solute elements diffuse rapidly at higher temperatures and segregate on SIA clusters to pin them down. The segregation is dissolved by the impact of fast electrons during prolonged irradiation [8].
In SUS316L and its high-purity model alloys, we confirmed that 1D migration occurs along the Burgers vector (b=a/2<110>) under electron irradiation at room temperature [9]. The frequency and distance of 1D migration have no apparent difference among these alloys, suggesting that minor substitutional and interstitial solute elements do not play an important role in the 1D migration. At elevated
temperatures, however, 1D migration will depend on the minor solute elements if the segregation affects 1D migration. This paper reports in situ experiments of SUS316L and its model alloys for understanding of 1D migration processes at elevated
temperatures in concentrated alloys. We performed two experiments. One examined effects of annealing and short-term electron irradiation at elevated temperatures on the subsequent 1D migration at room temperature. The other involved in situ observation of 1D migration in SUS316L under continuous electron irradiation at elevated
temperatures. The experimentally obtained results were interpreted and discussed based on the mechanisms proposed for induction, suppression, and recovery of 1D migration in alloys. Finally, we briefly compared these results with 1D migration in iron-based bcc alloys.
2. Experimental procedures
The specimens included a commercial SUS316L (Nilaco Corp.) and eight model alloys that had been prepared by arc melting of constituents having nominal purities exceeding 99.99%. The reference model alloy was a ternary Fe-18Cr-13Ni (mass %), which did not contain impurity elements exceeding 0.001 mass%. For preparation of the other model alloys, we added base alloy Fe-3.9C to control the concentration of
interstitial solute elements carbon and oxygen [9], or added substitutional solute elements of manganese or silicon, which are respectively oversized and undersized atoms. Table 1 presents results of chemical analysis of the specimens. It shows the total concentration. Some part of the interstitial elements might exist as oxides, nitrides, or carbides, although we did not detect a precipitate with TEM observation before the irradiation. The other elements in some alloys were analyzed using glow discharge mass spectrometry (GDMS) [9]. The button-shape model alloys made with arc-melting were cold-rolled to 0.12 mm thickness. The as-received specimen of the SUS316L sheet was 0.12 mm thick. Disc specimens of 3 mm diameter were punched from these sheets, and
were annealed for 3 h at 1327 K in a vacuum of about 10-4 Pa. Thin foil specimens for electron microscopy were prepared by electropolishing.
The electron irradiation and in situ observation presented in Section 3.1 were performed at an acceleration voltage of 1250 kV using HVEM (JEMARM-1250; JEOL Ltd.) at facilities at Tohoku University, which sustained catastrophic damage during an earthquake in March 2011. The remaining experiments were conducted at 1000 kV with a different HVEM device (JEM-1000 K RS; JEOL Ltd.) at Nagoya University. The irradiation intensity was 7 × 1024
e m-2 s-1
for both HVEMs, unless noted specifically. Adopting 40 eV as the threshold energy for atomic displacement (Ed), the atomic scattering cross section for producing Frenkel pairs in iron is 18.3 and 11.4 barns for 1250 and 1000 kV electrons, respectively [14], which yields damage rates of 0.013 and 0.008 dpa s-1
. In experiments with 1000 kV HVEM, the specimen temperature was monitored and controlled using a double-tilt heating holder (652; Gatan Inc.).
We examined effects of annealing and short-term electron irradiation on 1D migration of SIA clusters using the temperature-irradiation history shown in Figure 1. In the first step, we irradiated an area at room temperature (hereinafter 300 K) for 120 s to introduce SIA clusters. The second step involved annealing at temperature T2 ranging from 300 K to 673 K for 1200 s either without irradiation (t2 = 0s) or with short-term electron irradiation (t2 =10 or 30 s). The short-term irradiation was used in the latter half of the annealing. In the third step, we used in situ observation to examine the frequency and distance of 1D migration induced by electron irradiation at 300 K.
In situ observation was on bright-field images under two-beam conditions with exciting 002 systematic reflections. The direction of observation was 5–15 deg from <110> to <100>. Irradiation and observation were performed on wedge-shaped specimens of about 50–100 nm thickness. The magnification factor was 1 × 10⁵
. Images on the fluorescent screen were recorded at 30 frames per second using a CCD camera through the viewing window of both HVEMs. The recorded area was 267 nm × 137 nm (0.37 nm pixel size) for the 1250 kV HVEM, and 324 nm × 194 nm (0.45 nm pixel size) for the 1000 kV HVEM. The smallest limit of the observed clusters was around 2 nm.
In austenitic stainless steel and its model alloys, grown dislocation loops induced by electron irradiation are identified as interstitial-type by conventional inside-outside contrast method [15,16]. In addition, at relatively low temperatures where vacancies are not highly mobile, vacancies are accumulated to form small stacking fault tetrahedra (SFTs) or vacancy-type dislocation loops at later stage of irradiation [16-18]. These small vacancy clusters were not visible on bright-field images but with the weak-beam dark-field technique using 200 kV TEM after electron irradiation [9,17]. Also a work of
identification of the nature of small defect clusters in neutron irradiated Fe-Ni-Cr model alloys suggested that the bright-field observation is suitable for dislocation loops with strain field and weak-beam dark-field observation is suitable for small defect clusters such as SFTs [19]. We regarded all the clusters having clear strain contrast in bright field images as SIA clusters in the present experimental analysis.
We analyzed 1D migration of individual SIA clusters frame by frame on the personal computer display. We defined a single 1D migration event of a SIA cluster as a sequence from one stationary state to another through 1D migration. The distance of 1D migration was that between the two stationary points: we identified the center of mass of a cluster image by the naked eye, and measured the positions before and after 1D
migration. We ignored 1D migration of less than two pixels (about 1 nm) because
oversights were unavoidable for short 1D migration. Under electron irradiation at 300 K, long 1D migration occurs along the <110> direction [9]. We converted the projected displacements to 1D migration distances, assuming that all 1D migration is along the <110> direction as follows. Among six variants of perfect dislocation loops
(b=a/2<110>), two are out of contrast under the present observing condition (g=002). For the rest four variants, 1D migration tracks have the same inclination (60 deg) to the observing direction if we ignore the small deviation angle (5 - 15 deg) of the observing direction from the <110>. We obtained 1D migration distances by multiplying a factor
2 3 to all the projected (measured) distances.
The 1D migration frequency was the average number of 1D migration events observed per single SIA cluster during a unit time. We estimated the frequency from the total count of 1D migration events during a certain period (i.e., 3–30 s) and the number of SIA clusters observed at the central time of the period. Sometimes we observed the sudden appearance and disappearance of SIA cluster images, and fine scale vibration of SIA clusters over a short distance, which we did not count as 1D migration events.
3. Experimental results
3.1. Suppression and recovery of 1D migration in annealed SUS316L
Figure 2 presents a comparison of the defect structural evolutions in SUS316L under irradiation with 1250 kV electrons at 300 K in the third step, after annealing in the second step between T2=300 K and T2=673 K. The SIA clusters exhibited nucleation, growth, and disappearance in both conditions. Figure 3(a) shows the number of SIA clusters observed in a region of fixed size. The SIA clusters increased almost linearly with irradiation time in both conditions. Figure 3(b) shows the time evolutions of the 1D migration frequency for steps of 10 s. The frequency was much lower for T2=673 K
than T2=300 K at the early stage of irradiation. With increasing irradiation time, the former increased whereas the latter decreased. They were mutually comparable after 50 s. Frequency variation for T2=300 K agrees to that of the reference: continuous electron irradiation at 300 K with offset time of 120 s. Consequently, 1D migration was
suppressed by annealing at 673 K and then recovered, whereas 1D migration was unaffected by annealing at 300 K.
The annealing effect on 1D migration presented in Figure 3(b) was ambiguous at the late stage of the third step because the newly formed SIA clusters that had not been annealed in the second step increased and affected the frequency. For proper evaluation, it is necessary to ascertain whether individual SIA clusters were formed before or after the annealing, but it was difficult for the following reasons. 1) SIA clusters smaller than about 2 nm were not visible. 2) Even for the SIA clusters larger than the limit, many were out of contrast because of the invisibility criterion for electron microscope images (i.e., g .b=0) or because of geometrical conditions (i.e., the specimen thickness and the cluster depth in the specimen foil). We assume that some invisible SIA clusters became visible and vice versa under irradiation through growth, shrinkage, change in the Burgers vector, and 1D migration. Indeed, we frequently observed the sudden appearance and the disappearance of SIA cluster images under electron irradiation at 300 K [9].
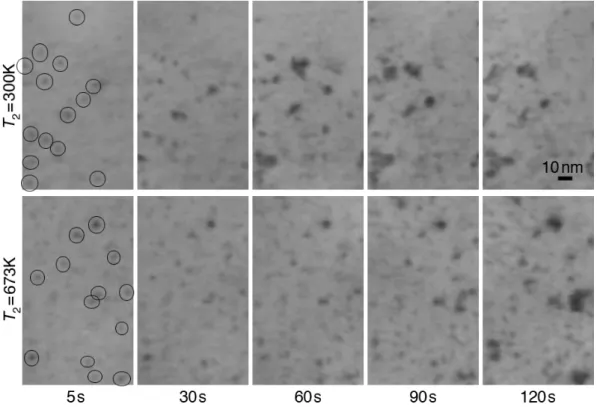
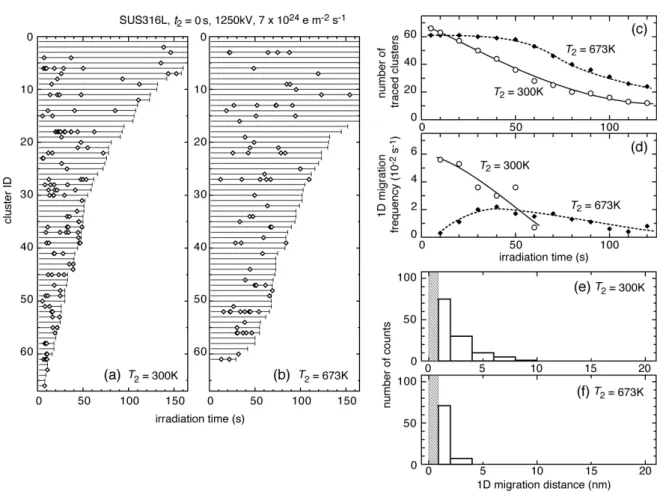
We analyzed 1D migration frequency on the same video using another procedure. In a very early stage (at 5 s) of the third step, we selected about 60 SIA clusters that were clearly identified by their large image size or high contrast. The examples are shown with circles in Figure 2. We assumed that they were formed in the first step and that they were annealed in the second step. We traced these SIA clusters, one by one, until they disappeared, coalesced, or overlapped geometrically with other clusters, while picking up their 1D migration events. Figures 4(a) and 4(b) show the distribution of 1D migration events (symbols) in the traceable period (bars) for individual SIA clusters. Figures 4(c) and 4(d) summarize the time evolutions of the number of traced clusters and the 1D migration frequency. The relative variation in the frequency shown in Figure 4(d) agrees with those in Figure 3(b), although the absolute values differ by a factor of around two. Therefore, we regard the relative frequency variation to be valid at least up to 60 s in the third step: newly produced SIA clusters did not affect the relative frequencies severely. The difference in the absolute values might reflect the irradiation dose dependence of the 1D frequency because Figure 4(d) shows the frequency of large SIA clusters, most of which would formed at the early stage of the first step. Furthermore, the large frequency might partly result from the small
probability of oversights in counting 1D migration events because we traced large SIA clusters one by one.
The results presented above confirmed that suppression and recovery of 1D migration occurs after annealing at elevated temperatures in SUS316L as well as in A533B [8]. We describe the following experimentally obtained results, with application of the mechanisms proposed for A533B: suppression of 1D migration because of pinning by segregation of some solute elements around SIA clusters, and recovery because of dissolution of the segregation by an impact with fast electrons [8].
In Figures 4(a) and 4(b), it is noteworthy that most of the selected SIA clusters exhibited 1D migration. For T2=673 K, we observed 78 events. These events were supplied by 38 out of 61 clusters. The remaining 23 clusters showed no migration in the respective traceable periods. For T2=300 K, 121 events were supplied by 49 out of 66 clusters. Figures 4(e) and 4(f) show that the distance of 1D migration was shorter for T2=673 K than for T2=300 K. The distribution for the latter was similar to that under continuous irradiation at 300 K [9]. Consequently, annealing at 673 K decreased the distance of 1D migration, in addition to the frequency. We examined also the size of the SIA clusters. We measured both major and minor sizes of a cluster image, and assigned their average as the cluster size. Changes in the size of traced clusters were not large in both conditions: for example, the average size of the clusters that were traceable at 65s was respectively 3.2 and 3.5 nm at 5 and 65s for T2=300 K, and 3.0 and 3.1 nm for T2=673 K.
Finally, we note the effect of 1D migration on the microstructural evolution. Figures 4(a)–4(c) show that the traceable period was shorter for T2=300 K than T2=673 K. We presume that 1D migration with higher frequency and longer distance for T2=300 K increased the probability for SIA clusters to disappear through reaching the specimen surfaces, or through coalescing or overlapping with other clusters. However, the effect was small on the total defect structural evolution, as shown already in Figure 3(a). The high nucleation rate increased the total number of SIA clusters with the irradiation time almost equally in both cases.
3.2. Effects of annealing on 1D migration in model alloys 3.2.1. Solute element dependence
We performed experiments on the model alloys using the 1000 kV HVEM to evaluate the contribution of individual solute elements to the suppression of 1D migration. For a simple evaluation of 1D migration frequency in numerous conditions, we counted 1D migration events of all SIA clusters observed, in the manner shown in
Figure 3. Suppression effects were represented by the frequency interpolated to 15 s, as shown in Figure 3(b).
White and gray bars in Figure 5 show the frequency after annealing (t2=0 s) at 300 and 673 K, respectively; black bars show the frequency after annealing at 673 K that involved short-term electron irradiation (t2=10 s). The frequency in SUS316L decreased again after annealing at 673 K. Added short-term electron irradiation had no apparent effect on SUS316L. In the reference model alloy Fe-Cr-Ni, neither the annealing nor the short-term irradiation decreased the frequency, indicating that the major solute elements, chromium and nickel, did not contribute to the suppression. Addition of interstitial solute elements, carbon or oxygen, to the reference model alloy, decreased the frequency again after the annealing. Carbon atoms of 0.002 mass % did not affect the frequency; the suppression was clear at 0.006C, and was saturated at 0.012C. Oxygen atoms seem to have a similar effect to that of carbon atoms. The short-term irradiation did not decrease the frequencies in Fe-Cr-Ni-0.012C and
Fe-Cr-Ni-0.003O further. On the other hand, the substitutional solute elements, silicon and manganese, did not decrease the frequency after annealing, but did so after the short-term irradiation. These results confirmed that both interstitial and minor substitutional solute elements can suppress 1D migration. Presumably, irradiation at elevated temperatures induced segregation of substitutional solute elements to SIA clusters through thermal migration of radiation-induced point defects.
3.2.2. Temperature dependence
Figure 6 shows the 1D migration frequency as a function of the temperature of annealing (t2=0 s) and short-term irradiation (t2=30 s). Figures 6(b) and 6(c) show that the effect of interstitial solute elements had a similar temperature dependence. With increasing temperature, the frequency started to decrease at temperatures slightly higher than 300 K and became almost saturated at temperatures higher than 400 K. We infer that the low oxygen content was responsible for the small magnitude of the suppression effect. Figures 6(d) and 6(e) show that the substitutional solute elements decreased the frequency after short-term irradiation at temperatures higher than 450 K. The decrease in the frequency started at a lower temperature and showed a larger magnitude for silicon than manganese. The strong suppression effect for silicon is attributable to fast migration of silicon, as discussed in Section 4.3.
Figure 6(a) shows that the frequency in SUS316L decreased gradually from just above 300 K to 673 K. The short-term irradiation had no marked effect on the frequency at any temperature, suggesting that interstitial solute elements rather than minor
the temperature dependence for SUS316L differed from that for the model alloy containing carbon or oxygen. The gradual decrease of the frequency in a wide
temperature range in SUS316L suggests the presence of various traps for migration of interstitial solute elements, probably point defects, other minor solute elements, and their complexes.
3.2.3. Recovery of 1D migration
We examined the recovery of 1D migration under prolonged irradiation at 300 K. Figure 7(a) presents a comparison of the time evolution of 1D migration frequency in Fe-Cr-Ni-0.012C after annealing among 300, 373, and 673 K. Annealing at 300 K was the reference condition. The frequency did not decrease at the initial stage. After
annealing at 373 and 673 K, the frequency once decreased and then recovered. The rate of recovery was slightly higher for T2=373 K than for T2=673 K. Figure 7(b) shows the case for Fe-Cr-Ni-0.55Si for T2=673 K. The suppression and recovery were not
observed after annealing (t2=0 s) but after the short-term irradiation (t2=10 and 30 s). The recovery rate was higher for t2=10 s than for t2=30 s. Long irradiation in the second step induced a large amount of solute segregation, which required long irradiation at 300 K for the dissolution. The small difference in the recovery rates in Fe-Cr-Ni-0.012C between T2=373 K and T2=673 K might reflect that segregation of carbon was almost completed, even by the annealing at 373 K.
3.3. 1D migration in SUS316L at elevated temperatures
We examined 1D migration of SIA clusters in SUS316L under continuous electron irradiation at elevated temperatures. Figure 8(a) presents a comparison of the defect structural evolution at three temperatures. The SIA clusters had a higher growth rate at higher temperatures. We observed that some SIA clusters grew to burst into dislocation lines at 673 K, probably by touching the specimen surface or other
dislocation. We ignored such dislocation lines and SIA clusters larger than about 15 nm in the following analysis.
Figure 9(a) shows that clusters appeared at around 20 s from the start of
irradiation. Moreover, the cluster number increased with irradiation time. Saturation in the number of clusters at 673 K does not reflect completion of the nucleation, but rather a balance among nucleation, disappearance, and the ignorance of grown SIA clusters in the analysis because we observed the appearance of small SIA clusters after 60 s, some of which would be by nucleation. The number of observed SIA clusters differed among the experimental runs performed at the same temperature, which partly resulted from
differences in specimen thickness among the observed areas.
Figure 8(b) presents examples of dynamic behavior of SIA clusters at 673 K. Sudden appearance and disappearance of cluster images are denoted respectively as ‘a’ and ‘d’. We also observed intermittent 1D migration with irregular intervals at 473 and 673 K, as well as 300 K [9]. It is labeled ‘m’ with arrows indicating the direction of migration. Additional lines are shown on the figure for clarity because the 1D migration distance was short and comparable with the SIA cluster image size. The 1D migration speed had variations: a stepwise 1D migration was completed almost within the time interval of the video frames. Slow migration took about a second. Most features in dynamic behavior were similar to those observed at 300 K [9]. We sometimes observed the motion of only a part of a grown SIA clusters or a burst dislocation line, which we ignored in the analysis.
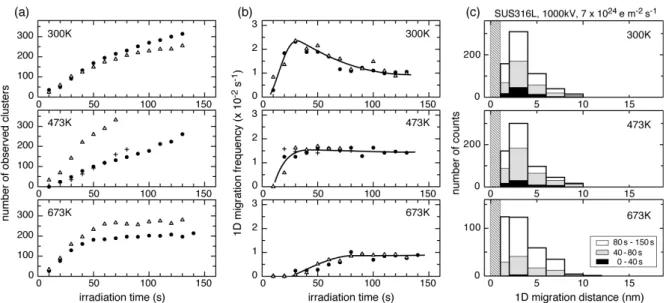
Figure 9(b) presents time evolutions of the 1D migration frequency at three temperatures. The frequency at 300 K increased with irradiation time at the early stage. It then decreased to about half the peak frequency. At 473 K and 673 K, the frequency built up slower. Then it saturated after 100 s without forming a peak. The maximum frequency decreased with increase of the irradiation temperature. The frequency at 673 K became about half that at 300 K. Figure 9(c) shows that the distribution of 1D migration distance did not depend strongly on the irradiation temperature or the irradiation time. We examined the size of the SIA clusters of which we measured 1D migration frequency at 300K and 673K. On a video frame at 100s, we measured the image size of about 70 clusters, with neglecting burst dislocation lines, grown SIA clusters, and also small SIA clusters overlapping with other clusters. For 300K and 673K, the average size was 3.7 and 4.5 nm, respectively; and the fraction of clusters exceeding 6 nm was 0% and 10%.
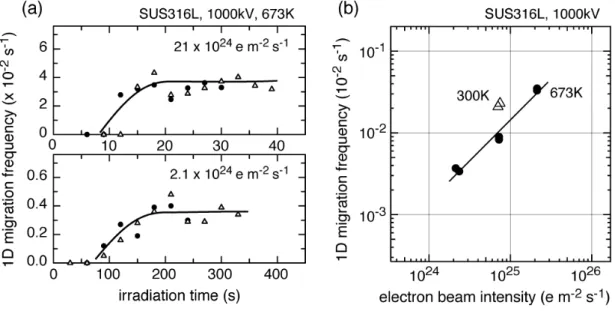
Finally, we examined the irradiation intensity dependence of 1D migration frequency at 673 K. Figure 10(a) shows the time evolutions of the 1D migration frequency at two intensities that differ by an order of magnitude. Again the frequency increased with irradiation time and then saturated. The irradiation time to produce the saturation increased concomitantly with decreasing irradiation intensity. Figure 10(b) is the maximum frequency shown against the irradiation intensity. The frequency was almost proportional to the irradiation intensity, suggesting that electron irradiation induced 1D migration at elevated temperatures just as they did at 300 K [9].
4. Discussion
For interpreting the experimentally obtained results presented above, we
emphasize the following two mechanisms from the previously proposed models for 1D migration in alloys.
(a) Suppression of 1D migration by solute segregation
Interstitial solute elements are thermally mobile during annealing at elevated
temperatures. Under electron irradiation at elevated temperatures, substitutional solute elements are mobile through thermal migration of radiation-induced point defects. Free migration of solute elements will redistribute them around SIA clusters so as to reduce the formation energy of SIA clusters. For example, interstitial solute elements and oversized substitutional solute elements tend to segregate to the dilatational strain field of SIA clusters. The SIA clusters cannot escape from deep potential valleys, which appears to be the suppression effect of 1D migration because of pinning of SIA clusters by segregation. For low temperatures at which the free (thermally activated) migration of solute elements is small or negligible, the suppression effect will also be small. The possible retardation of 1D migration due to segregation was proposed for substitutional chromium in Fe-9Cr [6] and interstitial elements in A533B [8].
(b) Induction of 1D migration by interatomic mixing
Electron irradiation induces 1D migration through the effect of interatomic mixing. We assume that the induction of 1D migration is two-fold. Impact with fast electrons dissolves the segregation of solute elements around SIA clusters, and sets the clusters free from the pinning [8]. Also, the interatomic mixing of major solute elements changes the stable position of SIA clusters, which drives SIA clusters into a new stable position through 1D migration [12,13].
The induction effects of 1D migration do not depend strongly on the irradiation temperature. This is because the mixing effects derive from dynamic processes of atomic collisions where thermal activation does not have a large contribution. Moreover molecular dynamics simulation of radiation-induced 1D migration shows that the induction effects do not depend virtually on the cluster size or the solute concentration [13]. This is partly supported by in situ observation of 1D migration in SUS316L under the continuous electron irradiation at 300K: the frequency and distance show no clear dependence on the cluster size, where the cluster size ranged from 2 to 6 nm [9]. The range covered the majority of clusters examined in the present experiments. We ignored the cluster size and the solute concentration in the simple model proposed below.
4.2. Interpretation of experimental 1D migration behavior
elevated temperatures based on the two mechanisms described in the preceding section. The proposed mechanisms are presented schematically in Figure 11.
(a) Effect of annealing and short-term irradiation on 1D migration
Under electron irradiation at 300 K in the first step, 1D migration was induced by the effect of interatomic mixing of major solute elements. However, minor substitutional and interstitial solute elements had no apparent effect on 1D migration because of their lower concentration [9]. During annealing at elevated temperatures in the second step, interstitial solute elements segregated to SIA clusters. By application of the short-term electron irradiation, substitutional solute elements also segregated. At the early stage of electron irradiation at 300 K in the third step, 1D migration was suppressed because of the pinning effect. The prolonged irradiation at 300 K dissolved the segregation to set the SIA clusters free. Thereafter, 1D migration started again under the interatomic mixing of major solute elements. On the recovery of 1D migration in SUS316L, a part of interstitial solute elements remained near the SIA cluster, acting as a trapping site, and reduced the 1D migration distance. On the other hand, annealing at 300 K had no effect because the thermal migration of solute elements was negligible.
(b) 1D migration under continuous irradiation
We propose that 1D migration under continuous electron irradiation was induced by competition of the induction and suppression effects: the 1D migration behavior
reflected the relative strength of the two effects. With increasing irradiation temperature, the suppression effect increased, although the induction effect did not change much, which caused a decrease in the 1D migration frequency. Under electron irradiation at elevated temperatures, solute elements became segregated around SIA clusters with continuous disturbance by the interatomic mixing effect. At a late stage of irradiation, because of a balance between segregation and dissolution, the distribution of solute elements might reach a steady state, probably forming moderate segregation around SIA clusters. It might provide the steady state frequency of 1D migration observed in Figure 9(b).
4.3. Segregation of solute elements
Diffusion coefficients of interstitial carbon in austenitic stainless steels 304, 347, and 316 were reported from measurements of depth profiles of carbon-14 concentration after diffusion anneal with the surface source in the temperatures of 723–1473 K [20]. Activation energies for carbon diffusion are 1.6–1.9 eV. They are larger than that in γ-iron: 1.5 eV. Simple extrapolation yields the average diffusion length of carbon in SUS316 of 0.35, 11, and 130 nm during annealing for 1200 s at 473, 573, and 673 K,
respectively. The carbon diffusion coefficient associated with the model proposed in the previous section cannot explain the suppression of 1D migration in SUS316L after annealing in the wide temperature range 300–673 K, especially in the lower temperature regime.
However, mechanical properties of austenite show carbon migration at low temperatures [21]. In Fe-Ni-C alloys, carbon-based strain aging has apparent activation energy around 0.9 eV. The lowest temperature stage is at room temperature to as low as 237 K [22]. Furthermore, heavily cold-worked SUS316L exhibits a large increase in strength after long-term aging at room temperature and above [21]. For interpreting the overall multistage strain aging processes, carbon-vacancy pairs are important factors. They migrate at low temperatures, reflecting low activation energy for vacancy migration. Furthermore, internal friction experiments reported strong binding around 0.4 eV for carbon-vacancy pairs in austenite [21]. The proposed mechanism for suppression of 1D migration resembles the conventional strain aging mechanism. Therefore, we expect that carbon-vacancy pairs were formed under electron irradiation and were migrated to SIA clusters at temperatures higher than 300 K to pin them down.
The present experimentally obtained results demonstrated that segregation of substitutional solute elements as well as interstitial solute elements pins down SIA clusters. The segregation of substitutional elements in austenitic stainless steel induced by electron irradiation was reported using HVEM and energy dispersive X-ray
spectrometry (EDS) [23,24]. Undersized silicon exhibits strong enrichment near grain boundaries over a wide temperature range [23] because silicon migrates quickly as mixed dumbbells to point defect sinks [25,26]. Oversized manganese migrates by a vacancy exchange mechanism, which engenders depletion at point defect sinks [24–26]. Larger mobility of silicon than manganese is expected to be responsible for the stronger suppression effect of silicon observed in Figure 6. Segregation around dislocation loops was detected with a three-dimensional atom probe (3D-AP). For example, in SUS304 irradiated with 2 MeV protons to a dose of 5 dpa at 633 K, the concentrations of undersized nickel (7.9) and silicon (1.3) changed by about +2 and +2.5 at.%
respectively near dislocation loops. Oversized chromium (19.3) and manganese (1.4) change respectively by about -3.5, and -0.2 at.% (values in the parentheses are matrix concentrations in atomic percent) [27].
However, we infer that strong enrichment or depletion of substitutional solute elements that was detectable with EDS or 3D-AP is not necessary for the pinning of SIA clusters in concentrated alloys. Numerous substitutional solute atoms exist around SIA clusters. Their redistribution only within the vicinity of a SIA cluster might result in
pinning. According to a simple model for binary alloys, the formation energy of a SIA cluster is given by superposition of interaction energy between the SIA cluster and individual solute atoms [12]. The elastic interaction depends on the strain field around the SIA cluster and the size misfit of the solute atom [28]. For example, an oversized solute copper atom in α-iron has interaction energy of about -0.1 and +0.1 eV in dilatational and compressional cores of SIA clusters, respectively (negative value for attractive interaction) [12]. Consequently, the formation energy of a SIA cluster
depends on the imbalance in the number of solute atoms contained in the two cores. For example, migration of a single solute copper atom from a compressional to dilatational core will reduce the formation energy by 0.2 eV. Such a redistribution of more than 10 solute atoms around a SIA cluster is expected to result in pinning of the SIA cluster without long-range diffusion.
Finally, it is worthwhile to repeat that segregation of substitutional solute elements attributable to electron irradiation at elevated temperatures always involves dissolution because of interatomic mixing. We assume that suppression effects attributable to segregation of substitutional solute elements were masked by those of interstitial solute elements in SUS316L, probably because of slower segregation, smaller magnitude of the suppression effect, or faster dissolution of substitutional elements than interstitial elements.
4.4. Comparison with other alloys
In iron-based bcc alloys, the 1D migration frequency at elevated temperatures decreases to less than one-tenth of that around 300 K. In high-purity model alloy Fe-9Cr, the frequencies are, respectively, 0.12 and 0.01 s-1
at 295 and 375 K [6]. Hamaoka et al. [8] reported that the frequency in A533B (pressure vessel steel for light water reactors) is 0.017 and 0.001 s-1
at 300 and 563 K, and inferred the suppression caused by segregation of interstitial solute elements. They contrast with the present results: the respective frequencies were 0.02 and 0.01 s-1
at 300 and 673 K in SUS316L. Another difference is the recovery rate of 1D migration frequency after annealing for 1200 s at 673 K. In A533B, the recovery starts around 200 s. The frequency at 350 s is still lower than that before the annealing [8]. In contrast, Figures 3(b) and 4(d) showed that the recovery in SUS316L started around 10 s and saturated around 50 s. The difference is not attributed solely to the irradiation condition. Both experiments were conducted using the same 1250 kV HVEM with minor differences in the beam intensity and the damage rate: 3 × 1024
e m-2 s-1 yields 0.02 dpa s-1 for A533B (Ed = 20 eV) [8], and 7 × 10 24 e m-2 s-1 yields 0.013 dpa s-1
According to the model proposed in Section 4.2, the two differences are both attributable to the lower efficiency of the suppression effect in SUS316L than in A533B because the efficiency of interatomic mixing is not expected to depend strongly on whether the material is A533B or SUS316L, or on the irradiation temperature. In contrast, the efficiency of the suppression effect will depend on the amount of
interstitial solute atoms available for the pinning and on the binding energy between a single interstitial solute atom and a SIA cluster. The concentration of interstitial solute elements in A533B was 0.19C, 0.010N, and 0.004O (mass %) [8]. That in SUS316L is presented in Table 1. The large carbon concentration in A533B might be the primary reason for the strong suppression effect, although the carbon concentration in solution remains unknown. Moreover, we point out another possibility that a smaller suppression effect in SUS316L resulted also from smaller binding energy between an SIA cluster and an interstitial solute atom in austenitic steels.
5. Conclusions
We studied mechanisms of 1D migration of SIA clusters in concentrated alloys at elevated temperatures using in situ observation of SUS316L and its model alloys with a high-voltage electron microscope. The detailed conclusions are the following.
1) In SUS316L, annealing of SIA clusters at elevated temperatures decreased the 1D migration frequency at the early stage of the subsequent electron irradiation at 300 K. The frequency was recovered by prolonged electron irradiation.
2) In the high-purity model alloy Fe-Cr-Ni, neither annealing nor short-term electron irradiation decreased the 1D migration frequency. Addition of the interstitial solute elements carbon or oxygen to the model alloy decreased the frequency after annealing. Addition of minor substitutional solute elements silicon or manganese did not decrease the frequency after annealing but after short-term electron irradiation at elevated
temperatures. The decreased frequency was recovered by prolonged electron irradiation. 3) The1D migration suppression was attributable to pinning of SIA clusters by solute elements segregated around the clusters, and to the recovery to dissolution of the segregation by interatomic mixing under electron irradiation. The suppression of 1D migration in SUS316L was apparently caused by the segregation of interstitial solute elements.
4) In SUS316L, 1D migration was induced by continuous electron irradiation at elevated temperatures as well as at 300 K. The frequency at 673 K was proportional to the irradiation intensity. It was about half that at 300 K, which is in contrast to the frequency decrease to less than one-tenth reported for iron-based bcc alloys. The
distribution of 1D migration distance at 673 K was similar to that at 300 K. 5) We proposed that 1D migration was induced by electron irradiation through competition between the induction effect attributable to interatomic mixing and the suppression effect attributable to solute segregation. The induction effect is not expected to depend strongly on the irradiation temperature, although the suppression effect is expected to be large at elevated temperatures where solute elements are segregated to SIA clusters. The suppression effect in SUS316L is expected to be smaller than that in the iron-based bcc alloys.
Acknowledgements
We are grateful to Messrs. E. Aoyagi and Y. Hayasaka of the High Voltage Electron Microscopy Center at Tohoku University, and to Messrs. S. Ohta, H. Oosaki and S. Takakuwa of JEOL Ltd. for technical support in the electron irradiation experiments at Tohoku University and Nagoya University, respectively. We also thank Dr. T. Ashino and Mr. H. Shimada of the Analytical Research Core for Advanced Materials, Institute for Materials Research, Tohoku University for impurity analysis of the specimens. This work was supported in part by a Grant-in-Aid for Scientific Research (No. 21560868) of the Ministry of Education, Culture, Sports, Science, and Technology of Japan (MEXT); and “Collaborative Research Station of High-Voltage Electron Microscopy (MEXT)” and “Advanced Characterization Nanotechnology Platform, Nanotechnology Platform Program (MEXT)” of the High Voltage Electron Microscope Laboratory at Nagoya University.
References
[1] A.J.E. Foreman, W.J. Phythian, C.A. English, Philos. Mag. A 66 (1992) pp.671-695. [2] A.F. Calder and D.J. Bacon, J. Nucl. Mater. 207, 25 (1993) pp.25-45.
[3] B.N. Singh, A.J.E. Foreman, Philos. Mag. A 66 (1992) pp.975-990.
[4] H. Trinkaus, B.N. Singh, A.J.E. Foreman, J. Nucl. Mater. 206 (1993) pp.201-211. [5] T. Hayashi, K. Fukumoto and H. Matsui, J. Nucl. Mater. 307-311 (2002)
pp.993-997.
[6] K. Arakawa, M. Hatanaka, H. Mori and K.Ono, J. Nucl. Mater. 329-333 (2004) pp.1194-1198.
[7] T. Hamaoka, Y. Satoh and H. Matsui, J. Nucl. Mater. 433 (2013) pp.180-187. [8] T. Hamaoka, Y. Satoh and H. Matsui, J. Nucl. Mater. 399 (2010) pp.26-31. [9] Y. Satoh, H. Abe and S.W. Kim, Philos. Mag. 92 (2012) pp.1129-1148. [10] Y. Satoh, H. Matsui and T. Hamaoka, Phys. Rev. B 77 (2008) p.094135.
[11] Y. Satoh and H. Matsui, Philos. Mag. 89 (2009) pp.1489-1504.
[12] Y. Satoh, H. Abe and T. Matsunaga, Philos. Mag. 93 (2013) pp.1652-1676. [13] Y. Satoh, H. Abe and T. Matsunaga, Philos. Mag. 94 (2014) pp.2170-2187. [14] O.S. Oen, unclassified report ORNL-4897, USAEC, 1973.
[15] T. Yoshiie, S. Kojima, Y. Sato, N. Yoshida, M. Kiritani, J. Nucl. Mater. 133&134 (1985) pp.390-394.
[16] H. Watanabe, A. Aoki, H. Murakami, T. Muroga, N. Yoshida, J. Nucl. Mater. 155&157 (1988) pp.815-822.
[17] N. Yoshida, J. Nucl. Mater. 174 (1990) pp.220-228.
[18] R. Schibli, R. Schäublin, J. Nucl. Mater. 442 (2013) pp.S761-S767.
[19] M. Horiki, S. Arai, Y. Satoh, M. Kiritani, J. Nucl. Mater. 255 (1998) pp.165-173. [20] R.P. Agarwala, M.C. Naik, M.S. Anand, and A.R. Paul, J. Nucl. Mater. 36 (1970)
pp.41-47.
[21] J.A. Slane, C. Wolverton, and R. Gibala, Metall. Mater. Trans. A 35 (2004) pp.2239-2245.
[22] K.S.B. Rose and S.G. Glover, Acta Metall. 14 (1966) pp.1505-1516. [23] K. Nakata and I. Masaoka, J. Nucl. Mater. 150 (1987) pp.186-193.
[24] T. Kato, H. Takahashi and M. Izumiya, J. Nucl. Mater. 189 (1992) pp.167-174. [25] A.D. Marwick, J. Phys. F: Metal Phys. 8 (1978) 1849-1861.
[26] P.R. Okamoto and L.E. Rehn, J. Nucl. Mater. 83 (1979) pp.2-23. [27] Z. Jiao, G.S. Was, Acta Mater. 59 (2011) pp.1220-1238.
Table 1. Results of chemical analysis of the specimens (mass %). See ref. [9] for concentrations of the other elements in the specimens denoted with *.
Cr Ni Si Mn H C N O SUS316L* 17.5 12.4 0.55 1.60 0.0003 0.0103 0.0302 0.0018 Fe-Cr-Ni* 18.0 13.2 <0.05 <0.02 0.0002 0.0006 0.0001 0.0007 Fe-Cr-Ni-0.002C NA NA NA NA <0.0001 0.0015 <0.0001 0.0001 Fe-Cr-Ni-0.006C NA NA NA NA <0.0001 0.0063 <0.0001 0.0003 Fe-Cr-Ni-0.012C* 17.8 13.1 <0.05 <0.02 <0.0001 0.0120 <0.0001 0.0001 Fe-Cr-Ni-0.004O 17.9 13.3 <0.05 <0.02 <0.0001 0.0002 0.0002 0.0036 Fe-Cr-Ni-0.55Si 17.9 13.1 0.55 <0.02 <0.0001 0.0009 0.0004 0.0001 Fe-Cr-Ni-1.56Mn 17.9 13.1 <0.05 1.56 0.0001 0.0007 0.0003 0.0003 Fe-Cr-Ni-1.56Mn-0.003O* NA NA NA NA <0.0001 0.0001 0.0002 0.0033
Figure 1. Temperature-irradiation history for examining effects of annealing (t2=0s) or short-term irradiation (t2=10 or 30 s) at temperature T2 (from 300 to 673 K) on 1D migration of SIA clusters in the subsequent electron irradiation at 300 K.
Figure 2. Defect structural evolution in SUS316L under electron irradiation at 300 K (in the third step in Figure 1) after annealing for 1200 s at 300 and 673 K (in the second step). 7×1024
e m-2 s-1
Figure 3. Time evolutions of (a) the number of observed SIA clusters and (b) the 1D migration frequency under irradiation at 300 K after annealing for 1200 s at 300 and 673 K. The reference is continuous electron irradiation at 300 K shown with the offset time of 120 s that compensates the irradiation in the first step. 7×1024
e m-2 s-1
Figure 4. Comparison of 1D migration of the selected SIA clusters after annealing for 1200 s between 300 and 673 K. (a)(b) Distribution of occurrence of 1D migration events (symbols) in the period that the SIA cluster was traceable (horizontal bars). (c)(d) Time evolutions of the number of traced SIA clusters and the 1D migration frequency. The frequency was shown while more than 25 clusters were traced. (e)(f) Distribution of 1D migration distance. 1D migration with distance of less than two pixels (shaded region) was ignored in the measurement. SUS316L, 7×1024
e m-2 s-1
Figure 5. 1D migration frequency at 15 s from the start of electron irradiation at 300 K, after annealing for 1200 s at 300 K (white bars), 673 K (shaded bars), and 673 K with short-term irradiation for 10 s (black bars). Each bar corresponds to an individual experimental run. 7×1024
e m-2 s-1
Figure 6. 1D migration frequency at 15 s from the start of the irradiation at 300 K, after annealing for 1200 s (t2=0s), and after annealing for 1200 s with short-term irradiation (t2=30 s), as a function of the annealing temperature T2. Each symbol corresponds to an individual experimental run. 7×1024
e m-2 s-1
Figure 7. Time evolution of the 1D migration frequency under irradiation at 300 K in the third step. (a) Fe-Cr-Ni-0.012C after annealing for 1200 s at 300, 473, or 673 K. (b) Fe-Cr-Ni-0.55Si after annealing at 673 K for 1200 s with electron irradiation for 0, 10, or 30 s. 7×1024 e m-2 s-1, 1000 kV.
Figure 8(a). Defect structural evolution in SUS316L under irradiation at three temperatures. 7×1024
e m-2 s-1
Figure 8(b). Examples of dynamic behavior of SIA clusters in SUS316L under electron irradiation at 673 K. Times from the start of electron irradiation are shown. SIA clusters that induced 1D migration, sudden appearance, and sudden disappearance are denoted respectively as ‘m’, ‘a’, and ‘d’ in the frame after the corresponding changes. 7×1024
e m-2
s-1
Figure 9. Time evolutions of (a) the number of observed SIA clusters, (b) 1D migration frequency, and (c) distribution of 1D migration distance in SUS316L under electron irradiation at 300, 473, and 673 K. 1D migration with the distance of less than two pixels (shaded region) was ignored in the measurements. 7×1024
e m-2 s-1
Figure 10. (a) Time evolution of the 1D migration frequency of SIA clusters in SUS316L under electron irradiation at 673 K with different beam intensities. (b) Maximum value of 1D migration frequency shown against irradiation intensity, 1000 kV.
Figure 11. Schematic illustration of the proposed model for 1D migration of SIA clusters in concentrated alloys. The model incorporates interaction of SIA clusters with (a) interstitial and (b) substitutional solute elements during annealing and electron irradiation. Low and high temperatures respectively show that the solute elements were thermally mobile and immobile.
![Table 1. Results of chemical analysis of the specimens (mass %). See ref. [9] for concentrations of the other elements in the specimens denoted with *](https://thumb-ap.123doks.com/thumbv2/123deta/5919211.1051013/20.892.109.780.229.557/results-chemical-analysis-specimens-concentrations-elements-specimens-denoted.webp)