Fluorine and Copper Codoping for High
Performance Li2O-Based Cathode Utilizing
Solid-State Oxygen Redox
著者
Yuta Shimada, Hiroaki Kobayashi, Yoshiyuki
Ogasawara, Mitsuhiro Hibino, Tetsuichi Kudo,
Noritaka Mizuno, Kazuya Yamaguchi
journal or
publication title
ACS Applied Energy Materials
volume
2
number
6
page range
4389-4394
year
2019-05-15
URL
http://hdl.handle.net/10097/00130826
doi: 10.1021/acsaem.9b00574Fluorine and Copper Codoping for High
Performance Li
2
O-Based Cathode Utilizing
Solid-State Oxygen Redox
Yuta Shimada,† Hiroaki Kobayashi*,‡ Yoshiyuki Ogasawara,† Mitsuhiro Hibino,† Tetsuichi Kudo,† Noritaka Mizuno,† and Kazuya Yamaguchi*,†
†Department of Applied Chemistry, School of Engineering, The University of Tokyo, 7-3-1 Hongo, Bunkyo-ku, Tokyo, 113-8656, Japan.
‡Institute of Multidisciplinary Research for Advanced Materials, Tohoku University, 2-1-1 Katahira, Aoba-ku, Sendai, Miyagi, 980-8577, Japan.
ABSTRACT
Transition-metal-doped Li2O cathodes using redox reaction of solid-state oxygen are kinds of
candidate as high capacity cathode materials for lithium-ion batteries. In our previously reported study, copper-doped Li2O (CuDL) exhibited a high charge–discharge capacity of
300 mAh g−1. However, the developed cathode not only exhibited poor cyclability but also
decomposed during charge–discharge cycles. In this study, fluorine and copper were codoped into the Li2O structure by stepwise mechanochemical reaction to create a high performance
cathode with high cyclability. Fluorine-, copper-doped Li2O (F–CuDL) was prepared by the
mechanochemical reaction of Li2O with LiF, followed by a reaction with CuO. The F–CuDL
cathode exhibited a good cycle performance (300 mAh g−1, 30 cycles at a constant current of
50 mA g−1). X-ray diffraction (XRD) and Cu K-edge X-ray absorption near edge structure
(XANES) analyses revealed that F–CuDL does not undergo decomposition even after charge– discharge cycles, revealing that doping with fluorine leads to the stabilization of the CuDL crystal structure.
KEYWORDS
improvement of cyclability, fluorine and copper codoping, Li2O-based cathode, solid-state
1. INTRODUCTION
With the increase in the usage demands of lithium-ion batteries (LIBs) as power sources in electric vehicles and the like, it is imperative to further improve the LIB performance. In particular, cathode materials in LIBs must exhibit a high energy density, long lifetime, and safety. Goodenough et al. reported the practical use of LiCoO2,1 and layered-rock-salt cathode
materials such as LiNi1/3Mn1/3Co1/3O2 (NMC)2 and LiNi0.85Co0.10Al0.05O2 (NCA)3 have been
developed. In cathode materials referred to as “Li-excess oxides” in which a part of the transition metal of layered-rock-salt materials is substituted by lithium, an additional high capacity has been reported via the utilization of charge compensation by oxygen in addition to the transition-metal redox4,5. Recently, cation-disordered rock-salt-type lithium-excess
cathodes are also attracting attention as high-capacity materials.6,7
Since 2014, our group has developed a series of transition-metal-doped Li2O (TMDL)
cathodes, which mainly operate the redox reaction of solid-state oxygen.8 In 2016, Li et al.
have also reported the use of oxygen redox,9 and the utility of Li
2O is expected to increase.
Assuming that the redox reaction of the oxygen species in Li2O proceeds, the reaction is
expressed as shown below in formula (1). In this ideal case, the theoretical capacity and theoretical energy density are 897 mAh g−1 and 2870 Wh kg−1, respectively.
2Li2O ⇄ Li2O2 + 2Li+ + 2e− (2.87 V vs Li/Li+) (1)
Although Li2O is electrochemically inactive, in the materials obtained by replacing the lithium
site of Li2O by 5%–10% of a transition metal (viz. Fe, Co, and Cu),10–12 the redox of the oxygen
species (1) proceeds in a reversible manner, in addition to the redox of the transition-metal dopant. Even when considering the doped transition metal, assuming that the transition metal and all oxygen are involved in the redox reaction, the theoretical capacity of TMDL with the
doping level of 5~10% is 800~880 mAh g−1. Hence, TMDL demonstrates promise as a
high-capacity cathode material.
Among TMDL, copper-doped Li2O ((Li0.8Cu0.08)2O, CuDL) cathode exhibits a high
capacity of 300 mAh g−1.12 In addition, CuDL exhibits advantages in that copper is
cost-effective compared to cobalt and nickel, which are widely used as cathode materials, and that its usage demand is expected to increase. However, the cycle performance of CuDL is poor due to the irreversible decomposition to Li2CuO2. The coordination environment of copper in
CuDL is distorted from tetrahedral to square-planar because of the Jahn–Teller effect of Cu2+
ions, and thus the coordination easily changes to the more stable square-planar coordination to form Li2CuO2 during cycles. It is crucial to improve cyclability via the stabilization of the
coordination environment of copper and/or the crystal structure of CuDL.
LIB cathode materials have been mainly developed by the manipulation of cations in lithium oxides. Recently, the use of different anions has attracted attention. The electronic and crystal structures of compounds with multi-anions are different from those of compounds comprising a single anion because of the differences in charge, ionic radii, and electronegativity of anions.13 These compounds often exhibit excellent properties. For example, the doping of
different anions such as F, Cl, or Br into LIB cathode materials leads to the improvement in the diffusion of Li+ in solids as well as thermal stability.14, 15 In recent years, a cation-disordered
rock-salt oxyfluoride cathode has been examined.16, 17
The performance of TMDL can be improved by the tuning of the electronic state or crystal structure comprising multi-anions. In this study, the cyclability of CuDL was improved by the application of a multi-anions structure. The doping of a different anion into the CuDL framework possibly led to the stabilization of its crystal structure. Using fluorine as the dopant
anion, F-, Cu-doped Li2O (F–CuDL) was successfully synthesized, and its higher cyclability
2. EXPERIMENTAL SECTION
The raw materials and as-obtained samples were handled in an Ar-filled glove box.
Synthesis: F-, Cu-doped Li2O was synthesized via a mechanochemical route using a planetary
ball mill (Premium Line 7, Fritsch). The raw materials and zirconia ceramic balls (3 mmf, 70 g) were added into a zirconia pot (45 mL), and the pot was subjected to rotation at 600 rpm. When Li2O (>99%, Kojundo Chemical Laboratory Co., Ltd.), CuO (>99.9%, Kanto Chemical
Co., Inc.), and LiF (>99.9%, FUJIFILM Wako Pure Chemical Corp.) were treated simultaneously, copper was not doped into Li2O (see the Supporting Information, Figure S1)
but reacted with Li2O to form Li2CuO2. Hence, doping fluorine and copper into Li2O is carried
out by the following stepwise route. First, F-doped Li2O was obtained by the reaction of Li2O
and LiF (600 rpm, 10 h). Second, F-doped Li2O was treated with CuO for doping copper into
the Li2O structure (600 rpm, 20 h). For comparison, CuDL was synthesized according to a
synthetic route reported previously.12
Electrochemical measurements: The obtained samples were mixed with Ketjen black (KB,
Lion Specialty Chemicals) and polytetrafluoroethylene (Dupont-Mitsui Fluorochemicals) in a weight ratio of 75/20/5 and pressed on an Al or Pt mesh to prepare the cathode. For charge– discharge tests, 2032-type coin cells were assembled with a Li metal foil as the anode, a glass filter (GA-55, ADVANTEC) as the separator, and 1 M LiPF6/ethylene carbonate-dimethyl
carbonate (EC–DMC, EC = ethylene carbonate, DMC = dimethyl carbonate, 1:1 by volume, Kishida Chemical) as the electrolyte. Charge–discharge tests were carried out using a charge– discharge system HJ1001SD8 (Hokuto Denko Corp.) at a constant current of 50 mA g−1 at
25 °C. The pressure change in the cell during charging was measured in the same manner as reported previously11 using a cell connected to a pressure gauge and converted into the amount
Characterization: Cu K-edge X-ray absorption spectra were recorded at the Aichi Synchrotron
Radiation Center BL5S2. The samples were sealed in an Al laminate pack under Ar and measured in the transmission mode. The Cu K-edge X-ray absorption spectra were analyzed using the Athena program.18 Powder X-ray diffraction (XRD) patterns were recorded on a
RIGAKU SmartLab system. The sample was mounted on a gas-tight holder with a Be window under Ar. The VESTA program19 and Rietan-FP20 were employed for the XRD pattern
simulation and Rietveld analysis, respectively. For Raman spectroscopy, an NSR-5100 (JASCO) spectrometer was used. The measurement condition included an irradiation laser wavelength of 532 nm, laser power of 0.1 mW, and a measurement time of 10 min, and the data were recorded twice at different points on the sample to avoid sample decomposition. 19F
magic-angle spinning (MAS)-NMR spectra were recorded on an AVANCE 600 system (Bruker). The sample was packed into a zirconia tube (2.5 mmf, 10 mm), and NMR spectra were recorded at 25 kHz MAS.
3. RESULTS & DISCUSSION
3.1. Synthesis and Characterization of F-Doped Li2O and F-, Cu-Doped Li2O
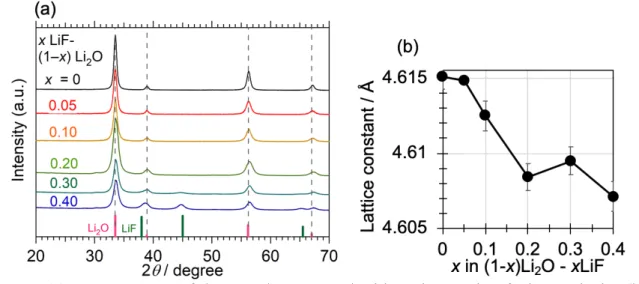
Li2O and LiF were treated in a molar ratio of x = 0–0.40 according to (1 − x)Li2O −
xLiF for doping fluorine into the Li2O structure. In the XRD patterns of the as-obtained samples
(Figure 1a), only peaks corresponding to a Li2O phase were observed in the range of 0 ≤ x ≤
0.20. In the case of x ≥ 0.30, peaks corresponding to residual LiF were observed. With the increase in the LiF ratio, the lattice constant of the Li2O phase decreased, indicative of the
dissolution of fluorine into Li2O (Figure 1b). In the 19F MAS-NMR spectra of the samples with
x = 0.10 and 0.20, peaks were observed on the higher magnetic field side compared to LiF
(Figure S2). The 19F MAS-NMR spectra revealed a different chemical environment for fluorine
compared with that for LiF, confirming the doping of fluorine into the Li2O structure. To
investigate the doping sites of fluorine into the Li2O phase, XRD pattern simulation was carried
out. The possibility of the following two fluorine sites was considered: A) fluorine substituted the O site of Li2O (4a site), and vacancies were formed on the Li site (8c site) for charge
compensation, and B) fluorine was doped into the interstitial site of Li2O (4b site), and
vacancies were formed at the O site. For each case, XRD simulation was carried out at x = 0.20 (Figure S3). The simulated pattern of Case A almost corresponded to the experimental pattern, whereas in Case B, the intensity of the 220 peak corresponding to the Li2O phase at 56° was
greater than that of the 111 peak at 33°, which was not consistent with the experimental result. Furthermore, in the simulated patterns of Case A and in the experiment, the ratio of the 220 peak area to the 111 peak area decreased with the increase in x for x = 0 to 0.20 (Figure S4a). On the other hand, in Case B, the relative area of the 220 peak increased with x, which was not consistent with the experimental result (Figure S4b). In Case A, the decrease in the lattice constant by doping with fluorine was reasonable as the ionic radius of F− is less than that of
(Figure S5). From the above results, fluorine substituted the O site of Li2O, and Li site
vacancies are formed.
Figure 1. (a) XRD patterns of the samples prepared with various ratio of Li2O and LiF, (b)
Lattice constant of Li2O phases in the samples
For copper doping, F-doped Li2O (x = 0.05, 0.10, and 0.15) and CuO were treated with
the proportion of copper in the cation (Cu / (Li + Cu)) is 9%, and the obtained samples were denoted as F5-Cu9, F10-Cu9, and F15-Cu9, respectively. The ratio of copper was aligned with the previously reported CuDL.12 Among the samples, F10-Cu9 exhibited the most desirable
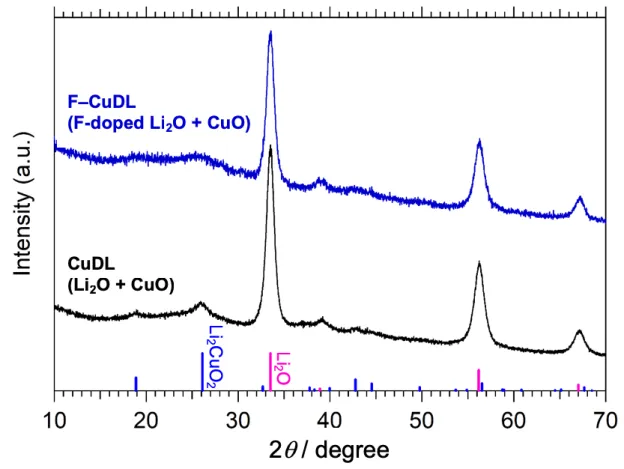
electrochemical property (see the Supporting Information, Figure S6-S8, it was characterized in detail), hereafter F10-Cu9 was denoted as F–CuDL. Figure 2 shows the XRD patterns of as-prepared F–CuDL and CuDL. In both patterns, only peaks corresponding to the Li2O phase
and impurity Li2CuO2 were observed. In the XRD pattern of F–CuDL, the intensity of the
Li2CuO2 peak was as weak as that of the CuDL peak, indicating that a majority of copper is
doped into the Li2O structure. To investigate the local structure around copper, Cu K-edge
X-ray absorption spectroscopy was carried out. Figure 3a shows the XANES spectra of F–CuDL and CuDL; similar XANES spectra were recorded, indicative of the same electronic states of copper in the two samples. Figure 3b shows the XANES pre-edge peak. Copper in the
tetrahedral coordination, e.g., CuCr2O4, exhibited a large peak corresponding to the dipole
transition, whereas copper in the square-planar coordination exhibited a weak peak corresponding to the quadrupole transition. Peaks corresponding to the sample and CuDL exhibited intermediate intensities. Previously,12 the intermediate intensity observed for the
pre-edge peak of CuDL has been thought to be caused by the distorted tetrahedral coordination around copper. As the peak intensities for F–CuDL and CuDL were similar, copper exhibited a distorted tetrahedral coordination in F–CuDL, which was similar to that in CuDL. In addition, the 19F MAS-NMR spectra of F–CuDL exhibited peaks with the same chemical shift as that
observed for F-doped Li2O (x = 0.10), indicating that fluorine remains in the Li2O structure
even after the reaction with CuO (Figure S2).
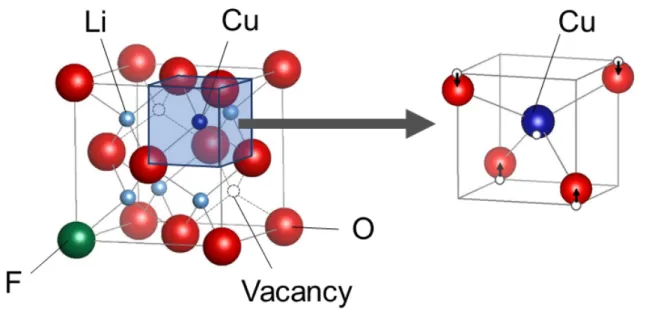
Hence, fluorine and copper are thought to be doped into the Li2O structure. This F–
CuDL exhibited the following structure in which fluorine and copper replaced the oxygen and lithium sites of Li2O, respectively, and the arrangement of copper was distorted from
Figure 2. XRD patterns of the sample obtained from the reaction of F-doped Li2O (x = 0.10)
and CuO and of CuDL.
Figure 3. Cu K-edge XANES spectra. (a) The spectra of CuDL, F–CuDL, and reference
3.2. Charge–Discharge Property of F–CuDL.
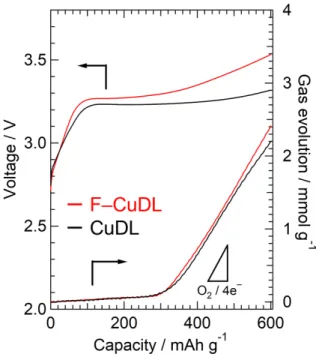
Figure 5 shows the voltage curves of CuDL and F–CuDL and the amount of gas evolved during the first charge. We previously confirmed an evolved gas as oxygen by in-situ gas analysis using quadrupole mass spectrometer in the case with Co-doped Li2O cathode and a
superconcentrated electrolyte,8 and with the cathode and a carbonate ester-based electrolyte
(not shown here). Since structural/electrochemical properties are quite similar among CuDL, F–CuDL, and Co-doped Li2O, the evolved gas in Figure 5 is probably oxygen. The O2 gas
evolution occurred from the cathodes irreversibly during overcharge because of the oxidation of the oxygen species (formula 2) shown below.
2O2− → O2 + 4e− and/or O22− → O2 + 2e−. (2)
Then, the pressure in the cell was monitored to detect the O2 evolved during the first charge at
a constant current of 50 mA g−1. The voltage plateau of F–CuDL was observed at around 3.3 V
which was higher than that of CuDL. This is likely due to the higher electronegativity of fluorine. The same effect was also observed for a rock-salt-type oxyfluoride cathode.16 For
CuDL and F–CuDL, gas evolution was not confirmed until a charging capacity of 300 mAh g−1.
The capacity for the redox of Cu2+/Cu3+ in F–CuDL was 113 mAh g−1; this value is
significantly less than the capacity observed before the gas evolution (300 mAh g−1). Hence,
in addition to the oxidation of copper, the oxidation of the solid-state oxygen species may have proceeded during the charging of F–CuDL, which was similar to that observed for CuDL. This oxidation of the oxygen species will be described later.
Reversible charge–discharge can proceed with the charging capacity where gas evolution does not occur. Charge–discharge cycle tests for F–CuDL and CuDL with a constant current of 50 mAh g−1 were carried out. The charging capacity was maintained constant at
F–CuDL and CuDL, respectively. Figure 7 show change in the discharge capacity of both F– CuDL and CuDL. In the case of CuDL, although charge–discharge with a capacity of 300 mAh g−1 proceeded for the first cycle, the discharge capacity decreased with repetitive
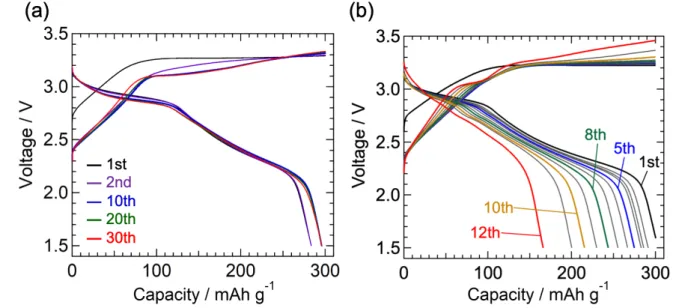
charge–discharge cycles. On the other hand, the charge–discharge cycles of F–CuDL were repeated at least 30 times without the decrease in the discharge capacity, indicative of the drastic enhancement of the cyclability of CuDL by doping with fluorine.
Figure 5. Voltage curves and amount of gas evolved for cells with F–CuDL and CuDL as
Figure 6. Voltage curves of (a) F–CuDL and (b) CuDL during charge–discharge cycles at a
constant current of 50 mA g−1. The charge capacity was maintained constant at 300 mAh g−1,
and discharge was cut off at 1.5 V.
3.3. Detail Investigation of Charge-Discharge Reaction and Structural Change of F– CuDL
The cathode reaction of F–CuDL was analyzed at the first charge–discharge cycle and at the 10th cycle, in which the difference from CuDL became more obvious. The Cu K-edge XANES spectra of F–CuDL was recorded at a charge or discharge of every 100 mAh g−1 to
investigate the redox of copper. Figure 8 shows the Cu edge XANES spectra. The Cu K-edge absorption energy of F–CuDL before charge was similar to those of CuO and Li2CuO2,
indicating that divalent copper is present in F–CuDL similar to that in the raw material. After the first charge, the absorption edge was the same as that of LiCuO2. The absorption edge
shifted to the higher-energy side at the initial stage of charging (~100 mAh g−1), and
subsequently, the spectra did not change, indicative of the formation of O 2p holes at the initial stage of charging.22 In the subsequent discharge process, after a discharge of 100 mAh g−1, the
absorption edge shifted to the lower-energy side and returned to the original position after discharging to 1.5 V. Hence, copper is reduced in the latter stage of discharge to a divalent state on average. The redox reaction of Cu in F–CuDL during the first charge and discharge was the same as that of CuDL.12 The same measurements were conducted at the 10th charge–discharge
cycle. The Cu K-edge absorption energy shifted to the higher-energy side at the start of the 10th charge cycle, which shifted to the lower-energy side during discharge after 100 mAh g−1.
These results revealed that, even after 10 cycles, the redox of copper proceeds in the same manner as that in the first cycle.
To investigate the redox reaction of oxygen, Raman spectra were recorded. Figure 9a shows the Raman spectra of F–CuDL before and after the first charge–discharge cycle. A new peak, corresponding to the symmetric stretching vibration of a peroxide ion,23, 24 was observed
at 820 cm−1 after charge, but it disappeared after discharge. This result confirmed the formation
Raman spectra before and after 10th charge–discharge cycles. The peak at 820 cm−1 was still
observed during the 10th charge cycle, which disappeared after the discharge. Hence, even during the 10th charge–discharge cycles, the redox of oxygen species proceeds in a manner similar to that of the first charge–discharge cycle.
The structural change in F–CuDL and CuDL during cycles was examined. By the comparison of the XRD patterns of CuDL before charge and after the 10th cycle (Figure 10), the intensity of the peaks corresponding to the Li2O phase, which exhibited a high intensity
before charge, decreased after the 10th discharge cycle, and the intensities of the peaks corresponding to Li2CuO2, comprising square-planar CuO4, increased. These results revealed
that CuDL undergoes decomposition during charge–discharge cycles. On the other hand, the peak intensity of the Li2O phase in the XRD patterns of F–CuDL was not significantly changed
even after the 10th cycle, and the increase of the Li2CuO2 peak intensity was much suppressed
in comparison to CuDL. Furthermore, similar Cu K-edge XANES spectra before the first charge cycle and after the 10th discharge cycle (Figure 8b) were observed, suggesting that the coordination environment of copper was almost unchanged, that is, copper was still in the Li2O
structure even after charge–discharge cycles. Thus, F–CuDL does not decompose within at least 10 charge–discharge cycles, indicating that the doping of fluorine leads to the stabilization of the CuDL structure against repetitive charge and discharge.
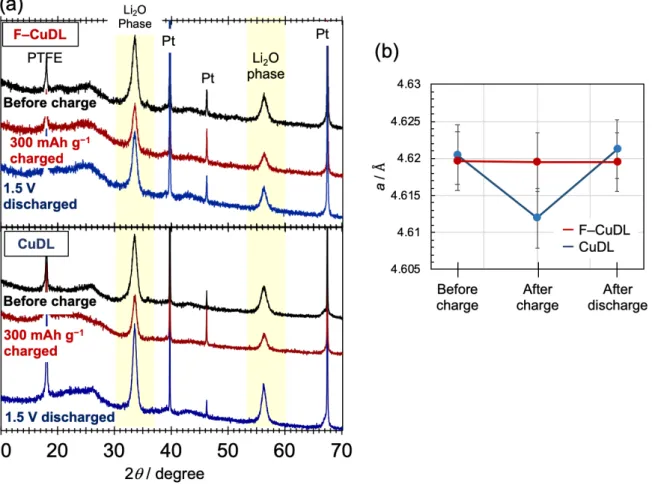
The change in the crystal structure during the first charge–discharge was investigated. Figure 11a shows the XRD patterns of F–CuDL and CuDL before and after charge–discharge. For both cathode materials, the intensity of peaks corresponding to the Li2O phase decreased
during a charge cycle, but it was recovered after a discharge cycle. According to a previous study,12 this behavior was considered to be related to the fact that peroxide is formed and
decomposed during charge and discharge, respectively, and Li2O domains decrease and
both cathodes. Typically, the lattice constant of cathode materials decreases and increases according to the change in the ionic radius of the metal, in addition to the redox of the metal species. In CuDL, the same phenomenon was observed, corresponding to the redox of Cu2+/Cu3+. Since the coordination of copper in CuDL is distorted from tetrahedral to
square-planar because of Jahn–Teller effect of Cu2+ ions, the coordination may change to more stable
square-planar coordination to form Li2CuO2. The lattice parameter change occurred repeatedly
should vary the coordination distance/environment around copper, leading to exceed an activation barrier of the transformation reaction from distorted tetrahedral to more stable square-planar Li2CuO2. On the other hand, the lattice constant of F–CuDL barely changed
through charge and discharge. The reduction of the lattice volume change during charge– discharge was considered to suppress coordination distance/environment change around copper and keep the F–CuDL phase stable, leading to suppress irreversible decomposition into Li2CuO2, and to improve cyclability.
Figure 8. Cu K-edge XANES spectra of F–CuDL measured at every 100 mAh g−1 of charge
Figure 9. Raman spectra of F–CuDL measured (a) during the first cycle and (b) during the
10th cycle.
Figure 11. (a) XRD patterns of F–CuDL and CuDL during the first cycle. (b) The change in
4. CONCLUSIONS
In this study, F-, Cu-doped Li2O (F–CuDL) was synthesized by the mechanochemical
reaction of Li2O, LiF, and CuO. In F–CuDL, F and Cu substituted the O site and the Li site of
Li2O, respectively, and the local structure around Cu exhibited a distorted tetrahedral
coordination similar to CuDL. F–CuDL exhibited a good cycle performance. Charge–discharge cycles with 300 mAh g−1 and a constant current of 50 mA g−1 were repeated. The redox
reaction of Cu2+/Cu3+ (formal valence) and O2−/O
22− proceeded even after charge–discharge
cycles. Decomposition of F–CuDL was much suppressed during charge–discharge cycle, indicating that doping with fluorine leads to the stabilization of the CuDL structure against the charge–discharge cycle. XRD measurements indicated that the change in the lattice constant of the Li2O phase during charge–discharge becomes lower by doping with fluorine, leading to
ASSOCIATED CONTENT
Supporting Information
Experimental and simulated XRD patterns, 19F MAS-NMR spectra, and electrochemical data
(PDF)
AUTHOR INFORMATION
Corresponding Author
* E-mail: [email protected] (H. Kobayashi). * E-mail: [email protected] (K. Yamaguchi).
Notes
The authors declare no competing financial interest.
ACKNOWLEDGMENT
This work was financially supported by JSPS KAKENHI Grant No.15H05797 and Ensemble Grant for young researchers in Tohoku University Research Institutes.
REFERENCES
[1] Mizushima, K.; Jones, P. C.; Wiseman P. J.; Goodenough, J. B. LixCoO2 (0 < x ≤ 1): A
New Cathode Material for Batteries of High Energy Density. Mat. Res. Bull, 1980, 15, 783-789.
[2] Ohzuku T.; Makimura Y. Layered Lithium Insertion Material of LiCo1/3Ni1/3Mn1/3O2 for
Lithium-Ion Batteries. Chem. Lett. 2001, 30, 642-643.
[3] Lee K. K.; Yoon W. S.; Kim K. B.; Lee K. Y.; Hong S. T. Characterization of
LiNi0.85Co0.10M0.05O2 (M = Al, Fe) as a Cathode Material for Lithium Secondary Batteries. J.
Power Sources, 2001, 97, 308-312.
[4] Thackeray, M. M.; Johnson, C. S.; Vaughey, J. T.; Li, N.; Hackney. S. A. Advances in manganese-oxide ‘composite’ electrodes for lithium-ion batteries. J. Mater. Chem. 2005, 15, 2257-2267.
[5] Hy, S.; Liu, H.; Zhang, M.; Qian, D.; Hwang B. J.; Meng, Y. S. Performance and design considerations for lithium excess layered oxide positive electrode materials for lithium ion batteries. Energy Environ. Sci., 2016, 9, 1931-1954.
[6] Yabuuchi, N.; Takeuchi, M.; Nakayama, M.; Shiiba, H.; Ogawa, M.; Nakayama, K.; Ohta, T.; Endo, D.; Ozaki, T.; Inamasu, T.; Sato, K.; Komaba, S. High-capacity electrode materials for rechargeable lithium batteries: Li3NbO4-based system with cation-disordered
rocksalt structure. Proc. Natl. Acad. Sci. U.S.A.,2015, 112, 7650-7655.
[7] Yabuuchi, N.; Nakayama, M.; Takeuchi, M.; Komaba, S.; Hashimoto, Y.; Mukai, T.; Shiiba, H.; Sato, K.; Kobayashi, Y.; Nakao, A.; Yonemura, M.; Yamanaka, K.; Mitsuhara,
K.; Ohta, T. Origin of stabilization and destabilization in solid-state redox reaction of oxide ions for lithium-ion batteries. Nat. Commun., 2016, 7, 13814.
[8] Okuoka, S.; Ogasawara, Y.; Suga, Y.; Hibino, M.; Kudo, T.; Ono, H.; Yonehara, K.; Sumida, Y.; Yamada, Y.; Yamada, A.; Oshima, M.; Tochigi, E.; Shibata, N.; Ikuhara, Y.; Mizuno, N. A New Sealed Lithium-Peroxide Battery with a Co-Doped Li2O Cathode in a
Superconcentrated Lithium Bis(fluorosulfonyl)amide Electrolyte. Sci. Rep., 2014, 4, 5684. [9] Zhu, Z.; Kushima, A.; Yin, Z.; Qi, L.; Amine, K.; Lu, J.; Li, J.; Anion-redox nanolithia cathodes for Li-ion batteries. Nat. Energy, 2016, 1, 16111.
[10] Harada, K.; Hibino, M.; Kobayashi, H.; Ogasawara, Y.; Okuoka, S.; Yonehara, K.; Ono, H.; Sumida, Y.; Yamaguchi, K.; Kudo, T.; Mizuno, N. Electrochemical reactions and cathode properties of Fe-doped Li2O for the hermetically sealed lithium peroxide battery. J. Power
Sources, 2016, 322,49-56.
[11] Kobayashi, H.; Hibino, M.; Ogasawara, Y.; Yamaguchi, K.; Kudo, T.; Okuoka, S.; Yonehara, K.; Ono, H.; Sumida, Y.; Oshima, M.; Mizuno, N. Improved performance of Co-doped Li2O cathodes for lithium- peroxide batteries using LiCoO2 as a dopant source. J.
Power Sources, 2016, 306, 567-572.
[12] Kobayashi, H.; Hibino, M.; Makimoto, T.; Ogasawara, Y.; Yamaguchi, K.; Kudo, T.; Okuoka, S.; Ono, H.; Yonehara, K.; Sumida, Y.; Mizuno, N. Synthesis of Cu-doped Li2O and
its cathode properties for lithium-ion batteries based on oxide/peroxide redox reactions. J.
Power Sources, 2017, 340, 365-372.
[13] Kageyama, H.; Hayashi, K.; Maeda, K.; Attfield, J. P.; Hiroi, Z.; Rondinelli, J. M.; Poeppelmeier, K. R. Expanding frontiers in materials chemistry and physics with multiple anions. Nat. commun., 2018, 9, 772.
[14] Pang, W. K.; Lin, H.; Peterson, V. K.; Lu, C.; Liu, C.; Liao, S.; Chen, J. Effects of Fluorine and Chromium Doping on the Performance of Lithium-Rich Li1+xMO2 (M = Ni, Mn,
Co) Positive Electrodes Chem. Mater., 2017, 29, 10299-10311.
[15] Chen, Y.; Jiao, Q.; Wang, L.; Hu, Y.; Sun, N.; Shen, Y.; Wang, Y. Synthesis and characterization of Li1.05Co1/3Ni1/3Mn1/3O1.95X0.05 (X = Cl, Br) cathode materials for
lithium-ion battery. C. R. Chim., 2013, 16, 845-849.
[16] Takeda, N.; Hoshino, S.; Xie, L.; Chen, S.; Ikeuchi, I.; Natsui, R.; Nakura, K.; Yabuuchi, N. Reversible Li storage for nanosize cation/anion-disordered rocksalt-type oxyfluorides: LiMoO2 – x LiF (0 ≤ x ≤ 2) binary system J. Power Sources, 2017, 367, 122-129.
[17] Lun, Z.; Ouyang, B.; Kitchaev, D. A.; Clément, R. J.; Papp, J. K.; Balasubramanian, M.; Tian, Y.; Lei, T.; Shi, T.; McCloskey, B. D.; Lee, J.; Ceder, G. Improved Cycling
performance of Li-Excess Cation-Disordered Cathode Materials upon Fluorine Substitution.
Adv. Energy Mater., 2018, 1802959.
[18] Ravel, B.; Newville, M. ATHENA, ARTEMIS, HEPHAESTUS: data analysis for X-ray absorption spectroscopy using IFEFFIT. J. Synchrotron Rad., 2005, 12, 537-541.
[19] Momma, K.; Izumi, F. VESTA 3 for three-dimensional visualization of crystal, volumetric and morphology data. J. Appl. Cryst., 2011, 44, 1272-1276.
[20] Izumi, F., Momma, K. Three-Dimensional Visualization in Powder Diffraction. Solid
State Phenom., 2007, 130, 15-20.
[21] Shannon, R. D. Revised Effective Ionic Radii and Systematic Studies of Interatomie Distances in Halides and Chaleogenides. Acta Crystallogr. A, 1976, 32, 751-767.
[22] Arachi, Y.; Nakata, Y.; Hinoshita, K.; Setsu, T. Changes in electronic structure of Li2−xCuO2. J. Power Sources, 2011, 196, 6939-6942.
[23] Eysel, H. H.; Thym, S.; RAMAN Spectra of Peroxides. Z. Anorg. Allg. Chem. 1975,
411,97-102.
[24] Shimada, Y.; Hibino, M.; Ogasawara, Y.; Yamaguchi, K.; Kudo, T.; Okuoka, S.; Ono, H.; Yonehara, K.; Sumida, Y.; Mizuno, N. Analysis of Peroxide Formation during Charge and Discharge in Co-doped Li2O Cathode of Lithium Ion Battery by Raman Spectroscopy