PAPER • OPEN ACCESS
Superconductivity in a new layered
triangular-lattice system Li
2
IrSi
2
To cite this article: K Horigane et al 2019 New J. Phys. 21 093056
View the article online for updates and enhancements.
Recent citations
Electronic, phononic and superconducting properties of trigonal Li2 MSi2 (M = Ir, Rh)
C Tayran and M Çakmak
PAPER
Superconductivity in a new layered triangular-lattice system Li
2
IrSi
2
K Horigane1 , K Takeuchi2, D Hyakumura3, R Horie1, T Sato4, T Muranaka5, K Kawashima3, H Ishii6,
Y Kubozono1 , S Orimo4,7, M Isobe8and J Akimitsu1
1 Research Institute for Interdisciplinary Science, Okayama University, Okayama, Japan 2 Graduate School of natural science and technology, Okayama University, Okayama, Japan 3 Department of Physics and Mathematics, Aoyama Gakuin University, Sagamihara, Japan 4 Institute for Materials Research, Tohoku University, Sendai, Japan
5 Department of Engineering Science, University of Electro-Communications, Tokyo, Japan 6 National Synchrotron Radiation Research Center, Hsinchu, Taiwan
7 WPI-Advanced Institute for Materials Research(AIMR), Tohoku University, Sendai, Japan 8 National Institute for Materials Science(NIMS), Tsukuba, Japan
Keywords: supreconductivity, iridium-silicide, spin–orbit coupling
Abstract
We report on the crystal structure and superconducting properties of a novel iridium-silicide, namely
Li
2IrSi
2. It has a Ag
2NiO
2-type structure
(space group R-3m) with the lattice parameters a=4.028 30
(6) Å and c=13.161 80(15) Å. The crystal structure comprises IrSi
2and double Li layers stacked
alternately along the c-axis. The IrSi
2layer includes a two-dimensional Ir equilateral-triangular lattice.
Electrical resistivity and static magnetic measurements revealed that Li
2IrSi
2is a type-II
super-conductor with critical temperature
(T
c) of 3.3 K. We estimated the following superconducting
parameters: lower critical
field H
c1(0)∼42 Oe, upper critical field H
c2(0)∼1.7 kOe, penetration
depth
λ
0∼265 nm, coherence length ξ
0∼44 nm, and Ginzburg–Landau parameter κ
GL∼6.02.
The specific-heat data suggested that superconductivity in Li
2IrSi
2could be attributed to
weak-coupling Cooper pairs.
1. Introduction
Owing to their unique physical properties, including charge and spin ordering, colossal magnetoresistance, and high-Tcsuperconductivity, 3d transition-metal compounds have attracted considerable attention. These
physical properties emerge from the interplay between spin, charge, and orbital degrees of freedom. On the contrary, 5d transition-metal compounds are expected to exhibit exotic phenomena, because their spin–orbit coupling(SOC) is significantly stronger than that of 3d transition-metal compounds. The non-centrosymmetric superconductivity discovered in CePt3Si[1] and UIr [2] is a typical example of effective physical property
enhancement by SOC, wherein Cooper pairs develop a spontaneous magnetic moment below the
superconducting transition temperature(Tc), breaking the time-reversal symmetry. The superconducting wave
function is described as a mixed-parity state of spin-singlet and triplet Cooper pairs. Another typical case is the spin–orbit Mott state in Sr2IrO4proposed by Kim et al, wherein an effective total angular moment jeff=1/2
Kramers doublet state is produced by an on-site Coulomb repulsion U associated with strong SOC in a 5d electron system[3]. Watanabe et al theoretically predicted that the electron-doped SO Mott state would exhibit
d-wave superconductivity due to the pseudospin of the jeff=1/2 Kramers doublet [4]. In recent angle-resolved
photoemission spectroscopy experiments, d-wave symmetry in the superconducting gap order parameter was observed in electron-doped Sr2IrO4[5]. Therefore, 5d electron systems, particularly in Ir compounds, involve
rich physics, which are interesting research subjects for the exploration of novel exotic superconductivity. Several Ir-based superconductors have been reported till date, which include MIr2As2(M=Sr, Ba, Y, La)
[6–9], Ir1−xPtxTe2[10–12], SrIr2[13], B2IrT2(T=Mo, V) [14], ThIr, MIr2(M=Sc, Y, La), MIr3(M=La, Th,
Ce), MIr5(M=La, Th, Ce), Y3Ir2[15], IrGe [16], M5Ir4Si10(M=Sc, Y, Lu), M5Ir4Ge10(M=Y, Lu) [17–20],
IrTe3[21], MIr2Si2(M=Y, La) [22], and Li2IrSi3[23,24]. Among these superconductors, Sc5Ir4Si10has the
highest Tcof∼8.5 K, which is ascribed to the large density of states (DOS) at the Fermi level (EF) with moderate
OPEN ACCESS
RECEIVED
3 July 2019
REVISED
14 August 2019
ACCEPTED FOR PUBLICATION
4 September 2019
PUBLISHED
24 September 2019
Original content from this work may be used under the terms of theCreative Commons Attribution 3.0 licence.
Any further distribution of this work must maintain attribution to the author(s) and the title of the work, journal citation and DOI.
electron–phonon coupling [25]. In general, Si often reacts with 4d- or 5d-elements (M) to form a variety of
silicide intermetallics because the energy levels of the Si 3p and M 4d or 5d orbitals are close together, resulting in orbital hybridization and unfilled metallic bands near EF. Orbital hybridization generates M-Si covalent bonding
network in the structure. In Sc5Ir4Si10, a Co4Sc5Si10-type structure, the three-dimensional network comprised
an Ir–Si cyclic octagonal lattice. A two-dimensional (2D) network is formed by Ir–Si tetrahedral linkage in LaIr2Si2, a ThCr2Si2-type structure. A metallic state with a large DOS at EFis expected in iridium silicides. This
would be advantageous for the development of new superconductors because large electron densities can lead to Cooper pairing coherency. In fact, several Ir–Si superconductors, such as Sc5Ir4Si10(Tc∼8.5 K), Lu2Ir3Si5
(Tc∼5.6 K), CaIrSi3(Tc∼3.6 K), and HfIrSi (Tc∼3.5 K), have been reported [26–29]. These superconductors
comprised primarily of rare-earth or alkali-earth compounds. To the best of our knowledge, Li2IrSi3(Tc=∼3.8
K) is the only alkali-metal compound reported till date. Therefore, the alkali-metal Ir–Si ternary system is an unexplored subject in new materials research, which motivated us to perform this study.
After numerous attempts to synthesize new alkali-metal iridium silicides, we recently produced a new superconductor, Li2IrSi2, using a high-pressure synthesis technique. Li2IrSi2has a layered structure composed of
planar equilateral triangular Ir lattices and it exhibits a superconducting transition at∼3.3 K. Therefore, Li2IrSi2
is a rare superconductor with a 2D Ir triangular lattice. Its crystal structure, a triangular Ir lattice, is similar to that of IrTe2. However, in contrast to Ir1−xPtxTe2(Tc=∼3.1 K), superconductivity in Li2IrSi2occurs at low
temperatures without breaking chemical bonds[10]. Herein, we report the crystal structure and
superconducting properties of Li2IrSi2and present its superconducting parameters estimated from
experimental criticalfield measurements. We also comment briefly on another new superconductor, Li2RhSi2,
which is isostructural to Li2IrSi2. Furthermore, we discuss the relation between the SOC and superconductivity
in this material.
2. Experimental procedures
Polycrystalline samples of Li2IrSi2were prepared using a solid-state reaction with a high-pressure synthesis
technique. Commercial chemicals, Ir(4N) and Si (4N) powders, and handmade precursor (Li12Si7) were used as
starting materials. The precursor Li12Si7was prepared from a stoichiometric mixture of Li lumps and Si powder
in a solid-sate reaction at 800°C for 30 min, which was post-annealed at 450°C for 16 h in an evacuated quartz tube. The starting materials were mixed in an agate mortar at a molar ratio of Li:Ir:Si=2:1:2 and then pressed into a disk shape with a diameter and thickness of 6.9 and∼3.5 mm, respectively. The chemicals in these procedures were handled in a glove boxfilled with dry argon gas. The pellets were put in a high-pressure cell with a pressure medium of hexagonal boron nitride(h-BN) powder. Then, they were reacted at 1250 °C for 15 min under 3 GPa using aflat-belt-type high-pressure apparatus installed at the National Institute for Materials Science(NIMS) in Japan, followed by quenching to room temperature before pressure release [30].
Powder x-ray diffraction(XRD) data were collected at room temperature using a conventional diffractometer(Rigaku; RINT-TTR III) with Bragg-Brentano geometry and a Cu-Kαradiation source. The collected Bragg peak positions were analyzed using the TREOR97 indexing program[31]. Synchrotron powder
XRD experiments were conducted using a diffractometer equipped with Debye–Scherrer geometry and curved-surface imaging-plate detector installed at the SPring-8 BL12B2 beamline. The incident beam, with a wavelength (λ)=0.6857 Å, was focused in a 250 μm2
size using a toroidal mirror. A capillary with a diameter of 0.5 mm was used for a powder-sample holder. The synchrotron XRD data were analyzed using the Rietveld method with the software RIETAN2000[32].
Magnetic measurements were performed using a superconducting quantum interference device magnetometer(Quantum Design, MPMS-R2). The magnetic data were collected for a pulverized sample encapsulated by nonmagnetic material. Electrical resistivity was measured with the standard DC four-probe method using a commercial apparatus(Quantum Design, PPMS). The excitation current was set to either 1.0 or 5.0 mA. The data were collected at temperatures between 1.9 and 200 K under various magneticfields up to 2 kOe. Specific heat was measured with the PPMS according to the time-relaxation method. The data were collected with a small bulk specimen at temperatures between 2 and 10 K under magneticfields of 0 and 90 kOe.
3. Results and discussion
3.1. Crystal structure
Figure1(a) shows the powder XRD patterns. The top pattern (red) is that of Li2IrSi2sample. The middle(blue)
pattern was a calculated based on the Li2IrSi2phase with the structural model shown infigure2(a) (v.i.). The
bottom(green) pattern is that of the known phase, Li2IrSi3[23,24]. The observed Li2IrSi2pattern(top) could be
reproduced from the calculated pattern(middle), and they were undoubtedly different from that of Li2IrSi3. The
2
Figure 1(a) Powder x-ray diffraction (XRD) patterns of Li2IrSi2. The observed pattern is shown at the top(red circles). The middle
pattern(blue line) was calculated with the structural model shown if figure2(a). The bottom pattern (green line) is an XRD pattern of
Li2IrSi3[23]. (b) Synchrotron XRD pattern of Li2IrSi2 and the Rietveld-analysis profile with the structural model in figure2(a).
Figure 2. Crystal structure models of(a) Li2IrSi2(space group R-3m) and (b) LiIrSi2(R3m). The former includes Li bilayers placed at
XRD pattern observed for the Li2IrSi2sample indicates a new phase, which is not in the PDXL(Rigaku) database.
Majority of the Bragg reflections can be indexed to a trigonal unit cell with lattice parameters a and c as∼4.03 and c∼13.16 Å, respectively. The extinctions are –h+k+l=3n for hkl and l=3n for 00l reflections, where n is an integer. Therefore, the potential space groups are centrosymmetric R-3m(No. 166) and R-3 (148) and non-centrosymmetric R32(155), R3m (160), and R3 (146). Li2IrSi2has rhombohedral symmetry. The sample
also contains a small amount of a secondary phase, non-superconducting IrSi3.
Herein, we propose a crystal structure model for Li2IrSi2with the space group R-3m, which is the group with
the highest symmetry of those mentioned above, as shown infigure2(a). This is the Ag2NiO2-type structure. The
structure model comprised closed-packed stacking of equilateral-triangle lattice planes of Ir, Si, and Li atoms with rhombohedral symmetry. The atomic layer sequence in a period along the c-axis isKIr, Si)-(Li, Li)-(Si, Ir, Si)-(Li, Li)-(Si, Ir, Si)-(Li, Li)-(Si, IrK for the closed-packed positions Ka, (c, a)-(b, c, a)-(b, c)-(a, b, c)-(a, b)-(c, a K, respectively. The structure includes IrSi2layers interleaved with a Li bilayer, stacked alternately along the
c-axis. The IrSi2layer comprises edge-shared IrSi6octahedrons. The Li atom has octahedral(six-fold)
coordination with the adjacent atoms.
Based on the structural model infigure2(a), the atomic coordinates were refined by Rietveld analysis of the
synchrotron XRD data. Figure1(b) shows the synchrotron XRD pattern. A multiphase pattern-fitting method
was used for the analysis of the primary(Li2IrSi2) and secondary (IrSi3) phases. The resultant reliability factors
were Rwp=3.72%, RP=2.46%, and S=Rwp/Re=1.2559, which were satisfactorily low. The mass fraction
of the secondary phase(IrSi3) included in the sample was estimated to be ∼9.3%. We also performed Rietveld
refinement of the Li site occupancy, and we could refine ∼10% of the Li vacancies in the structure. However, our refinement could not determine the thermal factor B (we fixed B=1) which is strongly correlated with the occupancy of atom and the reliability factor of this defect model was nearly identical to that of the non-defect model. The chemical formula thus needs to be confirmed with another method, such as energy dispersive x-ray spectroscopy. For this reason, we do not address Li vacancy quantitatively in this report. The refined structural parameters for Li2IrSi2are listed in table1.
We tested the other space groups R-3, R32, R3m, and R3 to describe the Ag2NiO2-type structural model.
These space groups have a lower symmetry than R-3m. Since the space groups R-3 and R32 give the same structural model as R-3m, these space groups can be excluded from the candidates. The non-centrosymmetric space groups R3m and R3 give a structural model similar to that of R-3m. They give additional structural parameters describing the asymmetry of the atomic position. However, it was found that these space groups did not effectively lower the reliability factors. Therefore, it is unlikely that the space groups R3m and R3 actually describe the structure.
Furthermore, we tested other possible cases of the structural model, which were relates to Li defects in the structure because Li is a volatile and light element and is insensitive to detection by XRD measurements. If the structure contains heavy Li defects, the Li atomic layer may be a monolayer rather than a bilayer. In this case, the atomic layer sequence would beKIr, Si)-(Li)-(Si, Ir, Si)-(Li)-(Si, Ir, Si)-(Li)-(Si, IrK, therefore, the molecular formula is actually LiIrSi2. Figure2(b) illustrates a structural model for the CuCrSe2-NaVS2-type structure
(space group R3m), where Li has a prismatic (six-fold) coordination with adjacent Si atoms. We analyzed the XRD data with this structural model and found that it gave a rather similar XRD pattern to the observed one. However, it was less satisfactory for reliability factors than the Ag2NiO2-type structure. Therefore, it seemed
unlikely that the CuCrSe2-NaVS2-type structural model fully described the actual structure. For LiIrSi2, another
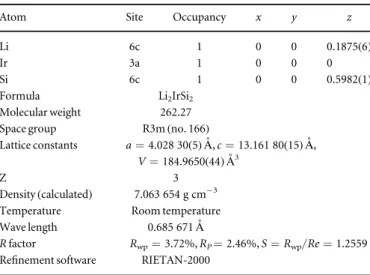
Table 1. Crystal structure parameters of Li2IrSi2.
Atom Site Occupancy x y z
Li 6c 1 0 0 0.1875(6)
Ir 3a 1 0 0 0
Si 6c 1 0 0 0.5982(1)
Formula Li2IrSi2
Molecular weight 262.27 Space group R3m(no. 166)
Lattice constants a=4.028 30(5) Å, c=13.161 80(15) Å, V=184.9650(44) Å3
Z 3
Density(calculated) 7.063 654 g cm−3 Temperature Room temperature Wave length 0.685 671Å
R factor Rwp=3.72%, RP=2.46%, S=Rwp/Re=1.2559
Refinement software RIETAN-2000
4
possible structural model was delafossite-type NaCrS2(R-3m), which had a different stacking manner for the
IrSi2layer block than the CuCrSe2-NaVS2type. We confirmed that the XRD pattern calculated with this
structural model was essentially different from the observed pattern. Therefore, delafossite-type NaCrS2
apparently did not represent LiIrSi2.
Resultantly, we concluded that the structural model with the Ag2NiO2type(space group R-3m) in figure2(a)
was the most suitable for the crystal structure in Li2IrSi2. Li2IrSi2with quasi-2D layer structure, including Ir
equilateral-triangular lattice planes. This structure strongly contrasted with the quasi-1D columnar structure of Li2IrSi3[23,24]. The Ir–Si bond lengths in Li2IrSi2(2.495 Å) and Li2IrSi3(2.463 Å) were nearly the same. The
atomic compositions of the compounds were similar; however, their structures were essentially different. 3.2. Superconducting properties
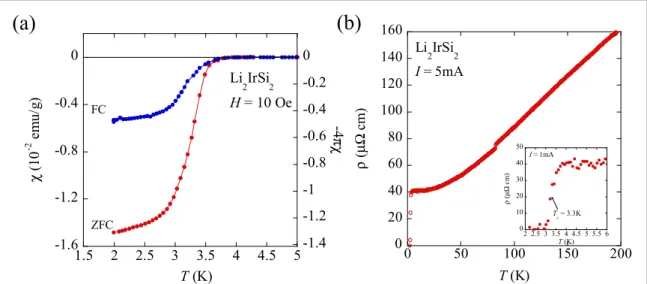
Superconductivity in Li2IrSi2was observed in magnetic and electrical resistivity measurements. Figure3(a)
shows the temperature(T) dependence of the magnetic susceptibility (χ) taken under a magnetic field (H) of 10 Oe. Diamagnetic Meissner signals were observed below 3.6 K(∼Tconset). The magnitude of the superconducting
signal at 2 K was∼47% of the full Meissner volume fraction (−1/4π) for the field-cooling (FC) condition and ∼131% for zero-field-cooling (ZFC). The signal was sufficiently large to indicate that superconductivity was a natural property of the bulk material. The value in excess of 100% suggested that the observed signal was affected by demagnetization and magnetic penetration under the magneticfield.
Figure3(b) shows the T-dependence of the electrical resistivity (ρ) of Li2IrSi2. The T-dependence between 4
and 50 K in the normal state followed the T-square law,ρ=ρ0+AT2, suggesting Fermi-liquid behavior. The
inset infigure3shows the low-temperature resistivity data. At∼3.6 K, the resistivity started to drop due to the superconducting transition. The observed critical temperature, Tconset=3.6 K, was consistent with that of the
magnetic susceptibility measurements. The bulk Tcdefined as the midpoint of resistive transition was 3.3 K.
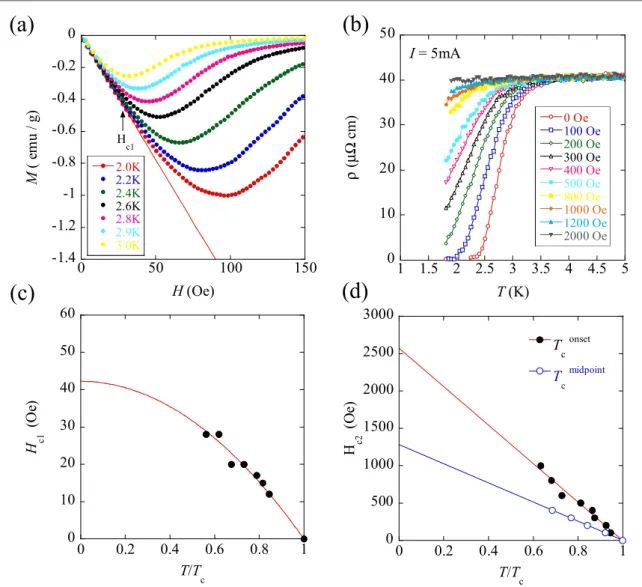
Figure4(a) shows initial magnetization (M–H) curves measured at various temperatures below Tconset
(=3.6 K), which exhibited type-II superconductor behavior. The lower critical field Hc1(T) at each temperature
was defined as the magnetic field at which the magnetization began to deviate from the straight line tangent to the curve at H=0 in figure4(a). The Hc1values are plotted as a function of temperature infigure4(c). Based on
the Ginzburg–Landau (GL) theory, the Hc1(T) curve was numerically fitted using the following equation:
= -⎪ ⎪ ⎧ ⎨ ⎩ ⎛ ⎝ ⎜ ⎞⎠⎟⎫⎬ ⎭ ( ) ( ) ( ) H T H T T 0 1 , 1 c c c 1 1 2
where Hc1(0)=42 Oe. Figure4(b) shows the T-dependence of the electrical resistivity below 5 K under various
magneticfields. The onset and midpoint Tcvalues are plotted as a function of the magneticfield in figure4(d).
Hc2(T) monotonically increased with decreasing temperature. The upper critical fields Hc2(0) determined from
the linear extrapolation of the observed onset and midpoint Tcdata were estimated to be∼2.6 and 1.28 kOe,
respectively. To determine Hc2more precisely, we measured the specific-heat in this system.
Figure5shows the specific-heat data for Li2IrSi2, specifically Cp/T versus T2plots measured at H=0 and 90
kOe. At H=0, a specific-heat jump was observed around ∼3.5 K, indicating that the superconductivity is a bulk property. The phase-transition temperature is consistent with the Tcvalues determined from the electrical
Figure 3(a) Temperature (T) dependence of the magnetic susceptibility (χ) of Li2IrSi2.(b) Temperature dependence of the electrical
resistivity and the magnetic susceptibility measurements. At H=90 kOe, the specific-heat jump disappeared completely. The normal-state specific heat (at H=90 kOe) can be given by
g b = + ( ) C T T , 2 p N 2
whereγNis the Sommerfeld constant of the normal state, andβ is the specific-heat coefficient of the lattice part.
The Debye temperature can be written asΘD=(12π4NR/5β)1/3, where N is the number of atoms in a formula
unit and R is the gas constant. By numericallyfitting the dataset in equation (2), the initial values, γN0andβ0,
werefirst determined. Since γN0andβ0include the contribution from the secondary phase IrSi3, we corrected
the values by subtracting the impurity contribution to estimate intrinsicγNandβ for Li2IrSi2. Herein, we used
the parameters reported in[24] for IrSi3,γN′∼0.73 mJ mol−1K−2andβ∼0.057 mJ mol−1K−4, with a mass
fraction of IrSi3(∼9.3%) in the sample. The resultant parameters intrinsic to Li2IrSi2areγN=4.16 mJ mol−1K2
andβ=0.1868 mJ mol−1K4, i.e.ΘD=373 K.
The thermal criticalfield Hc(0) was estimated by 0.236γNTc2=μ0Hc(0)2/2. The thermodynamic critical
field Hc(0) was ∼0.27 kOe; therefore, the value of Hc2(0) subsequently calculated by Hc(0)2=Hc1(0)×Hc2(0)
was 1.7 kOe. The estimated superconducting coherence lengthξ0was∼44 nm. This is based on
Hc2(0)=Φ0/2πξ02, whereΦ0is thefluxoid quantum (=2.0678×10⁻⁷Gcm2). The London penetration depth
λ0and GL parameterκGLwere determined to be∼265 nm and ∼6.02, respectively. These were obtained the GL
equation, Hc1(0)=[Φ0/4πλ02]×ln(κGL), where κGL=λ0/ξ0. TheκGLvalue(>1) indicates that Li2IrSi2is a
type-II superconductor. The superconducting parameters are listed in table2.
Figure 4(a) Initial magnetization curve (M–H curve) of the superconducting state in Li2IrSi2measured at temperatures below Tconset
(=3.6 K). (b) Temperature dependence of electrical resistivity (ρ) for the superconducting transition of Li2IrSi2, measured under the
various magneticfields. (c) Lower critical field Hc1plotted as a function of normalized temperature(T/Tc). The solid curve indicates
numericalfitting of the data points with equation (1) (see text). (d) The upper critical field Hc2plotted as a function of normalized
temperature(T/Tc). The solid red and blue lines represent linear extrapolation to T=0 K and give Hc2(0)∼2.6 kOe (Tconset) and 1.28
kOe(Tcmidpoint), respectively.
6
Assuming that the conventional phonon-mediated Cooper pairing mechanism is realized in Li2IrSi2, we
evaluated the strength of the electron–phonon coupling. According to McMillan’s theory [33], the electron–
phonon coupling constantλepis written as follows:
* * l m m = + Q - Q -⎛ ⎝ ⎜ ⎞ ⎠ ⎟ ⎛ ⎝ ⎜ ⎞⎠⎟ ( ) ( ) T T 1.04 ln 1.45 1 0.62 ln 1.45 1.04 , 3 ep c c D D
whereμ*is the Coulomb pseudo-potential parameter. By substituting the experimentalΘDvalue(∼373 K) and
standard value ofμ*=0.1 into equation (3), we estimated λep∼0.5, which suggests that Li2IrSi2is a
weak-coupling superconductor. The electronic DOS at the Fermi level N(EF) can be given by as follows:
g p l = + ( ) ( ) ( ) E k N 3 1 . 4 N ep F 2 B2
For Li2IrSi2, by substituting the obtainedγNandλepvalues into equation(4), N(EF) was estimated to be ∼1.2
states/eV/f.u. This value is close to the DOS value (N(EF)∼1.1 states/cell/f.u.) of the Ir–Si superconductor
BaIrSi2(Tc∼6 K) [34].
We are curious how the SOC affects the superconducting properties. From this viewpoint, it is interesting to clarify the relation between the SOC and superconductivity by substituting Rh for Ir in Li2IrSi2. In general, Rh
(4d element) provides more moderate SOC than Ir (5d element). Recently, we succeeded in synthesizing a new
Figure 5 Specific-heat data (Cp/T versus T2plots) for Li2IrSi2collected at 0 and 90 kOe. The solid straight line indicates numerical
fitting of the data points with equation (2) (see text), which gives the Sommerfeld constant (γN,∼4.2 mJ mol−1K2) and the Debye
temperature(ΘD,∼370 K). An enlargement of the plots around Tconset(=3.5 K) is shown in the inset.
Table 2. Superconducting parameters and physical properties in Li2IrSi2. Li2IrSi2 Tc(K) 3.3 Hc1(0) (Oe) 42 Hc2(0) (kOe) 1.7 Hc(0) (kOe) 0.27 λ(0) (nm) 265 ξ(0) (nm) 44 κGL 6.02 γN(mJ mol−1K−2) 4.16 β (mJ mol−1K−4) 0.1868 Θ (K) 373 N(εF) (states/eV/f.u.) 1.76
rhodium silicide superconductor Li2RhSi2that is isostructural to Li2IrSi2. Its critical temperature Tconsetis∼3.0
K, which is a little lower than the Tconset(∼3.6 K) of Li2IrSi2. It is important to clarify whether or not the difference
between the Tcvalues is due to the difference in the SOC of Rh and Ir. Therefore, it is necessary to precisely
evaluate the superconducting parameters and gap structure in Li2RhSi2, which is the focus of further studies that
are now in progress.
4. Summary
We successfully discovered a new Ir–Si superconductor, Li2IrSi2, with Tc=3.3 K. The crystal structure is a
rhombohedral system with the lattice constants a and c of 4.028 30(6) and 13.161 80(15) Å, respectively. We have proposed a structural model with space group R-3m(figure2(a)), which comprises edge-shared IrSi2layers
interleaved with a Li bilayer. The IrSi2layer includes a quasi-2D Ir equilateral triangular lattice as an electron
conduction plane. Superconductivity in Li2IrSi2is type-II and is a bulk property. The superconducting
parameters are as follows: lower criticalfield Hc1(0)∼42 Oe, upper critical field Hc2(0)∼1.7 kOe, penetration
depthλ0∼265 nm, coherence length ξ0∼44 nm, Ginzburg–Landau parameter κGL∼6.02, and electron–
phonon coupling constantλep∼0.5. It seems that Li2IrSi2is a conventional weak-coupling superconductor.
The influence of SOC on its superconductivity is still unclear.
Acknowledgments
This work was supported by Grants-in-Aid from the Ministry of Education, Culture, Sports, Science and Technology(MEXT) under Grants No. 2704, and was partially supported by NIMS Joint Research Hub Program, Research Subsidy from Electric Power Development Co., Ltd(Dengenkaihatsu), and Program for Advancing Strategic International Networks to Accelerate the Circulation of Talented Researchers from Japan Society for the Promotion of Science(R2705).
ORCID iDs
K Horigane https://orcid.org/0000-0003-3338-9115 Y Kubozono https://orcid.org/0000-0002-7910-0308
References
[1] Bauer E, Hilscher G, Michor H, Paul C, Scheidt E W, Gribanov A, Seropegin Y, Noël H, Sigrist M and Rogl P 2004 Phys. Rev. Lett.92 027003
[2] Akazawa T, Hidaka H, Fujiwara T, Kobayashi T C, Yamamoto E, Haga Y, Settai R and Onuki Y 2004 J. Phys. Condens. Matter16 L29
[3] Kim B J et al 2008 Phys. Rev. Lett.101 076402
[4] Watanabe H, Shirakawa T and Yunoki S 2013 Phys. Rev. Lett.110 027002
[5] Kim Y K, Sung N H, Denlinger J D and Kim B J 2016 Nat. Phys.12 37
[6] Wang X C, Ruan B B, Yu J, Pan B J, Mu Q G, Liu T, Chen G F and Ren Z A 2017 Supercond. Sci. Technol.30 035007
[7] Hirai D, Takayama T, Hashizume D, Higashinaka R, Yamamoto A, Hiroko A K and Takagi H 2010 Physica C470 S296
[8] Braun H F, Engel N and Parthé E. 1983 Phys. Rev. B28 1389
[9] Hirjak M, Lejay P, Chevalier B, Etourneau J and Hagenmuller P 1985 J. Less-Common Met.105 139
[10] Pyon S, Kudo K and Nohara M 2012 J. Phys. Soc. Japan81 053701
[11] Ootsuki D et al 2014 J. Phys. Soc. Japan83 033704
[12] Ootsuki D et al 2012 Phys. Rev. B86 014519
[13] Matthias B T and Corenzwit E 1957 Phys. Rev.107 1558
[14] Vandenberg J M, Matthias B T, Corenzwit E and Barz H 1975 Mat. Res. Bull.10 889
[15] Geballe T H, Matthias B T, Compton V B, Corenzwit E, Hull G W and Longinotti L D 1965 Phys. Rev.137 A119
[16] Matthias B T 1953 Phys. Rev.92 874
[17] Sun Y, Ding Y, Gu D, Zhuang J, Shi Z and Tamegai T 2013 J. Phys. Soc. Japan82 074713
[18] Yang H D, Shelton R N and Braun H F 1986 Phys. Rev. B33 5062
[19] Shelton R N, Hausermann-Berg L S, Klavins P, Yang H D, Anderson M S and Swenson C A 1986 Phys. Rev. B34 4590
[20] Hausermann-Berg L S and Shelton R N 1987 Phys. Rev. B35 6659
[21] Raub C J, Compton V B, Geballe T H, Matthias B T, Maita J P and Hull G W 1965 J. Phys. Chem. Solids26 2051
[22] Vališka M, Pospíšil J, Prokleška J, Diviš M, Rudajevová A and Sechovský V 2012 J. Phys. Soc. Japan81 104715
[23] Hirai D, Kawakami R, Magdysyuk O V, Dinnebier R E, Yaresko A and Takagi H 2014 J. Phys. Soc. Japan83 103703
[24] Pyon S et al 2014 J. Phys. Soc. Japan83 093706
[25] Lue C S, Liu R F, Fu Y F, Cheng C and Yang H D 2008 Phys. Rev. B77 115130
[26] Singh Y, Pal D, Ramakrishnan S, Awasthi A M and Malik S K 2005 Phys. Rev. B71 045109
[27] Eguchi G, Wadati H, Sugiyama T, Ikenaga E, Yonezawa S and Maeno Y 2012 Phys. Rev. B86 184510
[28] Xian-Zhong W, Chevalier B, Etourneau J and Hagenmuller P 1985 Mat. Res. Bull. 20 517 [29] NIMS Material Database (Mat Navi)https://mits.nims.go.jp/index_en.html
8
[30] Isobe M, Yoshida H, Kimoto K, Arai M and Takayama-Muromachi E 2014 Chem. Mater.26 2155
[31] Werner P-E, Eriksson L and Westdahl M 1985 J. Appl. Crystallogr.18 367
[32] Izumi F and Ikeda T 2000 Mater. Sci. Forum321–324 198
[33] McMillan W L 1968 Phys. Rev.167 331