Hypoxia within macrophyte vegetation limits
the use of methane-derived carbon by larval
chironomids in a shallow temperate eutrophic
lake
著者
Natsuru Yasuno, Yuki Sako, Shuichi Shikano,
Tetsuo Shimada, Jun Ashizawa, Yasufumi
Fujimoto, Eisuke Kikuchi
journal or
publication title
Hydrobiologia
volume
822
number
1
page range
69-84
year
2018-05-08
URL
http://hdl.handle.net/10097/00125404
doi: 10.1007/s10750-018-3627-7Hypoxia within macrophyte vegetation limits the use of methane-derived carbon
1
by larval chironomids in a shallow temperate eutrophic lake
2
3
Natsuru Yasuno1*, Yuki Sako2, Shuichi Shikano3, Tetsuo Shimada4, Jun Ashizawa5, 4
Yasufumi Fujimoto4, Eisuke Kikuchi6
5
1 Sendai City Government, 3-7-1 Kokubun-cho, Aoba-ku, Sendai, Miyagi, 980-0803,
6
Japan 7
2 Graduate School of Life Sciences, Tohoku University 2-1-1 Katahira, Aoba-ku, Sendai,
8
Miyagi 980-8577, Japan 9
3 Center for Northeast Asian Studies, Tohoku University 41 Kawauchi, Aoba-ku, Sendai,
10
Miyagi 980-8576, Japan 11
4 Miyagi Prefectural Izunuma-Uchinuma Environmental Foundation 17-2 Shikimi,
12
Wakayanagi, Kurihara, Miyagi, 989-5504, Japan 13
5 Society for Shinaimotsugo Conservation, 504-1 Koyachi, Kimazuka Kashimadai,
14
Osaki, Miyagi 989-4102, Japan 15
6 Research Institute for Teacher Training and Development, Miyagi University of
16
Education 149 Aramaki Aza Aoba, Aoba-ku, Sendai, 980-0845, Japan 17
*Corresponding author 18
E-mail [email protected] 19
Running title: methanotrophic food web in vegetation 20
21
Key words: stable isotope; methane-oxidizing bacteria (MOB); floating leaf; lotus; 22
benthos 23
Abstract
25
Methane-derived carbon (MDC) can subsidize lake food webs. However, the trophic 26
transfer of MDC to consumers within macrophyte vegetation is largely unknown. We 27
investigated the seasonality of δ13C in larval chironomids within Nelumbo nucifera 28
(Gaertn.) and Trapa natans var. Japonica (Nakai) vegetation in the shallow, eutrophic 29
Lake Izunuma in Japan. Over the last several years, N. nucifera has rapidly expanded 30
across more than 80% of the lake surface. Prior to the expansion of N. nucifera 31
(2007–2008), a previous study reported extremely low larval δ13C levels with peak
32
sediment methane concentrations in August or September. After the expansion of N. 33
nucifera (2014–2015), we observed extreme hypoxia as low as or lower than 1 mg l-1
34
among the macrophyte coverage during June and August. During August and September, 35
no larvae could be found among N. nucifera and larvae in T. natans showed relatively 36
high δ13C levels (> −40‰). In contrast, larvae were markedly 13C–depleted (down to
37
−60‰) during October and November. The renewed supply of oxygen to the lake 38
bottom may stimulate MOB activity, leading to an increase in larval assimilation of 39
MDC. Our results suggest that macrophyte vegetation can affect the seasonality of 40
MDC transfer to benthic consumers under hypoxic conditions in summer. 41
Introduction
42
Recent studies have provided evidence that methane-derived carbon (MDC) can 43
subsidize food webs in lake ecosystems (Kiyashko et al., 2001; Grey et al., 2004a; Jones 44
et al., 2008; Ravinet et al., 2010; Jones & Grey, 2011). Due to isotopic fractionation 45
during methanogenesis, biogenic methane is typically extremely 46
13C-depleted (−80 to −60‰; Whiticar, 1999) compared with other food sources
47
available to aquatic consumers: allochthonous organic matter (−28 to −26‰; Peterson 48
& Fry, 1987), and autochthnous organic matter (typically ranging from −35 to −25‰; 49
Post, 2002). Isotopic fractionation during the biological oxidation of methane by 50
methane-oxidizing bacteria (MOB) can lead to further isotopic depletion of microbial 51
carbon (Whiticar, 1999). Thus, markedly low δ13C levels in benthic invertebrates 52
(mainly larval chironomids) reflect the assimilation of MDC by these organisms 53
through the consumption of MOB (for a review, see Jones & Grey, 2011, Grey, 2016). 54
The use of MDC by larval chironomids has often been reported in stratified lakes in 55
which oxygen can be depleted near the lake bottom. In contrast, MDC tends to be less 56
assimilated by larvae in shallow lakes where the entire water column is mixed 57
frequently, keeping oxygen in contact with the sediments (Grey et al., 2004b; Jones et 58
al., 2008). However, several studies have indicated that biogenic methane can be an 59
important carbon source for consumers in shallow lakes (Sanseverino et al., 2012; 60
Yasuno et al., 2012; Agasild et al., 2014). 61
Shallow mesotrophic and eutrophic lakes can often present contrasting states: a 62
clear-water state that is dominated by submersed macrophytes, and a turbid-water state 63
that is dominated by phytoplankton (Scheffer et al., 1993; Moss et al., 1994; Hargeby et 64
al., 2007; Scheffer & Jeppesen, 2007). The former is considered to be the pristine state 65
for the majority of shallow lakes, because macrophytes can support a diversity of 66
lacustrine organisms by providing food and habitat (Carpenter & Lodge, 1986; Jeppesen 67
et al., 1998; Scheffer, 1998). Macrophyte vegetation can maintain a clear-water state via 68
various mechanisms including stabilizing sediments, releasing allelopathic substances, 69
and promoting zooplankton populations by providing refuge (Scheffer et al., 1993; 70
Jeppesen et al., 1998; Scheffer, 1998; Hargeby et al., 2004; Hilt & Gross, 2008). As 71
nutrient loads increase, the dominant primary producers can shift from submersed 72
macrophytes to taller submersed species and floating-leaved rooted plants (Wetzel, 73
2001b). Further nutrient loading can result in a regime shift to a state dominated by 74
phytoplankton, although threshold nutrient levels that induce this shift depend on lake 75
size, depth and climate (Scheffer & van Nes, 2007). 76
Aquatic macrophytes can strongly affect dissolved oxygen (DO) concentrations 77
in the water column in shallow waters (Rose & Crumpton, 2006; Yamaki & Yamamuro, 78
2013). Macrophyte vegetation supplies a large amount of detritus to the sediment 79
(Carpenter, 1981), and aquatic macrophytes typically reduce water circulation and 80
sediment resuspension (Dieter, 1990). Decomposition of detritus in the sediment can 81
increase oxygen demand, especially during summer when water temperature increases, 82
thereby depleting DO (Webster & Benfield, 1986). Floating-leaved and emergent plants 83
can prevent gas exchange between the water surface and the air and inhibit primary 84
production by phytoplankton (Frodge et al., 1990; Caraco et al., 2006), resulting in 85
strong oxygen depletion (<1 mg l-1; Turner et al., 2010; Yamaki & Yamamuro, 2013). 86
Low-oxygen conditions in lakes can enhance methane cycles (i.e., methane 87
production and oxidation), resulting in a greater biomass of MOB available for 88
consumption by larval chironomids (Deines et al., 2007b; Gentzel et al., 2012; Hershey 89
et al., 2015). In fact, 13C-depleted larval chironomids have often been reported in lakes 90
in which the oxygen concentration near the lake bottom dropped below 2 mg l-1 in late 91
summer (Jones et al., 2008). Therefore, dense macrophyte vegetation may enhance the 92
trophic transfer of MDC to benthic consumers. In contrast, larval chironomids aestivate 93
under low oxygen conditions (< 1 mg l-1; Hamburger et al., 1994). Anoxia near the lake
94
bottom can restrict microbial methane oxidation and may prevent MOB from 95
multiplying, resulting in relatively small amounts of biomass available to benthic 96
consumers (Jones & Grey, 2011; Child & Moore, 2015). Thus, the effects of aquatic 97
vegetation on the contribution of MDC to benthic consumers appear to be controversial. 98
Complementary studies on the trophic transfer of MDC under the influence of aquatic 99
vegetation will provide a better understanding of food web dynamics and the carbon 100
cycle in wetlands. 101
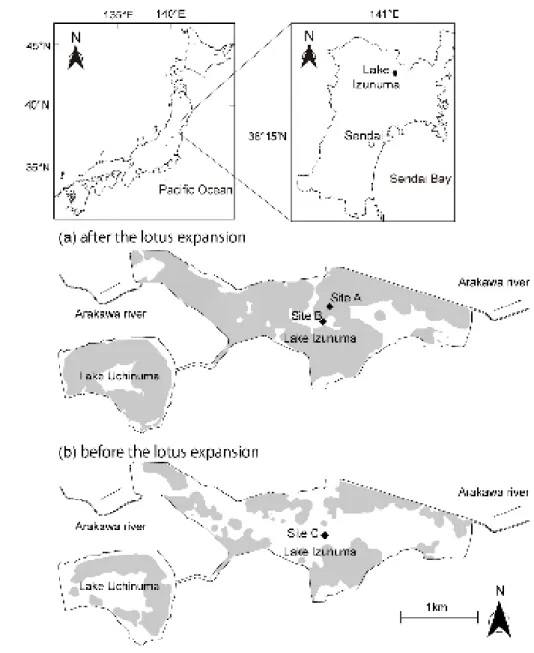
Lake Izunuma is a temperate, eutrophic, and shallow lake in Japan. 102
Approximately 40% of the lake surface was covered by lotus (Nelumbo nucifera) in 103
2007. Since then, the lotus coverage has expanded to cover more than 80% of the water 104
surface (Shikano S., unpublished data, Fig. 1). In addition, floating-leaved plants such 105
as Trapa spp. dominate outside of the lotus vegetation, and open areas are rare. 106
Macrophyte coverage caused extreme depletion of DO during summer (Yasuno et al., 107
2015). Before the expansion of the lotus vegetation, the contribution of MDC to larval 108
Chironomus plumosus L. (Diptera: Chironomidae) peaked simultaneously with the
109
methane concentration in the sediment in August or September. During this time, 110
frequent water circulation supplied oxygen to the sediment surface and DO 111
concentrations above the lake bottom were greater than 2 mg l-1 (Yasuno et al., 2012).
112
However, hypoxia associated with macrophyte vegetation can affect the MDC pathway 113
to benthic consumers positively and/or negatively. Hypoxia may promote microbial 114
methane oxidation and increase the biomass of MOB available to larval chironomids 115
(Hershey et al., 2015). In addition, the accumulation of organic matter derived from 116
macrophytes on the sediment may also promote methane cycles (Chan et al., 2005; 117
Schwarz et al., 2008). In contrast, extreme hypoxia (< 1 mg l-1) or anoxia can render
118
larvae inactive or make the lake bottom too harsh an environment for their survival. 119
Lake Izunuma is thus an ideal site at which to investigate the effects of macrophyte 120
vegetation on the trophic transfer of MDC by comparing isotopic data obtained from 121
larval chironomids before and after the expansion of N. nucifera vegetation. 122
The purpose of this study was to test the following hypotheses: (1) hypoxia 123
associated with macrophyte vegetation limits the use of MDC by benthic consumers 124
during late summer (August) and early autumn (September), and (2) the use of MDC 125
increases in autumn (October or November) when DO is supplied to the sediment-water 126
interface. The results of the current study are compared with those of a previous study 127
(Yasuno et al., 2012) in order to assess the effects of macrophyte vegetation on the 128
trophic transfer of MDC to benthic invertebrates. 129
130
Materials and Methods
131
Study site
132
Lake Izunuma is located in northeastern Honshu, Japan (38°43' N, 141°06' E; Fig. 1). It 133
is a temperate, eutrophic, shallow lake (maximum depth of approximately 1.6 m, area of 134
3.69 km2) situated 6 m above sea level (Shidara, 1992). During summer and early 135
autumn (June and September), a significant part of the water surface is usually covered 136
by the lotus N. nucifera, which is a floating-leaved emergent macrophyte. Other 137
floating-leaved macrophytes, such as Trapa japonica Flerow, Trapa Natans var. 138
japonica Nakai, Nymphoides indica (L.) O. Kuntze, and Nymphoides peltata (S.G.
139
Gmel.) Kuntze have also been identified on the lake surface (The Miyagi Prefectual 140
Izunuma-Uchinuma Environmental Foundation, 2010). The lotus typically undergoes a 141
population cycle in which it is nearly eliminated by the submergence of its floating 142
leaves in flood, followed by a population expansion lasting 15–20 years 143
(Izunuma-Uchinuma Natural regeneration council, 2009). The last flood occurred in the 144
summer of 1998. Since then, water levels have not significantly risen and the lotus 145
population has been continuously expanding. The lotus covered approximately 40% of 146
the water surface in 2007 and 2008. During recent years, the lotus has expanded to 147
cover more than 80% of the water surface and most of the water surface outside of the 148
lotus-covered area has been colonized by other floating-leaved plants (Shikano 149
unpublished data). Lotus on Lake Izunuma begins to wither in October and the withered 150
petioles without leaves often remain until the following spring. The water surface may 151
be covered by ice during winter. C. plumosus dominates the benthic fauna in the 152
profundal zone (Yasuno et al., 2009; Yasuno et al., 2015). Prior to the expansion of lotus, 153
annual averages of total nitrogen were 0.74 mg l-1 in 2007 and 0.89 mg l-1 in 2008, and 154
those of total phosphate were 0.08 mg l-1 in 2007 and 0.10 mg l-1 in 2008 (National
155
Institute of Environmental Studies, 2017). After the expansion of lotus, annual averages 156
of total nitrogen (0.72 mg l-1 in 2014 and 0.68 mg l-1 in 2015) and total phosphate (0.06
157
mg l-1 in 2014 and 0.08 mg l-1 in 2015) slightly decreased (Miyagi Prefecture, 2017), 158
but remained within the range of eutrophic lakes (Wetzel, 2001a). 159
160
Field survey
We conducted surveys at two sites, designated Site A (within an area covered by lotus N. 162
nucifera vegetation) and Site B (within an area dominated by T. natans vegetation),
163
monthly from June to December 2014, and from March to September 2015 (Fig. 1), to 164
compare the effects of lotus and T. natans vegetation on the use of MDC by larval 165
chironomids as well as DO concentrations and methane concentrations in the sediment. 166
Yasuno et al. (2012) surveyed at the same site as Site B, but in the absence of 167
macrophytes, from June 2007 to September 2008. Thus, we designated the site surveyed 168
by Yasuno et al. (2012) as Site C to evaluate the effects of T. natans vegetation on the 169
use of MDC by chironomid larvae. Temperature and DO concentrations were 170
determined at the lake surface and near the lake bottom (10–30 cm above lake bottom) 171
using an HQ30d Portable Optical Dissolved Oxygen Meter (Central Kagaku Corp., 172
Tokyo, Japan). We collected samples of larval chironomids and their potential food 173
sources (particulate organic matter (POM) and sediment) for stable isotope analyses and 174
core samples of sediments to measure methane concentrations. In September 2014 and 175
April 2015, we collected only core samples for methane. In August 2015, we collected 176
samples only for stable isotope analyses. 177
178
Sampling of larval chironomids and their potential food sources
179
Fourth-instar larvae of C. plumosus were collected using an Ekman grab sampler and 180
sieved from the surrounding sediment (mesh size: 1 mm). We used fourth instar larvae 181
of C. plumosus in order to compare our data with those of previous studies that 182
measured δ13C levels in fourth instar C. plumosus (Grey et al., 2004b; Deines et al., 183
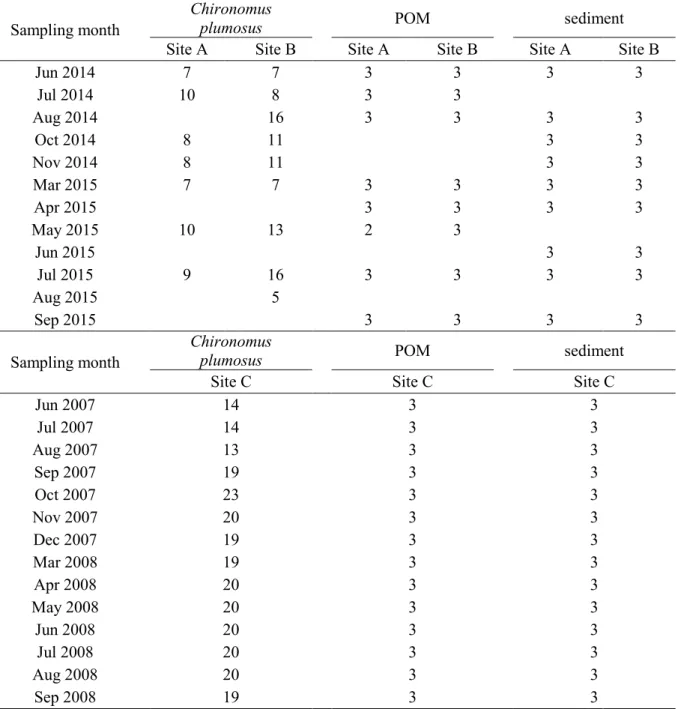
2007b). Ekman grab sampling was repeated at least 20 times per site during each survey. 184
In total, 5–16 larval individuals were collected, except in August and/or September 185
(Table 1). No larvae were collected from Site A in August 2014, August 2015, or 186
September 2015. We did not measure stable isotope ratios of larval chironomids from 187
Site B in September 2015, since we could obtain only one individual. Larvae were 188
transported to the laboratory and maintained alive in filtered lake water for at least 24 h 189
in order to eliminate their gut contents. Fecal matter was removed periodically to 190
prevent coprophagy (Grey et al., 2004b). Larvae were freeze-dried (24 h), ground and 191
homogenized using an agate mortar and pestle, and treated with a chloroform–methanol 192
mixture (2:1 by volume) to remove lipids (Yoshii et al., 1999), which are depleted in 13C
193
compared to proteins and carbohydrates (Deniro & Epstein, 1977). The samples were 194
then concentrated onto GF/C glass filters (precombusted at 500°C for 2 h; Whatman, 195
Florham Park, NJ, USA) and freeze-dried. Surface sediment was collected using an 196
Ekman grab sampler. We collected three replicates of surface lake water for POM 197
samples. The samples were preserved in crushed ice and transported to the laboratory. 198
Sediment samples were dried (60°C, 24 h) and treated with 1 N HCl, washed with 199
distilled water, dried in a 60°C oven (24 h), ground, homogenized, and subjected to 200
stable isotope analyses. 201
202
Stable isotope analyses
203
Stable isotope ratios were determined with a mass spectrometer (Delta V Advantage; 204
Thermo Electron Corp., San Diego, CA, USA) connected to an elemental analyzer 205
(Flash 2000; CE Instruments Ltd., Wigan, UK). Stable isotope ratios are represented 206
using the standard delta notation, 207
208
δ13C or δ15N = (Rsample/Rstandard − 1) × 1,000 (‰),
210
where R = 13C/12C or 15N/14N. We report isotopic values relative to the following 211
standards: Pee Dee belemnite for δ13C and nitrogen gas for δ15N. The analytical error
212
was within ±0.1‰ for carbon and ±0.2‰ for nitrogen. 213
214
Sediment methane concentrations
215
To measure methane concentrations in sediments, three sediment cores were collected 216
using a long pipe equipped with a PVC column (5-cm diameter). Approximately 5 mL 217
of sediment subsample were collected from each section of sediment core, 0–1 cm and 218
5–6 cm, at both sites. The two subsamples from each of three different cores were put 219
into 50-mL gastight vials (SVG-50; Nichiden-Rika Glass Co., Ltd., Tokyo, Japan) that 220
had been prefilled with approximately 30 mL of water aerated with N2 gas. The vials
221
were then closed with butyl rubber stoppers. The gastight vials containing sediment 222
samples were then transported to the laboratory and weighed. Prior to adding the 223
sediment sample, the assembled vials, butyl rubber stoppers, and water were 224
pre-weighed. After loading with sediment, the gas vials were shaken by hand for at least 225
3 min to establish equilibrium between the gas and water phases. The vials were flushed 226
with nitrogen gas, forcing gaseous methane into a syringe that was connected to the 227
rubber stopper with a tube. The syringe was left for 5 min to equilibrate the gas and the 228
atmosphere, and the volume of gas was recorded. Methane was analyzed by gas 229
chromatography (GC-8; Shimadzu, Kyoto, Japan). Methane concentrations were 230
calculated as the mass of carbon in methane per mass of wet sediment (µg g-1; CH4-C
231
wet sediment-1). In addition, the difference in methane concentrations between sediment
232
layers collected at 0–1 cm and 5–6 cm (ΔCH4) was used to estimate the intensity of
biological methane oxidation. ΔCH4 was calculated for each core sample.
234
235
Data analysis
236
The methane concentrations in the two sediment layers (0–1 cm and 5–6 cm) and ΔCH4
237
were compared between the three sites and at different months using two-way ANOVA. 238
Post hoc analyses of differences among the three sites were conducted using Tukey’s 239
HSD test. The methane concentration at Site C in December was not used for two-way 240
ANOVA because we did not survey at Sites A and B in December 2014. Linear models 241
were used to evaluate the influence of physicochemical conditions on δ13C values in 242
larval chironomids. Although ΔCH4 was considered a measure of methane production
243
and oxidation, ΔCH4 depends strongly on methane concentrations in the 0–1 cm and
244
5–6 cm layers. DO above the lake bottom correlated with water temperature at all sites 245
(P < 0.01). Thus, we used ΔCH4 and DO above the lake bottom as physicochemical
246
conditions in linear models. To avoid multicollinearity, we did not consider the 247
relationships between methane concentrations in the 0–1 cm and 5–6 cm layers and 248
water temperatures above the lake bottom. We used the statistical package R 3.5.0 (R 249
Development Core Team, 2017) for all of the statistical analyses. 250
251
Results
252
Seasonal changes in water depth, temperature, and DO concentrations
253
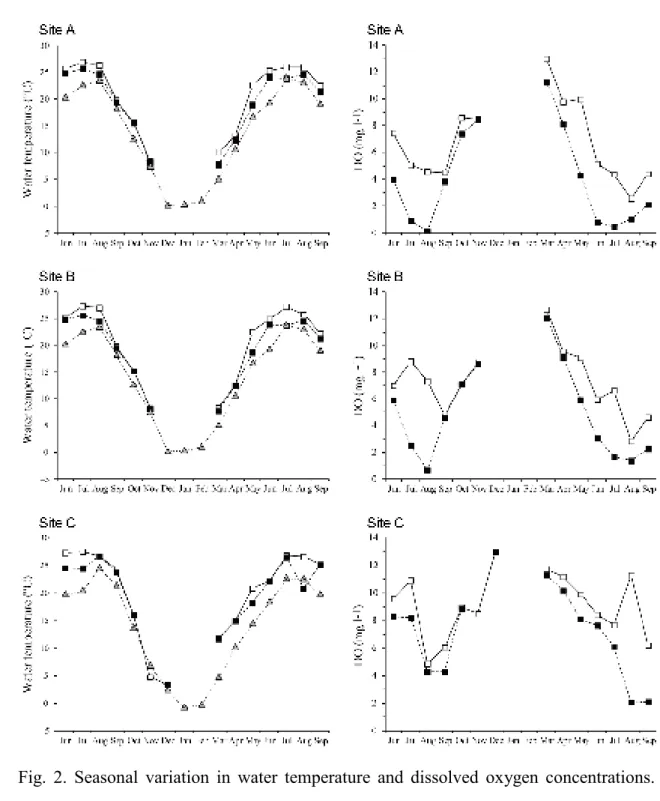
At Sites A and B, seasonal changes in water depth, temperature, and DO concentration 254
were measured from June 2014 to September 2015. The water depth was generally 255
shallow, fluctuating from 100 to 160 cm at Site A and from 100 to 170 cm at Site B 256
during June 2014 to August 2015. In September 2015, the water level was abnormally 257
high, reaching 205 cm, due to several days of heavy rain prior to sampling. In fact, 258
monthly precipitation in September was clearly higher (349 mm) than that in other 259
months (24 mm to 215 mm) (data from Japan Meteorological Agency, 2017, see 260
supplementary material). Water temperatures at the surface and bottom of the lake 261
tended to be slightly higher than the average monthly air temperature throughout the 262
period of this study (Fig. 2). Differences in water temperature between the surface and 263
bottom of the lake tended to be small at both sampling sites, but oxygen stratification 264
often occurred (Fig. 2). Oxygen concentrations above the lake bottom were depleted at 265
Sites A and B in summer and were as low as or less than ca. 2 mg l-1 at both sampling 266
sites from July to August in 2014, at Site A from June to September in 2015, and at Site 267
B from July to September in 2015 (Fig. 2). In particular, oxygen concentrations above 268
the lake bottom decreased to as low or lower than ca. 1 mg l-1 at Site A in July (0.92 mg 269
l-1, 11.3% [saturation percentage]), August 2014 (0.13 mg l-1, 1.6%), June (0.85 mg l-1,
270
10.1%), July (0.47 mg l-1, 5.6%), August 2015 (1.06 mg l-1, 12.7%), at Site B in August 271
2014 (0.7 mg l-1, 8.4%). From June 2007 to September 2008, water depth fluctuated
272
from 110 to 175 cm at Site C with the exception of August 2008 (240 cm). The water 273
column was relatively well mixed at Site C during this period (Fig. 2). Oxygen 274
concentrations near the lake bottom were greater than 2 mg l-1 throughout this period. In
275
August 2008, heavy rain (monthly precipitation was 296 mm, Japan Meteorological 276
Agency, 2017) resulted in an exceptionally high water level (240 cm) and slight 277
temporary stratification (Fig. 2). Consequently, oxygen concentrations above the lake 278
bottom in August and September were lower (2.1 mg l-1) than in other months (> 4 mg 279
l-1).
280
Methane concentrations in sediment
282
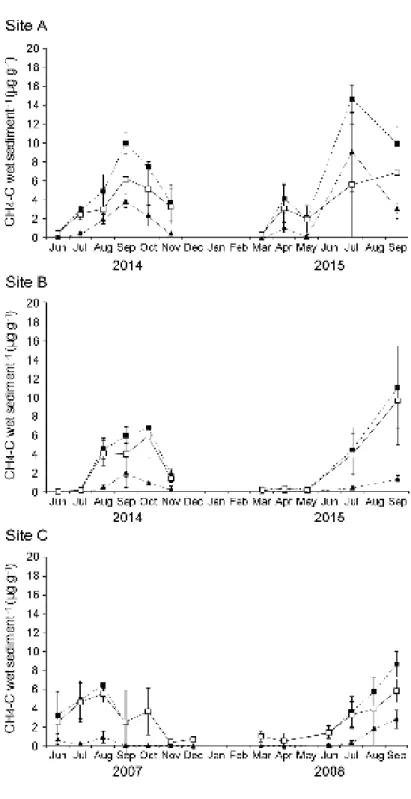
In areas covered by N. nucifera (Site A), methane concentrations in the 0–1 cm and 5–6 283
cm sediment layers peaked in September 2014 (0–1 cm: 3.8 ± 0.7 µg g-1 [CH
4-C wet
284
sediment-1), 5–6 cm: 10.0 ± 1.2 µg g-1) and in July 2015 (0–1 cm: 9.1 ± 4.2 µg g-1, 5–6 285
cm: 14.7 ± 1.5 µg g-1) (Fig. 3). In areas covered with T. natans (Site B), the methane
286
concentration in the surface sediment layer (0–1 cm) peaked in September in both 2014 287
(2.5 ± 1.9 µg g-1) and 2015 (1.7 ± 0.4 µg g-1), while the methane content of the 288
subsurface layer (5–6 cm) peaked in October 2014 (8.5 ± 2.4 µg g-1) and in September
289
2015 (12.1 ± 5.9 µg g-1). Methane concentrations tended to be higher in the 5–6 cm 290
layer than those in the 0–1 cm layer, indicating an increase in methane supply, and 291
higher methane oxidation rates, in the surface sediment. During winter and spring, 292
however, the methane concentrations in both the 0–1 cm and 5–6 cm layers remained 293
low. At Site A, the difference in methane concentration between the 0–1 cm and 5–6 cm 294
layers peaked in October 2014 (5.1 ± 1.8 µg g-1) and in September 2015 (6.9 ± 4.8 µg 295
g-1) when methane concentrations in both layers became high. At Site B, the difference
296
in methane concentration between layers peaked in October 2014 (7.4 ± 3.0 µg g-1) and 297
in September 2015 (12.1 ± 5.9 µg g-1). During the period from June 2007 to September 298
2008 at Site C, methane concentrations peaked in August 2007 (0–1 cm: 0.9 ± 0.6 µg g-1
299
[CH4-C wet sediment-1], 5–6 cm: 6.5 ± 0.3 µg g-1) and in September 2008 (0–1 cm: 2.9
300
± 0.9 µg g-1 [CH
4-C wet sediment-1], 5–6 cm: 8.7 ± 1.3 µg g-1) (Fig. 3). During winter,
301
the methane concentrations in both the 5–6 cm and 0–1 cm layers remained low and no 302
methane was detected in the uppermost layer (0–1 cm) between October 2007 and 303
March 2008. Two-way ANOVA showed significant differences between sites in 304
methane concentrations in the 0–1 cm layer (F2, 98 = 4.0, P < 0.001). Post hoc Tukey’s
HSD tests detected significant differences between Sites A and B (P < 0.001), and Sites 306
A and C (P < 0.001), whereas no significant differences were observed between Sites B 307
and C. For methane concentrations in the 5–6 cm layer, two-way ANOVA showed 308
significant differences between sites (F2, 98 = 7.2, P < 0.01). Post hoc Tukey’s HSD tests
309
detected significant differences in methane concentrations in the 5–6 cm layers between 310
Sites A and C (P < 0.01), whereas no significant differences were observed between 311
Sites A and B, or between Sites B and C. There were no significant differences in ΔCH4
312
between the 0–1 cm and 5–6 cm layers at all sites (F2, 98 = 1.1, p > 0.05).
313
314
Stable carbon and nitrogen isotope ratios of larval chironomids and their potential food
315
sources
316
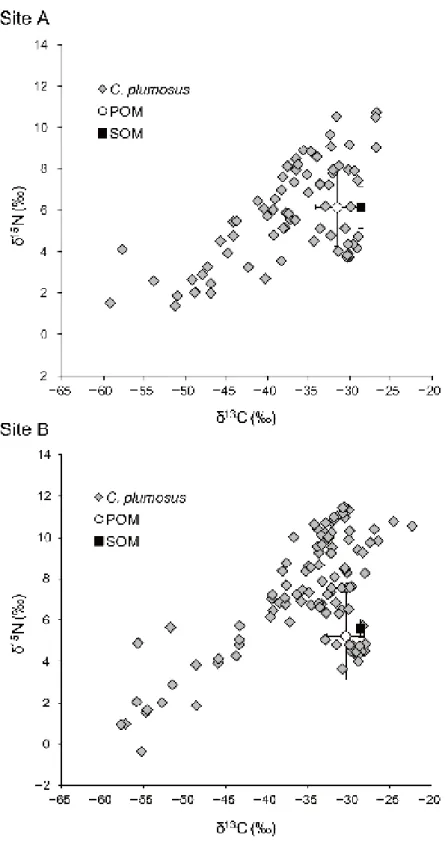
The mean δ13C levels in the sediment were –28.7 ± 0.2‰ (range: –29.1‰ to –28.2‰, n 317
= 27) at Site A and –28.7 ± 0.2‰ (–29.0‰ to –28.0‰, n = 30) at Site B. POM showed 318
a slightly higher depletion of δ13C and a greater degree of fluctuation compared to the 319
sediment: –31.6 ± 2.7‰ (–35.7‰ to –27.5‰, n = 23) at Site A and –30.8 ± 2.3‰ 320
(–35.2‰ to –27.7‰, n = 24) at Site B (Fig. 4). At Site C (data from Yasuno et al. 321
(2012)), the δ13C level in the sediment was −27.6 ± 0.5‰ (range: −28.1‰ to −27.0‰, n 322
= 42) which was slightly higher than those at Sites A and B. The mean δ13C levels of
323
POM at Site C was −31.3 ± 1.4‰ (range: −33.4‰ to −29.0‰, n = 42), similar to those 324
at Sites A and B. The mean δ15N values in the sediment were 6.1 ± 1.0‰ (5.0‰ to
325
8.4‰, n = 27) at Site A and 5.6 ± 0.5‰ (4.5‰ to 6.8‰, n = 30) at Site B. The mean 326
δ15N levels of POM were similar to those of sediment collected from the same site: 6.1 327
± 1.9‰ (3.2‰ to 10.6‰, n = 27) at Site A and 5.2 ± 2.3‰ (1.2‰ to 8.3‰, n = 30) at 328
Site B. Since Yasuno et al. (2012) did not measure δ15N levels, there are no data for 329
δ15N at Site C. The δ13C levels of larval C. plumosus showed wide inter-individual 330
variation during 2014 and 2015, ranging from −59.2‰ to −26.8‰ at Site A, and from 331
−57.9‰ to −24.7‰ at Site B (Fig. 5). Larval δ15N also showed wide inter-individual
332
variation, ranging from 1.4‰ to 10.8‰ at Site A, and from –0.4‰ to 11.5‰ at Site B. 333
There were significant positive correlations between larval δ15N and δ13C at Site A (r2 =
334
0.328, P< 0.001) and Site B (r2 = 0.367, P < 0.001). From June to August at Sites A and 335
B in 2014 and 2015, the δ13C levels of all larval individuals remained higher than −40‰. 336
At Site A, we were not able to collect any larvae in August 2014, August 2015, or 337
September 2015, despite taking more than 20 Ekman grab samples. In September 2015, 338
we were only able to collect one larva at Site B and deemed it insufficient for 339
determining a meaningful δ13C levels. In October 2014, larval chironomids were 340
13C–depleted relative to those collected in August and September, and the δ13C levels in
341
most individual larvae from both sites were lower than −40‰ in November 2014. 342
Individuals with lower δ13C (< −40‰) were found even early the following spring 343
(March 2015). By May 2015, however, all larvae were 13C-enriched, falling into a
344
narrow range of δ13C levels: −30.9‰ to −28.1‰ at Site A, and −31.5‰ to −29.0‰ at 345
Site B. At Sites A and B, the δ13C levels of all larval individuals remained higher than 346
−40‰ during June and July 2014. In August 2014, no larvae could be found at Site A, 347
despite taking more than 20 Ekman grab samples, whereas the δ13C levels of larvae 348
were higher than −40‰ at Site B. In October 2014, larval chironomids were 349
13C–depleted relative to those collected in August and September, and the δ13C levels of
350
most individual larvae from both sites were lower than −40‰ in November 2014. In 351
March 2015, some larval individuals remained 13C–depleted (< −40‰), whereas others
352
were 13C-enriched. The highest δ13C levels in a single individual were −26.8‰ at Site A 353
and −24.7‰ at Site B. In May 2015, larvae showed higher δ13C levels, with narrower 354
ranges, than in other months (Site A; −31.5 to −29.0‰, Site B; −30.9 to −28.1‰). In 355
July 2015, larvae collected from both Sites A and B remained 13C-enriched (> −40‰).
356
In August 2015, no larvae were found at Site A, whereas the δ13C levels of larvae were 357
higher than −40‰ at Site B. In September 2015, no larvae were collected at Sites A and 358
B. At Site C during 2007 and 2008, individual larval δ13C levels ranged from −44.9‰ to 359
−26.7‰ (data from Yasuno et al. (2012)), which tended to be higher than those 360
collected from Sites A and B. Larval chironomids were 13C–depleted in August 2007
361
and in September 2008 and most of these larvae showed δ13C levels lower than −35‰. 362
363
Relationships between δ13C levels in larval chironomids and environmental factors
364
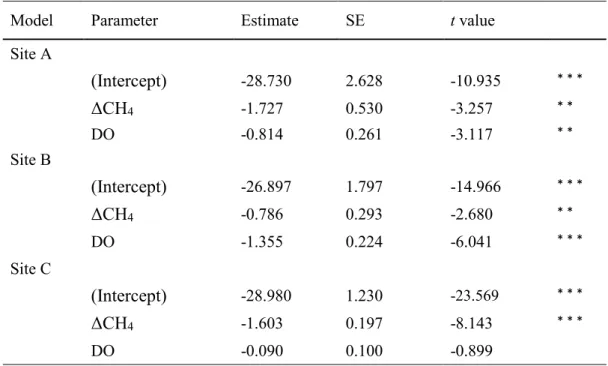
Linear models indicated that larval δ13C levels were negatively correlated with ΔCH4 at
365
all three sites (Site A; P < 0.01, Site B; P < 0.01, Site C; P < 0.001, Table 2). At Sites A 366
and B, larval δ13C levels were also negatively correlated with DO above the lake bottom 367
(Site A; P < 0.01, Site B; P < 0.001). In contrast, at Site C, larval δ13C levels were not
368
significantly correlated with DO above the lake bottom. 369
370
Discussion
371
Methane dynamics in sediments
372
Low oxygen conditions above a lake bottom can enhance methane cycles (i.e., methane 373
production and oxidation) in the sediment (Eller et al., 2005; Deines et al., 2007b; 374
Gentzel et al., 2012). Macrophytes, particularly floating-leaved and emergent plants, 375
can prevent water turbulence and gas exchange between the lake surface and the air 376
(Frodge et al., 1990; Caraco et al., 2006). Simultaneously, oxygen may be actively 377
consumed during the microbial decomposition of dead macrophyte deposits, resulting in 378
the depletion of DO at the lake bottom (Turner et al., 2010; Yamaki & Yamamuro, 2013; 379
Kato et al., 2016). Thus, macrophytes such as lotus and T. natans may promote methane 380
cycles in the sediment. Before the expansion of lotus vegetation in Lake Izunuma (from 381
2007 to 2008, Site C), the water column was frequently well mixed and DO was 382
sufficiently supplied to the lake bottom nearly throughout the year. In one exceptional 383
event, oxygen concentrations near the lake bottom were depleted to approximately 2 mg 384
l-1 due to temporal stratification caused by a sudden increase in water level after a heavy
385
rain in August 2008 (Fig. 2). After the lotus expanded to cover more than 80% of the 386
water surface, DO concentrations near the lake bottom were consistently depleted to < 1 387
mg l-1 within macrophyte-covered areas (Sites A and B) during summer (Fig. 2). In 388
addition, DO concentrations at the lake bottom were significantly lower at Sites A and B 389
(macrophyte-covered areas) than at Site C (open water) (P < 0.01). Therefore, water 390
surface coverage by lotus and T. natans can result in DO depletion. Methane 391
concentrations in sediment layers collected at 0–1 cm and 5–6 cm were significantly 392
higher at Site A, which was covered with lotus vegetation, than at Site C which had no 393
vegetation (0–1 cm; P < 0.001, 5–6 cm; P < 0.01, Fig. 3). Since low oxygen conditions 394
in overlying water can promote methane production in the sediment (Eller et al., 2005; 395
Deines et al., 2007b; Gentzel et al., 2012), strong oxygen depletion near the lake bottom 396
at Site A may lead to high methane concentrations during July and September. In July 397
2015, when oxygen concentrations were lower than 1 mg l-1, methane concentrations in 398
both the 0–1 cm and 5–6 cm layers were the highest encountered in this study period. 399
Because strong oxygen depletion was also observed in June 2015, low oxygen 400
conditions may continue for a relatively long period, stimulating methane production 401
and accumulation of methane in the sediment. Seasonal inputs of organic matter to the 402
lake bottom also stimulate biological methane production in surface sediments (Chan et 403
al., 2005; Schwarz et al., 2008). Every autumn, the lotus plant withers and organic 404
matter derived from the macrophytes accumulates on the lake bottom. Fujibayashi et al. 405
(2013) analyzed the fatty acid composition of sediments collected from Lake Izunuma 406
after the lotus expansion and found that sediment organic matter was derived primarily 407
from lotus. Therefore, seasonal inputs of organic matter from lotus may lead to a greater 408
accumulation of methane in the sediment at Site A than at Site C. Conversely, methane 409
concentrations in the 0–1 cm and 5–6 cm layers at Site B were not significantly 410
different than those at Site C. The effects of macrophytes on DO levels depend on 411
morphological (e.g., floating-leaved, submersed or emergent plants) and structural 412
differences such as stem density and leaf size (Caraco et al., 2006; Bunch et al., 2010). 413
Because lotus produces much larger leaves than T. natans, the input of organic matter to 414
the sediment is likely larger in areas covered with lotus vegetation than in those 415
dominated by T. natans vegetation. Therefore, methane production was lower at Site B 416
than at Site A. Oxygen generally penetrates into sediment from the overlying water, 417
leading to methane oxidation at sediment surface (c.a. < 1cm depth, Sobek et al., 2009; 418
Gentzel et al., 2012). Gentzel et al. (2012) investigated vertical distributions of MOB 419
DNA in lake sediment and showed a maximum concentration at 1 mm sediment depth. 420
Consequently, a steep gradient of methane concentration was observed over several 421
centimeters into the sediment. Hence, we considered ΔCH4 (difference in methane
422
concentrations between 0–1 cm and 5–6 cm layers) as an indicator of methane oxidation. 423
In contrast to absolute methane concentrations, there was no significant difference in 424
ΔCH4 among sites. At macrophyte-rich Sites A and B, ΔCH4 peaked in September or
October. At Site C, which was not covered in vegetation, ΔCH4 peaked in August or
426
September when methane concentrations in the sediment were high. ΔCH4 maintained
427
values as high as or higher than c.a. 3 µg g-1 (CH
4-C wet sediment-1) at Sites A and B
428
even when DO concentrations were less than 1 mg l-1 (e.g., August 2014 and July 2015), 429
indicating methane oxidation under low oxygen conditions. In fact, MOB are tolerant to 430
hypoxic conditions (Gentzel et al., 2012). In November, ΔCH4 levels at Sites A and B
431
were higher than that at Site C, probably because of greater methane accumulation in 432
the sediments at Site A and B than due to organic matter input from macrophytes. 433
Therefore, larger amounts of MOB were able to inhabit the surface sediment during 434
June or July to November. 435
436
Assimilation of MDC by larval chironomids
437
We observed marked depletion in δ13C levels in larval chironomids in autumn at both
438
Site A (lotus vegetation) and Site B (T. natans vegetation), and in late summer at Site C 439
(with no vegetation). The δ13C level of larval individuals reached –59.2‰ at Site A,
440
–57.9‰ at Site B and –44.9‰ at Site C. Although consumers with depleted δ13C (< 441
–40‰) are typically considered to have assimilated MDC by foraging on MOB, it is 442
possible that heterotrophically respired carbon, which is often abundant in eutrophic 443
bodies of water, may provide an alternative 13C-depleted carbon source (Lennon et al., 444
2006). Foraging algal material that incorporates respired carbon may lead to depleted 445
δ13C signatures in consumers. In this study, however, we found significant positive 446
correlations between larval δ15N and δ13C (Fig. 4). Although Yasuno et al. (2012) did 447
not measure δ15N values in larval chironomids collected during 2007 and 2008, larvae
448
collected in 2006 showed a similar correlation between δ15N and δ13C (Yasuno et al., 449
2013). These correlations indicate that 13C-depleted larval chironomids used MOB as a 450
food source. C. plumosus live in tubes constructed from silk and sediment, which are 451
irrigated during feeding and respiration (McLachlan, 1977; Yasuno et al., 2013). MOB 452
are more abundant on the inner wall of the robust U-shaped larval tube than in surface 453
sediment (Kajan & Frenzel, 1999; Gentzel et al., 2012). Tube-dwelling chironomid 454
larvae excrete ammonium within their tubes (Fukuhara & Yasuda, 1989; Devine & 455
Vanni, 2002). The microbial community within the tube, including MOB, assimilates 456
this abundant ammonium as a nitrogen source, resulting in negative δ15N signatures
457
(Macko et al., 1987). Therefore, 13C-depleted chironomid larvae could assimilate MDC 458
by ingestion of MOB. Large inter-individual δ13C variability was found in larvae
459
collected at all sites, even among individuals collected at the same time. In particular, 460
the ranges of δ13C in larvae collected in March 2015 were 27.2‰ at Site A and 33.2‰ 461
at Site B (Fig. 5). Similar inter-individual variability has often been reported when 462
chironomid larvae were 13C–depleted due to the assimilation of MDC (Grey et al., 463
2004a; Deines et al., 2007b; Ravinet et al., 2010). The observed inter-individual 464
variability seemed to reflect differences in reliance on MOB among individuals. Larval 465
C. plumosus are known to switch their feeding behavior (filter feeding or deposit
466
feeding) (McLachlan, 1977) and Deines et al. (2007a) showed experimentally, using 467
13C-labeled methane, that this can explain inter-individual variability. Therefore, the
468
isotopic inter-individual variability observed herein may reflect differences in feeding 469
behavior among larval individuals. 470
471
Seasonality of use of MDC by larval chironomids
472
Before the lotus expansion, δ13C levels of larval chironomids decreased at Site C (no 473
vegetation) during late summer or early autumn (Fig. 5) when methane concentrations 474
in the sediment peaked (Fig. 3), indicating an increase in larval reliance on MDC. 475
However, after the lotus expansion, no larvae were collected at Site A during August or 476
September, and at Site B in September. DO was strongly depleted within 477
macrophyte-covered areas during June or July to August (c.a. < 1 mg l-1, Fig. 2). Thus,
478
macrophyte coverage may make the lake bottom too harsh an environment for larval 479
chironomids. In fact, the density of benthic invertebrates, including larval C. plumosus, 480
was extremely low at Sites A and B during August and September (Yasuno et al., 2015). 481
Although larvae were collected at Site B in August 2014 and 2015, they were not 482
13C-depleted (> –40‰) (Fig. 5), indicating less assimilation of MDC by larval
483
chironomids. The activity of MOB depends on the availability of both oxygen and 484
methane (Borrel et al., 2011). However, MOB are more likely to be found in surface 485
sediments with hypoxic overlying water (<1 mg l-1). This is likely due to the large
486
methane supply from the sediment (Gentzel et al., 2012). ΔCH4 usually peaked in
487
September at Sites A and B, indicating high methane oxidation rates and large amounts 488
of MOB biomass (Fig. 3). Chironomus anthracinus Zetterstedt larvae, which are 489
tolerant to low oxygen conditions mush like C. plumosus, are aestivate in oxygen levels 490
less than 0.5 mg l-1 (Hamburger et al., 1994). Therefore, extreme hypoxia could make
491
larval chironomids inactive and prevent them from feeding on MOB. Consequently, 492
these larvae were not 13C-depleted. During October and November 2014, larval
493
chironomids from both Sites A and B became markedly 13C–depleted. Similar isotopic 494
depletion in autumn has been reported in temperate dimictic lakes, likely because the 495
renewed availability of oxygen at the sediment surface can stimulate the production of 496
MOB, thereby increasing the importance of MOB in the diet of larval chironomids 497
(Grey et al., 2004b; Deines et al., 2007b). In Lake Izunuma, oxygen is supplied to the 498
oxic-anoxic interface (lake bottom) when the lotus starts to wither in October. This may 499
stimulate MOB and facilitate the entry of MDC into the food web. In October 2014, 500
methane concentrations in the 0–1 cm and 5–6 cm layers collected at Sites A and B 501
were clearly higher than that at Site C (Fig. 3). Organic matter derived from dead lotus 502
is supplied to the lake sediment during autumn. Microbial decomposition of organic 503
matter by fermentative bacteria produces substrate material, such as H2 and acetate, for
504
methanogenesis. This promotes biogenic methane production (Borrel et al., 2011). 505
Therefore, methane production and oxidation may be stimulated in autumn, thereby 506
increasing the availability of MOB to larval chironomids within macrophyte-covered 507
areas. Relatively large numbers of larvae were easily collected at Sites A and B in 508
October 2014. Site A did not yield any larvae during August and September, and Site B 509
did not yield larvae in September. These results indicate the emergence of adult 510
chironomids and the recruitment of larvae during September and October. The 511
emergence of C. plumosus is known to occur two or three times per year in Japan, with 512
a latter emergence often occurring in autumn (Nakazato & Hirabayashi, 1998). The 513
density of fourth-instar C. plumosus larvae increased from September to October 514
(Yasuno et al., 2009), indicating emergence and recruitment of larvae. Aquatic insects 515
typically have fast turnover rates. Hamilton et al. (2004) showed that aquatic insects in 516
streams have δ15N half-lives (the time required for a 50% change in isotope ratio
517
following a switch in food source) shorter than 12 days. Doi et al. (2007) showed that 518
the δ13C and δ15N half-lives of fourth-instar larvae of Chironomus acerbiphilus 519
Tokunaga after molting were approximately 6 days. Therefore, low δ13C levels in larval
520
C. plumosus in October 2014 may reflect their feeding history over a relatively short
term (after recruitment). Some larval chironomids collected at Sites A and B in March 522
2015 also showed extremely low δ13C levels (Fig. 5). However, methane concentrations 523
in the sediment during this time were almost at their lowest (Fig. 3), indicating that a 524
relatively small biomass of MOB was available to larval chironomids. Larval C. 525
plumosus is known to go inactive and rarely feeds at temperatures below 5°C
526
(Hilsenhoff, 1966). Although we did not measure water temperature during December 527
2014 and February 2015, average air temperatures during that period ranged from 0.3 to 528
1.2°C (Fig. 2). Thus, the low δ13C levels measured in larvae in March 2015 may reflect
529
MOB ingestion during the previous autumn because of low larval feeding activity 530
during winter. However, larval δ13C tended to be higher in March 2015 than in
531
November 2014 at both Sites A and B (Fig. 5). In March 2015, water temperature rose 532
above 5°C (Fig. 2), where larval C. plumosus begin filter-feeding (Hilsenhoff, 1966). 533
These larvae could start to feed on POM or sediment organic matter in March 2015, 534
resulting in higher larval δ13C levels than those measured the previous 535
autumn.13C–depleted larval chironomids (< –40‰) disappeared and all larvae fell into a
536
narrow range of δ13C levels in May 2015 at Sites A and B (Fig. 5). In Lake Izunuma, the 537
emergence of adult C. plumosus was observed during April and early May (Yasuno N. 538
personal observation). The emergence of overwintered, 13C–depleted larvae could result
539
in an increase in larval δ13C. 540
541
Effects of macrophyte coverage on use of MDC by larval chironomids
542
We showed that macrophyte vegetation can greatly affect the trophic transfer of MDC to 543
benthic larval chironomids, and can also affect the seasonality of larval δ13C levels.
544
During summer, hypoxia associated with macrophyte vegetation may make the lake 545
bottom too harsh for larval chironomids, or render them inactive, thereby limiting the 546
trophic transfer of MDC to benthic consumers. In contrast, autumnal oxygen supply to 547
the lake bottom may stimulate MOB activity and the feeding activity of chironomid 548
larvae. In addition, the accumulation of organic matter from dead macrophytes may 549
promote methane production and oxidation during autumn, resulting in enhanced 550
trophic transfer of MDC to chironomid larvae. The trophic transfer of MDC to benthic 551
consumers can be affected by the supply of methane or oxygen to MOB (Grey et al., 552
2004b; Deines et al., 2007b; Yasuno et al., 2012). In open areas (lacking vegetation) of 553
shallow (polymictic) lakes, there may be a constant supply of DO to the MOB habitat at 554
the lake bottom. Consequently, the use of MDC may be strongly affected by the 555
availability of methane (Yasuno et al., 2012). In contrast, in dimictic lakes, hypolimnetic 556
hypoxia could render MOB at the surface sediment and larval chironomids inactive and 557
limit the MDC pathway to benthic consumers during the summer stratification period 558
(Grey et al., 2004b). Our findings show that the trophic transfer of the MDC pathway 559
during late summer and early autumn in a shallow lake may be greatly affected by the 560
extreme hypoxia associated with floating-leaved and emergent macrophyte vegetation, 561
causing seasonal patterns in the use of MDC by larvae that more closely resemble those 562
in dimictic lakes than that of Lake Izunuma before the lotus expansion (Yasuno et al., 563
2012). Agasild et al. (2014) also reported autumnal 13C depletion in larval chironomids 564
from a plant-dominated site (submerged and floating-leaved plants) in Lake Võrtsjärv in 565
Estonia. Larvae exhibited relatively high δ13C levels in September with significantly 566
lower levels in November. Thus, similar autumnal 13C-depletion in larval chironomids 567
may occur among vegetated areas in other lakes or ponds. Coverage with 568
floating-leaved and emergent macrophyte vegetation is a common environment in 569
shallow water bodies such as the littoral zones of lakes and small ponds. Therefore, 570
although further studies are necessary, our findings represent an important contribution 571
to the understanding of the carbon cycle in wetlands. 572
573
Acknowledgments
574
We sincerely thank Dr. K. Itoh, Graduate School of Agricultural Science, Tohoku 575
University, for her assistance in the stable isotope analytical facilities. This study was 576
supported partly by Grants-in-Aid for Scientific Research (C) from the Japan Society 577
for the Promotion of Science (nos. 25440232). 578
579 580
References
581
582
Agasild, H., P. Zingel, L. Tuvikene, A. Tuvikene, H. Timm, T. Feldmann, J. Salujõe, K. 583
Toming, R. I. Jones & T. Nõges, 2014. Biogenic methane contributes to the food 584
web of a large, shallow lake. Freshwater Biology 59(2): 272–285. 585
586
Borrel, G., D. Jézéquel, C. Biderre-Petit, N. Morel-Desrosiers, J. P. Morel, P. Peyret, G. 587
Fonty & A. C. Lehours, 2011. Production and consumption of methane in 588
freshwater lake ecosystems. Research in Microbiology 162(9): 832–847. 589
590
Bunch, A. J., M. S. Allen & D. C. Gwinn, 2010. Spatial and temporal hypoxia dynamics 591
in dense emergent macrophytes in a Florida lake. Wetlands 30(3): 429–435. 592
593
Caraco, N., J. Cole, S. Findlay & C. Wigand, 2006. Vascular plants as engineers of 594
oxygen in aquatic systems. BioScience 56(3): 219–225. 595
596
Carpenter, S. R., 1981. Submersed vegetation: an internal factor in lake ecosystem 597
succession. The American Naturalist 118(3): 372–383. 598
599
Carpenter, S. R. & D. M. Lodge, 1986. Effects of submersed macrophytes on ecosystem 600
processes. Aquatic Botany 26: 341–370. 601
602
Chan, O. C., P. Claus, P. Casper, A. Ulrich, T. Lueders & R. Conrad, 2005. Vertical 603
distribution of structure and function of the methanogenic archaeal community 604
in Lake Dagow sediment. Environmental Microbiology 7(8): 1139–1149. 605
606
Child, A. W. & B. C. Moore, 2015. Effects of hypolimnetic oxygenation on the dietary 607
consumption of methane-oxidizing bacteria by Chironomus larvae in dimictic 608
mesotrophic lakes. Freshwater Science 34(4): 1293–1303. 609
610
Deines, P., P. L. E. Bodelier, G. Eller & J. Grey, 2007a. Methane-derived carbon flows 611
through methane-oxidizing bacteria to higher trophic levels in aquatic systems. 612
Environmental Microbiology 9(5): 1126–1134. 613
614
Deines, P., J. Grey, H. H. Richnow & G. Eller, 2007b. Linking larval chironomids to 615
methane: seasonal variation of the microbial methane cycle and chironomid δ13C. 616
Aquatic Microbial Ecology 46(3): 273–282. 617
618
DeNiro, M. J. & S. Epstein, 1977. Mechanism of carbon isotope fractionation 619
associated with lipid synthesis. Science 197(4300): 261–263. 620
621
Devine, J. A. & M. J. Vanni, 2002. Spatial and seasonal variation in 622
nutrient excretion by benthic invertebrates in a eutrophic reservoir. 623
Freshwater Biology 47(6): 1107–1121. 624
625
Dieter, C. D., 1990, The importance of emergent vegetation in reducing sediment 626
resuspension in wetlands. Journal of Freshwater Ecology 5(4): 467–473. 627
Doi, H., E. Kikuchi, S. Takagi & S. Shikano, 2007. Changes in carbon and nitrogen 629
stable isotopes of chironomid larvae during growth, starvation and 630
metamorphosis. Rapid Communications in Mass Spectrometry 21(6): 631
997–1002. 632
633
Eller, G., P. Deines, J. Grey, H. H. Richnow & M. Krüger, 2005. Methane cycling in 634
lake sediments and its influence on chironomid larval partial δ13C. Limnology 635
and Oceanography 54(3): 339–350. 636
637
Frodge, J. D., G. L. Thomas & G. B. Pauley, 1990. Effects of canopy formation by 638
floating and submergent aquatic macrophytes on the water quality of two 639
shallow Pacific Northwest lakes. Aquatic Botany 38(2–3): 231–248. 640
641
Fujibayashi, M., M. Nomura, X. Xu, R. Sato, Y. Aikawa & O. Nishimura, 2013. 642
Analysis of sedimentary organic carbon dynamics in Lake Izunuma using by 643
current flow and fatty acid biomarker. Journal of JSCE, Ser. G (Environmental 644
Research) 69: 565–570. 645
646
Fukuhara, H. & K. Yasuda, 1989. Ammonium excretion by some freshwater zoobenthos 647
from a eutrophic lake. Hydrobiologia 173(1): 1–8. 648
649
Gentzel, T., A. E. Hershey, P. A. Rublee & S. C. Whalen, 2012. Net sediment production 650
of methane, distribution of methanogens and methane-oxidizing bacteria,and 651
utilization of methane-derived carbon in an arctic lake. Inland Waters 2(2): 652
77–88. 653
654
Grey, J., 2016. The incredible lightness of being methane-fuelled: stable isotopes reveal 655
alternative energy pathways in aquatic ecosystems and beyond. Frontiers in 656
Ecology and Evolution 4: 8. 657
658
Grey, J., A. Kelly & R. I. Jones, 2004a. High intraspecific variability in carbon and 659
nitrogen stable isotope ratios of lake chironomid larvae. Limnology and 660
Oceanography 49(1): 239–244. 661
662
Grey, J., A. Kelly, S. Ward, N. Sommerwerk & R. I. Jones, 2004b. Seasonal changes in 663
the stable isotope values of lake-dwelling chironomid larvae in relation to 664
feeding and life cycle variability. Freshwater Biology 49(6): 681–689. 665
666
Hamburger, K., P. C. Dall & C. Lindegaard, 1994. Energy metabolism of Chironomus 667
anthracinus (Diptera: Chironomidae) from the profundal zone of Lake Esrom,
668
Denmark, as a function of body size, temperature and oxygen 669
concentration. Hydrobiologia 294(1): 43–50. 670
671
Hamilton, S. K., J. L. Tank, D. F. Raikow, E. R. Siler, N. J. Dorn & N. E. Leonard, 2004. 672
The role of instream vs allochthonous N in stream food webs: modeling the 673
results of an isotope addition experiment. Journal of the North American 674
Benthological Society 23(3): 429–448. 675
Hargeby, A., I. Blindow & G. Andersson, 2007. Long-term patterns of shifts between 677
clear and turbid states in Lake Krankesjo¨n and Lake Tåkern. Ecosystems 10(1): 678
29–36. 679
680
Hargeby, A., I. Blindow & L.-A. Hansson, 2004. Shifts between clear and turbid states 681
in a shallow lake: multicausal stress from climate, nutrients and biotic 682
interactions. Archiv für Hydrobiologie 161(4): 433–454. 683
684
Hershey, A. E., R. M. Northington, J. Hart–Smith, M. Bostick & S. C. Whalen, 2015. 685
Methane efflux and oxidation, and use of methane–derived carbon by larval 686
Chironomini, in arctic lake sediments. Limnology and Oceanography 60(1): 687
276–285. 688
689
Hilsenhoff, W. L., 1966. The biology of Chironomus plumosus (Diptera: Chironomidae) 690
in Lake Winnebago, Wisconsin. Annals of the Entomological Society of 691
America 59(3): 465–473. 692
693
Hilt, S. & E. M. Gross, 2008. Can allelopathically active submerged macrophytes 694
stabilise clear-water states in shallow lakes? Basic and Applied Ecology 9(4): 695
422–432. 696
697
Izunuma-Uchinuma Natural regeneration council, 2009. Master plan for natural 698
regeneration of Izunuma-Uchinuma. Miyagi Prefecture, Sendai, Japan. (in 699
Japanese) 700
701
Japan Meteorological Agency, 2017. Meteorological Database. 702
http://www.data.jma.go.jp/obd/stats/etrn/index.php?sess=6ef525a9cdef28cea634 703
ce58ca736e68. (in Japanese) 704
705
Jeppesen, E., M. Søndergaard, M. Søndergaard & Christoffersen, K. (Eds.), 1998. The 706
structuring role of submerged macrophytes in lakes. Ecological Series, vol. 131. 707
Springer-Verlag, 423 pp. 708
709
Jones, R. I. & J. Grey, 2011. Biogenic methane in freshwater food webs. Freshwater 710
Biology 56(2): 213–229. 711
712
Jones, R. I., C. E. Carter, A. Kelly, S. Ward, D. J. Kelly & J. Grey, 2008. Widespread 713
contribution of methane-cycle bacteria to the diets of lake profundal chironomid 714
larvae. Ecology 89(3): 857–864. 715
716
Kajan, R. & P. Frenzel, 1999. The effect of chironomid larvae on production, oxidation 717
and fluxes of methane in a flooded rice soil. FEMS Microbiology Ecology 718
28(2): 121–129. 719
720
Kato, Y., J. Nishihiro & T. Yoshida, 2016. Floating-leaved macrophyte (Trapa japonica) 721
drastically changes seasonal dynamics of a temperate lake ecosystem. Ecological 722
Research 31(5): 695–707. 723
Kiyashko, S. I., T. Narita & E. Wada, 2001. Contribution of methanotrophs to 725
freshwater macroinvertebrates: evidence from stable isotope ratios. Aquatic 726
Microbial Ecology 24(2): 203–207. 727
728
Lennon, J. T., A. M. Faiia, X. Feng, & K. L. Cottingham, 2006. Relative importance of 729
CO2 recycling and CH4 pathways in lake foodwebs along a dissolved organic
730
carbon gradient. Limnology and Oceanography 51(4): 1602–1613. 731
732
Macko, S. A., M. L. Fogel, P. E. Hare & T. C. Hoering, 1987. Isotopic fractionation of 733
nitrogen and carbon in the synthesis of amino acids by microorganisms. 734
Chemical Geology 65(1): 79–92. 735
736
McLachlan, A. J., 1977. Some effects of tube shape on the feeding of Chironomus 737
plumosus L. (Diptera: Chironomidae). Journal of Animal Ecology 46: 139–146.
738
739
Miyagi Prefecture, 2017. Results of water quality measurements in public waters. 740
https://www.pref.miyagi.jp/soshiki/kankyo-t/koukyouyousuiiki-sokuhou.html 741
742
Moss, B., S. McGowan & L. Carvalho, 1994. Determinations of phytoplankton crops by 743
top-down and bottom-up mechanisms in a group of English lakes, the West 744
Midland meres. Limnology and Oceanography 39(5): 1020–1029. 745
746
Nakazato, R. & K. Hirabayashi, 1998. Effect of larval density on temporal variation in 747
life cycle patterns of Chironomus plumosus (L.) (Diptera: Chironomidae) in the 748
profundal zone of eutrophic Lake Suwa during 1982–1995. Japanese Journal of 749
Limnolgy 59: 13–26. 750
751
National Institute for Environmental Studies 2017, Environmental numerical database. 752
https://www.nies.go.jp/igreen/md_down.html. Accessed 24 September 2017. (in 753
Japanese). 754
755
Peterson, B. J. & B. Fry, 1987. Stable isotopes in ecosystem studies. Annual Review 756
of .Ecology, Evolution, and Systematics 18(1): 293–320. 757
758
Post, D. M., 2002. Using stable isotopes to estimate trophic position: models, methods, 759
and assumptions. Ecology 83(3): 703–718. 760
761
R Development Core Team, 2017. R: A Language and Environment for Statistical 762
Computing. R Foundation for Statistical Computing, Vienna, Austria. 763
764
Ravinet, M., J. Syväranta, R. I. Jones & J. Grey, 2010. A trophic pathway from biogenic 765
methane supports fish biomass in a temperate lake ecosystem. Oikos 119(2): 766
409–416. 767
768
Rose, C. & W. G. Crumpton, 2006. Spatial patterns in dissolved oxygen and methane 769
concentrations in a prairie pothole wetland in Iowa, USA. Wetlands 26: 770
1020–1025. 771
Sanseverino, A. M., D. Bastviken, I. Sundh, J. Pickova & A. Enrich-Prast, 2012. 773
Methane carbon supports aquatic food webs to the fish level. PloS one, 7: 774
e42723. 775
776
Scheffer, M., 1998. Ecology of Shallow Lakes. Chapman and Hall, London. 777
778
Scheffer, M., S. H. Hosper, M. L. Meijer, B. Moss & E. Jeppesen, 1993. Alternative 779
equilibria in shallow lakes. Trends in ecology & evolution 8(8): 275–279. 780
781
Scheffer, M. & E. Jeppesen, 2007. Regime shifts in shallow lakes. Ecosystems 10(1): 782
1–3. 783
784
Scheffer, M. & E. H. van Nes, 2007. Shallow lakes theory revisited: various alternative 785
regimes driven by climate, nutrients, depth and lake size. Hydrobiologia 584(1): 786
455–466. 787
788
Schwarz, J. I., W. Eckert & Conrad, R., 2008. Response of the methanogenic microbial 789
community of a profundal lake sediment (Lake Kinneret, Israel) to algal 790
deposition. Limnology and Oceanography 53(1): 113–121. 791
792
Shidara, S., 1992. Social conditions surrounding Izunuma and Uchinuma Lakes. In: 793
Advisory Committee for Environmental Preservation Measures (ed) Report for 794
Environmental Preservation Measures of Izunuma and Uchinuma Lakes. Miyagi 795
Prefecture, Japan. pp 155–164. (in Japanese) 796
797
7th Izunuma-Uchinuma Nature Restoration Committee, 2013. 798
https://www.pref.miyagi.jp/soshiki/sizenhogo/04-1kyougikai.html 799
800
Sobek, S., E. Durisch-Kaiser, R. Zurbrügg, N. Wongfun, M. Wessels, N. Pasche & B. 801
Wehrli, 2009. Organic carbon burial efficiency in lake sediments controlled by 802
oxygen exposure time and sediment source. Limnology and 803
Oceanography 54(6): 2243–2254. 804
805
The Miyagi prefectual Izunuma-Uchinuma Environmental Foundation, 2010. A floral 806
list around Lake Izunuma-Uchinuma. Izunuma-Uchinuma Wetland Researches 807
4: 41–61. 808
809
Turner, A. M., E., J., Cholak & M. Groner, 2010. Expanding American lotus and 810
dissolved oxygen concentrations of a shallow lake. American Midland Naturalist 811
164(1): 1–8. 812
813
Webster, J. R. & E. F. Benfield, 1986. Vascular plant breakdown in freshwater 814
ecosystems. Annual Review of Ecology and Systematic 17(1): 567–594. 815
816
Wetzel, G. R., 2001a. Phosphorus and nitrogen loading and algal productivity. In Wetzel, 817
G. R. (ed.) Limnology (3rd ed). Academic Press, San Diego: 279–286. 818
819
Wetzel, G. R., 2001b. Shallow lakes and ponds. In Wetzel, G. R. (ed.) Limnology (3rd 820