The Effect of the Arctic Ozone Depletion
Observed at Tsukada, Japan in February 2001
(Extended Abstract)
著者
Murata Isao, Kobayashi Nobutaka, Nakane
Hideaki, Fukunishi Hiroshi
雑誌名
The science reports of the Tohoku University.
Fifth series, Tohoku geophysical journal
巻
36
号
4
ページ
498-500
発行年
2003-05
TOhoku Geophys. Journ. (Sci. Rep. TOhoku Univ., Ser. 5),Vol. 36, No. 4, pp. 498-500, 2003
The Effect
atof the Arctic
Tsukuba, Japan
(Extended
Ozone Depletion Observed
in February 2001
Abstract)
ISM) MURATA', NOBUTAKA KOBAYAMI1, HIDEAKI NAKANE2 and HIROSHI FUKUNISHI1
'Department of Geophysics , Graduate School of Science, Tohoku University, Aramaki-Aoha, Aoba-ku, Sendai, 980-8578
'National Institute for Environmental Studies, 16-2, Onogawa, Tsukuba, Ibaraki, 305-8506
(Received February 10, 2003)
1. Introduction
Considerable ozone depletion has been observed in the Arctic polar vertex since 1990s [e.g., Newman et al., 1997]. Because of the strong planetary wave activity in the Arctic region, the edge of the polar vortex occasionally attains to mid-latitudes. In this paper, we investigated the effect of the Arctic ozone depletion in the mid-latitude region from the correlation analysis of 03, HC1, HNO3 and HF vertical column densities observed at Tsukuba, Japan (36.0°N, 140.1°E) with a high-resolution Fourier transform infrared spectrometer (FTIR).
2. Observation and Analysis
The vertical column densities of 03, HC1,
HNO3, and HF were observed since
December 1998. The spectral resolution of the FTIR (Bruker 120M) is 0.0035 cm-'.
The spectral fitting algorithm to derive the vertical column densities is based on SFIT
[Rinsland et al., 1984, 1996] and is improved with a vertical shift procedure of the initial
profile to minimize the residual of the spectral fitting. The derived 03 vertical column
densities agree with those observed by the Dobson spectrometer at the nearby (1 km
apart) station within differences of 2 to 3%. The spectra measured from December 1998
to October 2001 are used in this analysis.
3. Results and Discussions
Correlations of column density variations between pairs of 03 and HF, HC1 and HF, and HNO3 and HF are good indicators of the chemical changes of 03, HC1, and HNO3. These four species are all distributed mainly in the stratosphere. One of these species, HF is chemically very stable and hence a good tracer of the transport process. The other species, 03, HC1, and HNO3 are also relatively stable in the chemical processes in
499 450 400 O •350 O 0 300 250 y= 16432x + 143.03 199948- y .3=20.0 [DLT]./.. 19994.9,40R-ii.
•2/7•,---
• • ^ -.•••,• •IP20003(26 •'j - s ... 0, • .." • ai• .• ,,.,.:.. • ,.... ...•. 2001 2/20 i`.. • I% 0.Ayi
1-- a ... • 20012/2174.e
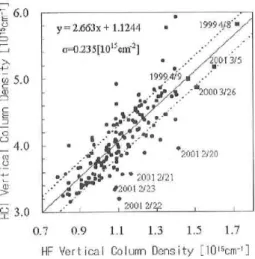
•.--• .2001 2/22 . . • -'^•• . 2001 2/23 0.6 HF 0.8 Vert Ica I Fig. 1. 1 1.2 1.4 1.6 1.8 Column Density [1015cm-1] Correlation of 03 and HF. E 6.0 Lk) c)5.0 C _ 4.0 3.0 • y = 2.663x + 1.1244 • 1999 4A./ a-423 5[1015cm-21 •• •- 700-13'1'5-
•,.'/ s'1999,7.•'.
• •,,e,_---.'2000 3/26.07.^/.,•
DitII.. . ...,- . i I a ...tr"‘‘' •l!.• ....'- 2,V:•••00 1 2120 • --i;19•-•(
•Ai • • • 20012/21/1?
.2001 2/23 • . 2001 2/22 . 0.7 0.9 1.1 1.3 1.5 1.7 HF Vertical Column Density [1015cm-11 Fig. 2. Correlation of HC1 and HF.mid-latitudes. • Therefore, variations in the column densities of these three species and HF usually show positive correlations. Figures 1 to 3 show the correlation plots of 03 and HF, HCl and HF, and HNO3 and HF, respectively. Generally we can find positive correlations in all three figures. Blue squares and red circles represent the events when the edge of the polar vortex attained around Japan. The larger col-umn densities were observed in all four species on April 8 and 9, 1999, March 26, 2000, and March 5, 2001 but the correla-tions showed no significant variacorrela-tions (blue squares), indicating no chemical ozone depletion. The correlations of 03 and HC1
L • 2 1.8 1.6 Q.) l= c 1.4 6CD1.2 ' (?) 1 • 0.8 •0.6 0,6 0.8 1 1.2 1.4 1.6 1.8 HF Vert ica I Column Dens i ty [1015erri] Fig. 3. Correlation of HNO3 and HF.
to HF on February 20 to 23, 2001 (red circles) are found to be lower than in other periods. It is indicated that 03 and HCl on these days were chemically depleted. However, the correlation between HNO3 and HF showed no significant variations, which means that there remained no evidence of denitrification. A potential vorticity analysis showed that Tsukuba was located in the boundary region of the polar vortex on these days. Figure 4 shows the potential vorticity maps at the potential temperature of 475 K on February 20 and February 10, 2001 with the 10 days backward trajectory from February 20 in an example. The backward trajectory analysis indicated that the observed air masses at the potential temperatures of 475 K and 550 K came from inside the polar vortex. It is suggested that the chemically perturbed air masses arrived above Japan due to the
500 90° W
i''')
\\'' '
\ ' r : ' -, _ VI ' j, [Av.„;\'.\---,--)--,,,-L----.---5
,,,
90' 0 Fig. 4. The potential vorNI ES 5—RAS ,,-,....,- Puteul ul Vorlic0./,'- '' , 2001 02 20 00 ,.;-. 0 =475(; )
80'
OCLA7C3
1*1.:;,v, 90' w)74EE
-7 , 90° 0 MTS. P1/,,L1107 tCur ully 2001 02 10 00 0=47,(K) 180'4. The potential vorticity maps at the potential temperature of 475 K on Febru-ary 20 (left panel) and on FebruFebru-ary 10 (right panel), 2001. Red cross indicates the location of Tsukuba. Blue line shows the 10 days backward trajectory from February 20 and the blue circle shows the location of the air mass on February 10. Note that only the blue circle corresponds to the potential vorticity map on February 10.
distortion of the polar vortex and it can be said that Arctic ozone amount in mid-latitudes.
ozone depletion affected the
References
Newman, P.A., J.F. Gleason, R.D. McPeters, and R.S. Stolarski, 1997 : Anomalously low ozone over the Arctic, Geophys. Res. Lett., 24, 2689.
Rinsland, C.P., R.E. Boughner, J.C. Larsen, G.M. Stokes, and J.W. Brault, 1984 : Diurnal variations of atmospheric nitric oxide : ground-based infrared spectroscopic measurements and their
interpretation with time-dependent photochemical model calculations, J. Geophys. Res., 89,
9613-9622.
Rinsland, C.P., et al., 1996 : Comparison of infrared and Dobson total ozone columns measured from Lauder, New Zealand, Geophys. Res. Lett., 23, 1025-1028.