Association between environmental and health
related factors and epidemic of respiratory
syncytial virus infection in Japan
学位名
修士(公衆衛生学)
学位授与機関
聖路加国際大学
学位授与年度
2020
学位授与番号
32633公修専第083
1
Capstone Project
Association between environmental and health related factors and
epidemic of respiratory syncytial virus infection in Japan
Shingo Mitsushima 20MP101
Graduate School of Public Health, St. Luke’s International University Tokyo, Japan
2 Abstract
Background
Respiratory syncytial virus (RSV), with a high incidence during winter, has been
changing its seasonality in recent years. Palivizumab, a humanized monoclonal antibody, can reduce severe RSV cases. In Japan, monthly palivizumab is recommended for
children at high risk from September to March. However, duration of RSV epidemic influences this palivizumab administration. Published studies showed that
meteorological and demographic factors could influence RSV epidemic. The objective of this study was to examine whether incidence of other infectious diseases,
palivizumab immunoprophylaxis, meteorological factors and demographic factors are associated with RSV epidemic.
Methods
This study involves retrospective analysis of RSV related aggregated patients’ data (2012-2019) reported in Infectious Diseases Weekly Report (IDWR). Data on meteorological parameters were obtained from the Japan Meteorological Agency. Information on influenza incidence, population density, use of immunoprophylaxis and area were collected from IDWR, Vital Statistics, National Database and Ministry of Land, Infrastructure, Transport and Tourism, respectively. Bivariable and multivariable analyses were conducted to explore the associations between RSV epidemic as
dependent variable and incidence of influenza, the number of palivizumab injections, demographic characteristics and meteorological data (temperature, humidity and rainfall) as independent variables.
Results
In bivariable and multivariable analyses, incidence of influenza was significantly associated with RSV onset week, duration of RSV epidemic and peak of cases per
3 sentinel hospital. RSV epidemic onset and duration significantly differed in different climate regions in Japan.
Conclusion
Influenza epidemic, meteorological factors and demographic factors may be associated with RSV epidemic onset, duration and peak in Japan.
4 Introduction
Respiratory syncytial virus (RSV) is the leading cause of lower respiratory tract infections in young children worldwide. A report estimated that RSV causes 33 million lower respiratory tract infections, 3.2 million hospitalizations and 60,000 deaths in children under 5 years of age each year (1). No vaccine is currently approved for RSV, but palivizumab, a humanized monoclonal antibody, reduces hospitalizations when delivered prophylactically to children at high risk (2-4). The risk factors of severe RSV infection are prematurity, low birth weight, having siblings, maternal smoking,
congenital heart disease (CHD), bronchopulmonary dysplasia (BPD) and chromosomal abnormality (5-8). In Japan, children born preterm, and children with CHD, BPD, chromosomal abnormalities and immunocompromised state are considered to be at high risk of severe RSV infections (9). Palivizumab as an immunoprophylactic agent for this group of children is covered by social health insurance (SHI).
In Japan, RSV is one of the 23 infectious notifiable diseases (category V). Data on category Ⅴ infectious diseases are being collected by sentinel surveillance and represented as cases per sentinel hospital. The number of sentinel hospitals is different in each prefecture and is determined according to population size in each prefecture. RSV surveillance started in 2003 in Japan. In the beginning, only RSV antigen test for "inpatients under 3 years of age" was covered by SHI. In October 2011, the coverage of SHI expanded to include "inpatients of all ages", "outpatients under 1 year of age" and "patients who are eligible to receive palivizumab". Therefore, the period for this study was from 2012 to 2019.
As palivizumab is expensive, it is necessary to administer palivizumab for an appropriate period to effectively manage healthcare resources. Japan Pediatric Society recommended palivizumab for children who are at high risk for severe RSV infections
5 monthly from September to March, which has been considered as the RSV epidemic period in Japan (9,10). However, RSV epidemic period and its onset change every year (11). In April 2018, Japan Pediatric Society changed their recommendation for
palivizumab immunoprophylaxis injections at the onset of RSV season as indicated by local surveillance system (10). But it is difficult to decide when to start and when to stop palivizumab prophylaxis. One study based on a mathematical model, demonstrated earlier onset of RSV epidemic over the period of years and regional difference of RSV epidemic in Japan (11).
Another study which divided Japan into 11 climate regions also showed
association between temperature and humidity and the number of RSV cases (12). One study conducted in Thailand showed positive association between RSV incidence and rainfall and relative humidity, and negative association between RSV incidence and average temperature (13). RSV epidemic is usually repeated over seasons, but there are some variations in some countries (14). Variations depend on the meteorological conditions, locations and territories. In the United States, early RSV epidemic was reported to be significantly associated with higher population density and race (15). Another study conducted in Spain showed RSV epidemic as a predictor of seasonal influenza (16). Several other studies also demonstrated association between certain infectious disease as predictors of other infectious diseases (17-19). Therefore, it is important to examine several other health related and environmental factors as
predictors of the RSV epidemic onset period, duration of the epidemic and the incidence of RSV to better equip pediatricians for the immunoprophalaxis therapy using Japanese data.
6 Methods
This study involved retrospective analysis of RSV related aggregated patients’
data published between 1st January 2012 and 31st December 2019 and reported in
Infectious Diseases Weekly Report (IDWR) by National Institute of Infectious Diseases. Data on meteorological parameters (temperature, humidity and the amount of rainfall) were obtained from the Japan Meteorological Agency. The meteorological data from prefectural capital were also used. When the data of the prefectural capital was not available, the data of the city with large population in the same prefecture was used.
Data on infectious diseases (RSV and influenza), population, immunoprophylaxis and area were collected from IDWR, Vital Statistics, National Database and Ministry of Land, Infrastructure, Transport and Tourism, respectively. RSV and influenza belong to category Ⅴ notifiable diseases and data on these infectious diseases are collected by sentinel surveillance. Therefore, data on cases per sentinel hospital are available. Weekly data on meteorological parameters and infectious diseases, monthly data on population and annual data on the number of palivizumab injections were available.
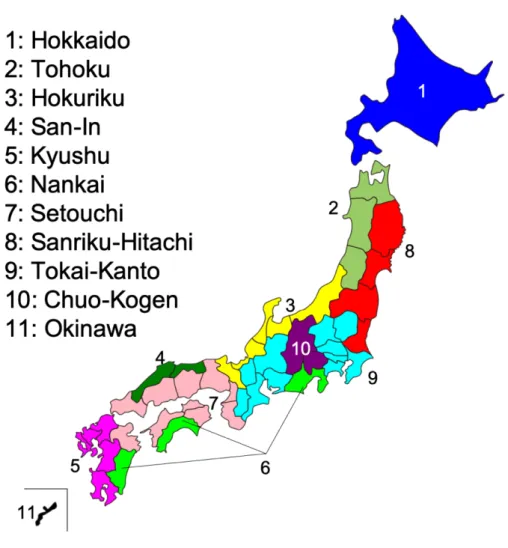
Japan is divided into 11 climate regions as Sekiguchi climate classification (Figure 1). National Institute of Infectious Diseases set the alert standard for influenza with onset of 30 cases per sentinel hospital and end with onset of 10 cases per sentinel hospital. Onset week and duration weeks of influenza epidemics are determined according to these values. However, RSV doesn’t have alert standard. So, different values were assumed (0.5, 1.0, 1.5, 2.0, 3.0, 3.45) as alert standards and analyses were conducted using each of the standards. A peak of 3.45 cases per sentinel hospital was observed in Japan. One previous study conducted in Japan used 0.5 cases per sentinel hospital as standard, this study also used 0.5 as standard (11).
7 order until December. The year 2015 had 53 weeks and the rest of the years had 52 weeks. The epidemic period ended when the cases per sentinel hospital was below the alert standard for 4 consecutive weeks. When there were two epidemics, the epidemic with the higher peak of cases per sentinel hospital was considered to be the epidemic. The number of onset week was set more than 52 or 53 week for infectious diseases whose epidemics sometimes continue to the next year.
Onset week, duration weeks of the epidemic and peak of cases per sentinel hospital of influenza in the previous year, and the number of immunoprophylaxis (palivizumab) in the previous year were considered as independent variables. In addition, area, population density, average temperature, average humidity and the total amount of rainfall were also considered as independent variables. RSV onset week, duration weeks of the epidemic and peak of cases per sentinel hospital were considered as dependent variables in separate models. These data based on each prefecture were collected as aggregated data and were used as weekly, monthly or yearly data in the statistical models. The statistical analysis was explorative analysis using ecological study design. Association between independent variables with dependent variables for this cross-sectional time series data was examined using hierarchal linear model after accounting for inter dependence between years. All statistical analyses were performed using STATA IC 16.1.
8 Figure 1: Sekiguchi Climate Classification
Results
Time series of RSV cases in each region (Hokkaido, Tohoku, Hokuriku, San-In, Kyushu, Nankai, Setouchi, Sanriku-Hitachi, Tokai-Kanto, Chuo-Kogen and Okinawa) are presented in Graph 1-11. Red line represents 0.5 cases per sentinel hospital. In each region, onset week differed by years. RSV epidemic onset in Hokkaido tended to be earlier over the year. The onset week in Tohoku, Hokuriku, San-In, Kyushu, Nankai, Setouchi, Sanriku-Hitachi, and Tokai-Kanto showed the similar trend, however, the peak of cases per sentinel hospital tended to increase over time in these regions. Onset week in Chuo-Kogen also showed the similar trend, but the peak of cases per sentinel
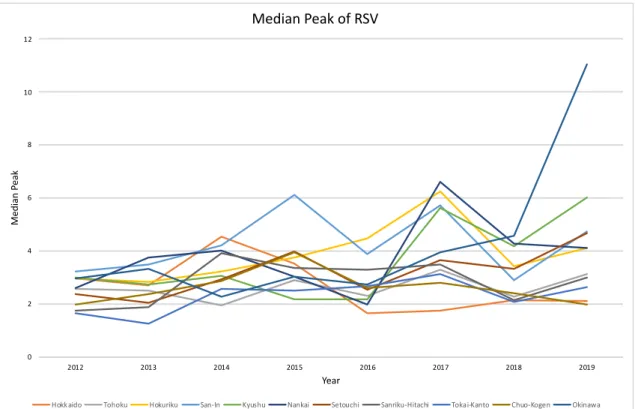
9 hospital showed a decreasing trend. Onset week in Okinawa did not show any trend, except in 2019 where the peak of cases per sentinel hospital showed upward trend. Median of RSV onset week, duration weeks and peak of cases per sentinel hospital are presented in Graph12-14. Duration weeks in Hokkaido was extremely long in 2017, but other than that, there seems to be no difference in other years. The peak of cases per sentinel hospital in all regions showed upward trend. Similar trends were observed in analyses using other alert standards (1.0, 1.5, 2.0, 3.0, 3.45). Median and interquartile ranges of RSV onset week, RSV duration weeks, RSV peak of cases per sentinel hospital, influenza onset week, influenza duration weeks, influenza peak of cases per sentinel hospital, average temperature, average humidity, total rainfall, the total number of palivizumab doses, area and population density by year are shown in Table 1.
In bivariable analysis, influenza onset week in the previous year was significantly associated with RSV onset week and RSV peak of cases per sentinel hospital (Table 2-4). Duration weeks of the epidemic and peak of cases per sentinel hospital of
influenza in the previous year were significantly associated with RSV onset week, RSV duration weeks, RSV peak of cases per sentinel hospital. The number of palivizumab doses in the previous year and population density were not significantly associated with RSV onset week. The number of palivizumab doses in the previous year and population density showed negative association with RSV duration weeks of the epidemic and RSV peak of cases per sentinel hospital (Table 3, 4). Influenza onset week, duration weeks and peak of cases per sentinel hospital in the previous year, average temperature, average humidity and total rainfall showed positive association with RSV peak of cases per sentinel hospital.
In multivariable analysis, only total rainfall was not significantly associated with RSV onset week, RSV duration weeks and RSV peak of cases per sentinel hospital
10 (Table 5-7). For RSV onset week, average temperature and use of palivizumab in the previous year showed positive association (Table 5). For RSV duration weeks, influenza onset week in the previous year, influenza peak of cases per sentinel hospital in the previous year, average humidity, area and population density also showed positive association (Table 6). For RSV peak of cases per sentinel hospital, influenza onset week in the previous year, influenza duration weeks of the epidemic in the previous year, average temperature, and population density also showed positive association (Table 7).
11 Graph 2: Time series of RSV cases reported per week in Tohoku
12 Graph 4: Time series of RSV cases reported per week in San-In
13 Graph 6: Time series of RSV cases reported per week in Nankai
14 Graph 8: Time series of RSV cases reported per week in Sanriku-Hitachi
15 Graph 10: Time series of RSV cases in Chuo-Kogen
16 Graph 12: Median Onset Week of RSV epidemic
Graph 13: Median Duration Weeks of RSV epidemic
0 5 10 15 20 25 30 35 40 45 50 2012 2013 2014 2015 2016 2017 2018 2019 Me di an O ns et W ee k Year
Median Onset Week of RSV
Hokkaido Tohoku Hokuriku San-In Kyushu Nankai Setouchi Sanriku-Hitachi Tokai-Kanto Chuo-Kogen Okinawa
0 20 40 60 80 100 120 2012 2013 2014 2015 2016 2017 2018 2019 Me di an D ur ati on W ee ks Year
Median Duration Weeks of RSV
17 Graph 14: Median Peak of RSV epidemic
Table 1: Median and interquartile ranges of RSV onset week and duration, influenza onset week and duration and environmental factors
0 2 4 6 8 10 12 2012 2013 2014 2015 2016 2017 2018 2019 Me di an P ea k Year Median Peak of RSV
Hokkaido Tohoku Hokuriku San-In Kyushu Nankai Setouchi Sanriku-Hitachi Tokai-Kanto Chuo-Kogen Okinawa
Median
(Interquartile Range) 2012 2013 2014 2015 2016 2017 2018 2019 p-value RSV Onset Week (week) 36 (34-38) 36 (32-37) 37 (35-39) 36 (34-41) 35 (33-36) 30 (28-31) 28 (27-30.5) 30 (28-31) <0.01 RSV Duration Weeks (weeks) 19 (17-27) 22 (18-28) 22 (17-29) 20 (17-26) 21 (15-26) 27 (21-36) 20 (16-28) 17 (15-19) <0.01 RSV Peak (case/hospital) 2.4 (1.6-3.0) 2.6 (1.4-3.0) 3.0 (2.3-4.0) 3.0 (2.5-4.1) 2.6 (2.0-3.1) 3.9 (2.9-5.6) 3.0 (2.1-4.0) 4.1 (2.6-5.9) <0.01
Influenza Onset Week (week) 56 (56-56) 57 (56-57) 54 (52-54) 58 (58-59) 56 (55-56) 55 (54-55) 54 (54-55) 51.5 (50-52) <0.01
Influenza Duration Weeks (weeks) 6 (5-8) 9 (8-10) 7 (6-8) 8 (7-9) 8 (7-9) 8 (8-10) 6 (5-7) 7 (7-7) <0.01 Influenza Peak (case/hospital) 44.9 (39.5-50.8) 36.3 (31.0-41.3) 33.7 (27.8-42.6) 41.9 (34.3-57.6) 42.0 (36.3-47.0) 39.1 (30.4-44.5) 54.2 (48.6-64.7) 55.3 (47.6-65.7) <0.01 Average Temperature (℃) 16.2 (7.1-22.8) 15.6 (7.9-23.6) 16.0 (7.7-22.7) 16.9 (8.4-22.1) 16.7 (9.0-23.8) 16.1 (7.5-22.4) 16.6 (9.1-22.8) 16.8 (9.1-23.4) <0.01 Average Humidity (%) 71.0 (65.0-76.0) 69.0 (62.0-75.0) 70.0 (63.0-76.0) 71.0 64.0-77.0) 71.0 (64.0-77.0) 70.0 (63.0-76.0) 71.0 (65.0-77.0) 71.0 (64.0-77.0) <0.01 Total Rainfall (mm) 22.5 (6.5-44.0) 17.0 (4.5-41.0) 20.0 (5.5-43.5) 23.0 (7.5-45.0) 24.0 (7.0-46.5) 17.0 (4.0-39.5) 18.5 (4.0-43.5) 17.0 (4.0-41.0) <0.01 Palivizumab (dose) - -2997.5 (1203-5553) 3516 (1496-6214) 3819 (2362-6456) 2675 (1791-5129) 2554 (1472-4230) - 0.334 Area (k㎡) 5761.6 (4105.8-7267.9) 5761.6 (4105.8-7267.9) 5761.6 (4105.8-7267.9) 5761.6 (4105.8-7267.9) 5761.6 (4105.8-7267.9) 5761.6 (4105.8-7267.9) 5761.6 (4105.8-7267.9) 5761.6 (4105.8-7267.9) 0.998 Popuation Density (person/k㎡) 275.7 (186.2-524.0) 274.7 (184.7-520.6) 273.8 (183.3-517.6) 273.4 (181.3-516.0) 272.3 (179.9-512.8) 271.4 (178.2-509.8) 269.9 (176.3-506.0) 268.3 (174.4-501.5) 0.998
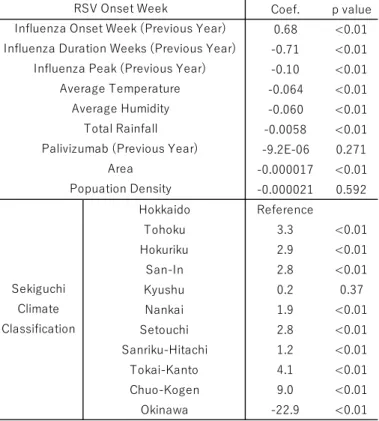
18 Table 2: Bivariable analysis between RSV onset week and independent variables
Table 3: Bivariable analysis between RSV duration weeks and independent variables Coef. p value 0.68 <0.01 -0.71 <0.01 -0.10 <0.01 -0.064 <0.01 -0.060 <0.01 -0.0058 <0.01 -9.2E-06 0.271 -0.000017 <0.01 -0.000021 0.592 Hokkaido Reference Tohoku 3.3 <0.01 Hokuriku 2.9 <0.01 San-In 2.8 <0.01 Kyushu 0.2 0.37 Nankai 1.9 <0.01 Setouchi 2.8 <0.01 Sanriku-Hitachi 1.2 <0.01 Tokai-Kanto 4.1 <0.01 Chuo-Kogen 9.0 <0.01 Okinawa -22.9 <0.01 Total Rainfall Palivizumab (Previous Year)
Area Popuation Density
RSV Onset Week
Influenza Onset Week (Previous Year) Influenza Duration Weeks (Previous Year)
Influenza Peak (Previous Year) Average Temperature Average Humidity Sekiguchi Climate Classification Coef. p value -0.022 0.759 0.38 <0.01 0.091 <0.01 0.045 <0.01 0.084 <0.01 0.0087 <0.01 -2.5E-04 <0.01 0.000156 <0.01 -0.001048 <0.01 Hokkaido Reference Tohoku -16.7 <0.01 Hokuriku -13.6 <0.01 San-In -13.2 <0.01 Kyushu -8.5 <0.01 Nankai -9.5 <0.01 Setouchi -9.7 <0.01 Sanriku-Hitachi -11.9 <0.01 Tokai-Kanto -18.2 <0.01 Chuo-Kogen -21.5 <0.01 Okinawa -3.9 <0.01 Total Rainfall Palivizumab (Previous Year)
Area Popuation Density Sekiguchi Climate Classification Average Humidity RSV Duration Weeks Influenza Onset Week (Previous Year) Influenza Duration Weeks (Previous Year)
Influenza Peak (Previous Year) Average Temperature
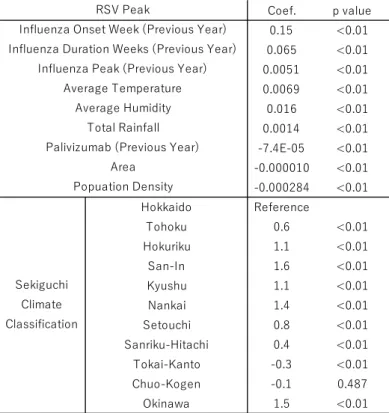
19 Table 4: Bivariable analysis between RSV peak and independent variables
Table 5: Multivariable Analysis between RSV onset week and independent variables Coef. p value 0.15 <0.01 0.065 <0.01 0.0051 <0.01 0.0069 <0.01 0.016 <0.01 0.0014 <0.01 -7.4E-05 <0.01 -0.000010 <0.01 -0.000284 <0.01 Hokkaido Reference Tohoku 0.6 <0.01 Hokuriku 1.1 <0.01 San-In 1.6 <0.01 Kyushu 1.1 <0.01 Nankai 1.4 <0.01 Setouchi 0.8 <0.01 Sanriku-Hitachi 0.4 <0.01 Tokai-Kanto -0.3 <0.01 Chuo-Kogen -0.1 0.487 Okinawa 1.5 <0.01 Average Humidity Total Rainfall Palivizumab (Previous Year)
Area Popuation Density Sekiguchi Climate Classification RSV Peak
Influenza Onset Week (Previous Year) Influenza Duration Weeks (Previous Year)
Influenza Peak (Previous Year) Average Temperature Coef. p value -0.12 0.009 -0.10 0.001 -0.079 <0.01 0.012 0.013 -0.011 0.015 0.0014 0.096 0.000063 <0.01 -0.00026 <0.01 -0.00091 <0.01 -1.8 0.002 Hokkaido Reference Tohoku -15.6 <0.01 Hokuriku -15.4 <0.01 San-In -16.9 <0.01 Kyushu -16.7 <0.01 Nankai -15.1 <0.01 Setouchi -15.7 <0.01 Sanriku-Hitachi -17.8 <0.01 Tokai-Kanto -14.5 <0.01 Chuo-Kogen -10.2 <0.01 Okinawa -40.4 <0.01 RSV Onset Week Sekiguchi Climate Classification
Influenza Onset Week (Previous Year) Influenza Duration Weeks (Previous Year)
Influenza Peak (Previous Year) Average Temperature Average Humidity Total Rainfall Palivizumab(Previous Year) Area Popuationdensity Year
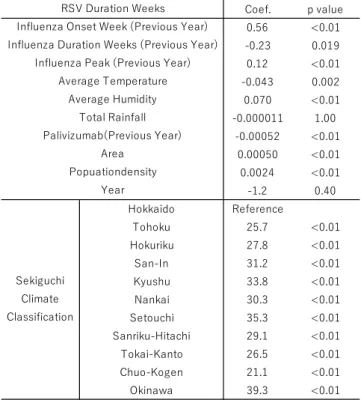
20 Table 6: Multivariable analysis between RSV duration weeks and independent variables
Table 7: Multivariable analysis between RSV peak and independent variables
Coef. p value 0.56 <0.01 -0.23 0.019 0.12 <0.01 -0.043 0.002 0.070 <0.01 -0.000011 1.00 -0.00052 <0.01 0.00050 <0.01 0.0024 <0.01 -1.2 0.40 Hokkaido Reference Tohoku 25.7 <0.01 Hokuriku 27.8 <0.01 San-In 31.2 <0.01 Kyushu 33.8 <0.01 Nankai 30.3 <0.01 Setouchi 35.3 <0.01 Sanriku-Hitachi 29.1 <0.01 Tokai-Kanto 26.5 <0.01 Chuo-Kogen 21.1 <0.01 Okinawa 39.3 <0.01 Total Rainfall Palivizumab(Previous Year) Area Popuationdensity Year Sekiguchi Climate Classification RSV Duration Weeks Influenza Onset Week (Previous Year) Influenza Duration Weeks (Previous Year)
Influenza Peak (Previous Year) Average Temperature Average Humidity Coef. p value 0.19 <0.01 0.26 <0.01 -0.0030 0.034 0.0041 0.037 -0.0052 0.005 -0.00039 0.27 -0.000087 <0.01 -0.000053 <0.01 0.00023 <0.01 0.23 0.45 Hokkaido Reference Tohoku -3.4 <0.01 Hokuriku -3.1 <0.01 San-In -2.5 <0.01 Kyushu -3.1 <0.01 Nankai -2.9 <0.01 Setouchi -3.0 <0.01 Sanriku-Hitachi -3.7 <0.01 Tokai-Kanto -3.9 <0.01 Chuo-Kogen -4.2 <0.01 Okinawa -3.2 <0.01 RSV Peak Year Sekiguchi Climate Classification
Influenza Onset Week (Previous Year) Influenza Duration Weeks (Previous Year)
Influenza Peak (Previous Year) Average Temperature Average Humidity Total Rainfall Palivizumab(Previous Year) Area Popuationdensity
21 Discussion
Published studies showed a change in RSV incidence in recent years, while several studies examined the factors associated with these changes. For example, Shobugawa et al. and Obando-Pacheco et al. observed association between
meteorological and demographic factors and incidence and epidemic onset of RSV (12, 14). Several other studies reported association between infectious diseases such as influenza incidence and RSV onset (16-19). The current study observed association between RSV epidemic and influenza incidence and palivizumab prophylaxis used in the previous year in addition to meteorological and demographic factors. Together, these studies showed that, not only influenza, meteorological and demographic factors might influence the onset of RSV epidemic.
The current study showed that epidemics of influenza was associated with RSV epidemic. It might be due to the fact that some of the infectious diseases might influence each other or there were similar confounders that determine the epidemic of these infectious diseases. The reasons why influenza epidemic in the previous year influenced RSV epidemic were unclear. Several previous studies reported that influenza epidemic might affect other respiratory agents including RSV (20, 21). Other studies also showed that pandemic influenza A(H1N1) 2009 delayed the onset of RSV epidemic (22-24). Authors of these articles speculated that these changes could be due to mutual viral interference leading to competitive forms of pathogen-pathogen interactions. In addition, Khaitov et al. showed that infected cells produce interferon and cytokines to fight against the virus (25). Pinky et al. showed that viruses compete for the resource of target cells, and that viruses with faster growth rates can overcome viruses with slower growth rates (26). Therefore, there might be time interval during which secondary virus infection doesn’t occur after primary infection because primary
22 virus consumes all the target cell completely. This speculation is consistent with the result that influenza epidemic delayed RSV epidemic in the current study.
Based on adjusted analyses in the current study, RSV onset showed negative association with influenza onset which was not consistent with results of other studies. On the other hand, RSV duration weeks of the epidemic and RSV peak of cases per sentinel hospital showed negative association with influenza duration weeks of the epidemic and influenza peak of cases per sentinel hospital, respectively. These results may reflect the competitive relationship between influenza and RSV.
This study has several limitations. We used ecologic study design used for this investigation which is weak in nature and generates only association, not necessarily causal association. There might be some potential confounders in this study. For example, influenza epidemic in the previous year could change the behavior related to hygiene in the following year. Public measures adopted in the previous year, the number of prescriptions of anti-influenza drug and the number of influenza vaccines might be also potential confounders. Another limitation of this study was the surveillance system for RSV which was based on sentinel surveillance. Thus, it was difficult to know the total number of RSV cases with the current system. Under these circumstances, it was also difficult to determine the epidemic of RSV. Based on these limitations, the actual RSV onset week and duration weeks of the epidemic may be different. Future studies are needed to examine the onset of RSV epidemic and its duration based on RSV incidence.
Conclusion
Influenza epidemic, meteorological factors and demographic factors showed association with RSV epidemic onset and its duration based on aggregated data. These
23 findings may help better understand RSV epidemic in Japan.
References 1. Shi T, McAllister DA, O'Brien KL, Simoes EAF, Madhi SA, Gessner BD, et al. Global, regional, and national disease burden estimates of acute lower respiratory infections due to respiratory syncytial virus in young children in 2015: a systematic review and modelling study. Lancet. 2017;390(10098):946-58. 2. Palivizumab, a humanized respiratory syncytial virus monoclonal antibody, reduces hospitalization from respiratory syncytial virus infection in high-risk infants. The IMpact-RSV Study Group. Pediatrics. 1998;102(3 Pt 1):531-7. 3. Fenton C, Scott LJ, Plosker GL. Palivizumab: a review of its use as prophylaxis for serious respiratory syncytial virus infection. Paediatr Drugs. 2004;6(3):177-97. 4. Morris SK, Dzolganovski B, Beyene J, Sung L. A meta-analysis of the effect of antibody therapy for the prevention of severe respiratory syncytial virus infection. BMC Infect Dis. 2009;9:106. 5. Chan M, Park JJ, Shi T, Martinón-Torres F, Bont L, Nair H, et al. The burden of respiratory syncytial virus (RSV) associated acute lower respiratory infections in children with Down syndrome: A systematic review and meta-analysis. J Glob Health. 2017;7(2):020413. 6. Chaw PS, Wong SWL, Cunningham S, Campbell H, Mikolajczyk R, Nair H, et al. Acute Lower Respiratory Infections Associated With Respiratory Syncytial Virus in Children With Underlying Congenital Heart Disease: Systematic Review and Meta-analysis. J Infect Dis. 2019.
24 7. Dickstein Y, Oster Y, Shimon O, Nesher L, Yahav D, Wiener-Well Y, et al. Antibiotic treatment for invasive nonpregnancy-associated listeriosis and mortality: a retrospective cohort study. Eur J Clin Microbiol Infect Dis. 2019;38(12):2243-51. 8. Shi T, Balsells E, Wastnedge E, Singleton R, Rasmussen ZA, Zar HJ, et al. Risk factors for respiratory syncytial virus associated with acute lower respiratory infection in children under five years: Systematic review and meta-analysis. J Glob Health. 2015;5(2):020416.
9. Guidelines for the Use of Palivizumab in Japan. [Translated from Japanese.] (https://www.jpeds.or.jp/uploads/files/20190402palivizumabGL.pdf)
10. Revision of Guidelines for the Use of Palivizumab in Japan. [Translated from Japanese.] (https://www.jpeds.or.jp/uploads/files/20180426palivizumab_kaitei.pdf) 11. Yamagami H, Kimura H, Hashimoto T, Kusakawa I, Kusuda S. Detection of the Onset of the Epidemic Period of Respiratory Syncytial Virus Infection in Japan. Front Public Health. 2019;7:39. 12. Shobugawa Y, Takeuchi T, Hibino A, Hassan MR, Yagami R, Kondo H, et al. Occurrence of human respiratory syncytial virus in summer in Japan. Epidemiol Infect. 2017;145(2):272-84. 13. Thongpan I, Vongpunsawad S, Poovorawan Y. Respiratory syncytial virus infection trend is associated with meteorological factors. Sci Rep. 2020;10(1):10931. 14. Obando-Pacheco P, Justicia-Grande AJ, Rivero-Calle I, Rodríguez-Tenreiro C, Sly P, Ramilo O, et al. Respiratory Syncytial Virus Seasonality: A Global Overview. J Infect Dis. 2018;217(9):1356-64.
25 15. Noveroske DB, Warren JL, Pitzer VE, Weinberger DM. Local variations in the timing of RSV epidemics. BMC Infect Dis. 2016;16(1):674. 16. Míguez A, Iftimi A, Montes F. Temporal association between the influenza virus and respiratory syncytial virus (RSV): RSV as a predictor of seasonal influenza. Epidemiol Infect. 2016;144(12):2621-32. 17. de Gier B, Vlaminckx BJM, Woudt SHS, van Sorge NM, van Asten L. Associations between common respiratory viruses and invasive group A streptococcal infection: A time-series analysis. Influenza Other Respir Viruses. 2019;13(5):453-8. 18. Castro-Rodriguez JA, Jakubson L, Padilla O, Gallegos D, Fasce R, Bertrand P, et al. Many respiratory viruses have temporal association with meningococcal disease. Allergol Immunopathol (Madr). 2015;43(5):487-92. 19. Gilca R, Fortin E, Frenette C, Longtin Y, Gourdeau M. Seasonal variations in Clostridium difficile infections are associated with influenza and respiratory syncytial virus activity independently of antibiotic prescriptions: a time series analysis in Quebec, Canada. Antimicrob Agents Chemother. 2012;56(2):639-46. 20. Glezen WP, Paredes A, Taber LH. Influenza in children. Relationship to other respiratory agents. JAMA. 1980;243(13):1345-9. 21. Anestad G. Surveillance of respiratory viral infections by rapid immunofluorescence diagnosis, with emphasis on virus interference. Epidemiol Infect. 1987;99(2):523-31. 22. Mak GC, Wong AH, Ho WY, Lim W. The impact of pandemic influenza A (H1N1) 2009 on the circulation of respiratory viruses 2009-2011. Influenza Other Respir Viruses. 2012;6(3):e6-10.
26 23. Casalegno JS, Ottmann M, Bouscambert-Duchamp M, Valette M, Morfin F, Lina B. Impact of the 2009 influenza A(H1N1) pandemic wave on the pattern of hibernal respiratory virus epidemics, France, 2009. Euro Surveill. 2010;15(6). 24. Yang Y, Wang Z, Ren L, Wang W, Vernet G, Paranhos-Baccalà G, et al. Influenza A/H1N1 2009 pandemic and respiratory virus infections, Beijing, 2009-2010. PLoS One. 2012;7(9):e45807. 25. Khaitov MR, Laza-Stanca V, Edwards MR, Walton RP, Rohde G, Contoli M, et al. Respiratory virus induction of alpha-, beta- and lambda-interferons in bronchial epithelial cells and peripheral blood mononuclear cells. Allergy. 2009;64(3):375-86. 26. Pinky L, Dobrovolny HM. Coinfections of the Respiratory Tract: Viral Competition for Resources. PLoS One. 2016;11(5):e0155589.