JAIST Repository
https://dspace.jaist.ac.jp/
Title A Survey on Internet of Things for Smart Health Technologies [課題研究報告書]
Author(s) Le, Duy Tan Citation
Issue Date 2018-03
Type Thesis or Dissertation Text version author
URL http://hdl.handle.net/10119/15251 Rights
Description Supervisor:丹 康雄, 先端科学技術研究科, 修士(情
A Survey on Internet of Things
for
Smart Health Technologies
LE Duy Tan
Graduate School of Advanced Science and Technology
Japan Advanced Institute of Science and Technology
A Survey on Internet of Things
for
Smart Health Technologies
s1610217 LE Duy Tan
Supervisor :
Yasuo Tan
Main Examiner : Yasuo Tan
Examiners :
Yuto Lim
Yoichi Shinoda
Razvan Beuran
Graduate School of Advanced Science and Technology
Japan Advanced Institute of Science and Technology
[Information Science]
February, 2018
Abstract
Nowadays, accompanying with prolonged life expectancy, there is an increase of chronic diseases which include obesity, diabetes, cardiovascular diseases, cancer, osteoporosis and dental diseases at the global level. As a result, the task of supporting, enhancing and improving upon the existing healthcare services poses a wide range of challenges. Accord-ingly, the utilization of sophisticated technologies in the healthcare field, which is called “smart health”, is not an optional value, but a requirement. It is accepted that the In-ternet of Things (IoT) is the core technology of smart health. The adoption of advanced technology, particularly Internet of Things (IoT), in the field of medicine and healthcare, benefits patients with better medical assistance, reduce a treatment time, lower medical costs and more satisfying healthcare services.
Many efforts have been made and a large body of research regarding the potential and implementation of IoT in healthcare already existed. The main problem, however, is the need for a comprehensive literature review which states the extensive overview of the field and advances in IoT-based healthcare technologies in the aspect of system architecture. This study aims to state the comprehensive overview of the field and advances in IoT-based healthcare technologies in the aspect of system architecture. The research survey investigates and summarizes the existing knowledge, state-of-the-art technologies of each aspect in the field. Further, this research provides an exhaustive understanding of the successful case studies on the IoT in the healthcare context which is expected to be useful for further research. Following the structure of standard IoT-based healthcare system architecture, the summary of our project paper is given as follows.
First of all, we identify physiological information, the environmental aspects, as well as indoor location information. They are the necessary data that needs to be collected in order to ensure the quality of life, safety, and well-being. Vital signs, which primary are temperature, pulse rate (heart rate), respiration rate (breathing rate) and blood pressure, are essentially physiological signs to indicate the status of the body. Besides, several extra medical signs for example muscle activity level, blood glucose level, gaseous carbon dioxide
levels (CO2), electrical activity in the brain are all essential to track down the healthcare
Secondly, we discuss and investigate between recent advances in sensor technology, mi-croelectronics, and telecommunication which applied to collect and monitor healthcare data. The environmental sensors can be used to capture environmental parameters. For instance, accelerometer and compass sensors are applied in location monitoring applica-tion while the biomedical sensors such as electrocardiogram (ECG) and photoplethys-mography (PPG) sensors can be used to monitor the health figure of the human. The collected data can be analyzed and sent to the server through communication technolo-gies. Wildly known technologies in smart health field are RFID, NFC, Wifi, 6LowPAN, Bluetooth, ZigBee. Advantages of in sensor technology and common sensor devices are defined. The flexibility, communication efficiency and cost-effective of using Body Area Networks Architecture in healthcare are also presented. Furthermore, we compare among IEEE 802.15.1 (Bluetooth), 802.15.4 (the basis for Zigbee) and 802.15 (standard for wire-less personal area network - WPAN), these are the most commonly employed wirewire-less communication standards in BANs.
In the healthcare field, especially in healthcare monitoring system, the reliability of input data is extremely important. Accurate healthcare decisions can only be obtained with accurate input data. However, it is possible to have noise and outliers in sensor data. It is caused by (1) low quality sensors or errors of the sensors and (2) occurrence of noise or motion artifacts in all sensor networks. Consequently, these might lead to faults in reading and giving alarm for patient and healthcare provider deliveries. In other to control data quality, the collected data need to go through preprocessing steps before being analyzed by algorithms. We employ several criteria including usage, referable, possibility, popularity, standardization and intelligence to evaluate the impact of algorithms. The most critical data preprocessing algorithms in the healthcare system can be classified into two categories: imperfect data and imbalanced data preprocessing methods. The chart is used to demonstrate the evolution of academic publications concerning the data preprocessing algorithms from 1990 to 2016 while constructing tables thoroughly reviews the detailed figure of them from 2010 to 2016. Publication statistics are acquired from Google Scholar; the search query is defined as the subfield name of algorithms and at least one term of medical or health appearing, for example, “‘support vector machine’ AND medical OR health”.
IoT-based healthcare systems can be utilized to a diverse array of fields, including care for pediatric and elderly patients, the supervision of chronic diseases, and the management of private health and fitness, among others. Starting from the most successful support vec-tor machine algorithm, we identify plausible architectures in the healthcare domain. The research trends in algorithms applied for healthcare decision support systems as well as the number of publication referring to several algorithms are analyzed. Among abundant IoT-based healthcare applications, we can classify them into two main categories: perva-sive monitoring and medical informatics applications. In order to provide the overview, we summarize the feature IoT-based healthcare applications.
Sensor data issues, the accuracy of indoor location monitoring system and system design are emerging as the principal challenges and limitations in the IoT-based healthcare area. We briefly clarify these issues and through the final discussions, further areas that would
benefit from the introduction of IoT technologies will be identified.
As a second study, based on the general system architecture we conduct the implemen-tation of the smart healthcare system. The system applied modern technologies to solve the current problem in smart healthcare. Besides, the implemented system is expected to be useful for further research.
Regarding future works, we propose an Integrated Home-Based Healthcare Monitoring
System ensuring wellness for each individual lives in the house. In this system, the
data collected by health sensors, environment sensors, and location sensors will be pre-processed and sent to the Smart Health Platform through the IoT gateway. The Smart Health Platform not only stores the data but also controls the connectivity of devices and provides the APIs for the third-party application. The Smart Health Applications can provide several safety applications such as fall detection and emergency assistance.
Through the survey, researchers can get enough understanding, save their time in searching articles and reduce repetitious work for supporting the task of designing and developing the smart healthcare system. Besides, stakeholders, healthcare manufacturers, family members and especially patients will get benefit from our research.
Keywords. Internet of things, healthcare, technologies, smart health, applications, networks, sensors
Acknowledgements
I would like to express my very great appreciation to my supervisor, Professor Yasuo Tan. From commencement in finding an appropriate subject to the finalization of my research, Professor Yasuo Tan offers his unreserved help and guidance and lead me to finish my thesis step by step. His lectures are always inspiring me and bring me to a higher level of thinking. What I learn from him is not just only about the knowledge but also how to view and approach problems in a new perspective. Without his kind and patient instruction, it is impossible for me to finish this thesis.
I would like to thank Associate Professor Yuto Lim, my second supervisor, for his guidance and support throughout my study. Thanks to his pieces of advice, not only my presentation slides but also my thesis become better and better.
I am particularly grateful for the assistance given by Associate Professor Razvan Beuran and Professor Yoichi Shinoda. As committee members of my defenses, they provided instructive questions and helpful comments to clarify and improve my research.
I wish to acknowledge the help provided by Professor Nak Young Chong. Without his provided equipment, it is difficult for me to finish the implementation part of my thesis.
I would like to convey my special thank to Associate Professor Nguyen Le Minh and Dr. Tuan Nguyen for giving me a chance to study in Japan.
Completing this work would have been more difficult without the support and friendship provided by the other lecturers, friends at JAIST, V-Project 2016 members, especially Quyen Dang, Quynh Le, Duy Huynh, Viet Lai, Phi Hung, Pong Pi, Kris, and Quynh Dao, etc. I am indebted to them for their help.
Finally, I would like to express the most sincere gratitude to my family and parents for their support and provide a carefree environment for me, so that I can concentrate on my study.
Contents
1 Introduction 1 1.1 Research Motivation . . . 1 1.2 Research Background . . . 2 1.3 Research Objective . . . 3 1.4 Research Outline . . . 4 2 Sensor Data 5 2.1 Introduction . . . 5 2.2 Physiological information . . . 5 2.2.1 Vital signs . . . 52.2.2 The Extra Medical Signs . . . 7
2.3 The Environmental Aspects and Indoor Location Information . . . 9
3 Supporting Infrastructure and Technology 11 3.1 Introduction . . . 11
3.2 Sensor Technology . . . 11
3.2.1 The Advance in Sensor Technology . . . 11
3.2.2 Some Common Sensor Devices . . . 12
3.3 Communication Technology . . . 18
3.3.1 Body Area Networks Architecture . . . 18
3.3.2 Wireless Communication Technology . . . 20
4 Data Preprocessing 23 4.1 Introduction . . . 23
4.2 Imperfect data . . . 26
4.2.1 Missing Data Imputation . . . 26
4.2.2 Noise filtering . . . 30
5.3.2 Medical Informatics - Prediction . . . 43
6 Open Challenges and Issues 47 6.1 Introduction . . . 47
6.2 Sensor Data Problem . . . 48
6.3 Smartphone Application - Indoor Location Monitoring Problem . . . 50
6.4 The Overall System Design Problem . . . 51
7 Implementation 54 7.1 Introduction . . . 54
7.2 E4 Wristband Wearable Device . . . 56
7.3 Android Gateway Application . . . 59
7.3.1 S-Healthcare gateway . . . 59
7.3.2 Empatica RT . . . 62
7.4 Database Server . . . 63
7.4.1 Google Firebase Database Server . . . 63
7.4.2 Empatica Connect . . . 65 7.5 Service Application . . . 66 8 Conclusion 72 8.1 Concluding Remarks . . . 72 8.2 Contributions . . . 74 8.3 Future work . . . 75
A Review Selected Indoor Location Systems 78 A.1 CASAS: A Smart Home in a Box [112] . . . 78
A.2 Smartphone-Based Real-Time Indoor Location Tracking With 1-m Preci-sion [113] . . . 80
B A Study on RNN and LSTM Algorithm for Smart Healthcare System 82 B.1 Overview . . . 82
B.2 Feed-Forward Neural Network . . . 82
B.3 Recurrent Neural Networks (RNNs) . . . 84
B.3.1 V . . . 87
B.3.2 W . . . 88
B.3.3 U . . . 89
B.4 The vanishing and exploding gradients problem of RNNs . . . 89
B.5 Long Short-Term Memory (LSTM) . . . 90
B.6 Tensorflow . . . 92
B.6.1 Overview . . . 92
B.6.2 Install Tensorflow . . . 92
B.7 Conclusions and future works . . . 95
List of Figures
1.1 Applications of the Internet of Things by the year 2025 . . . 1
1.2 The process of literature review based on the general smart healthcare system architecture. . . 4
3.1 The standard process for capturing PPG signal and example of PPG signal [29]. . . 14
3.2 The example of EDA signal. . . 16
3.3 Graphical demonstration of physiological sensor placement. . . 17
3.4 A three-tier architecture based on a BAN communication system [40] . . . 19
3.5 Complete MICS communication network. [48] . . . 20
4.1 The classification of most influential data preprocessing algorithms in health-care. . . 24
4.2 Evolution of academic publications concerning the data preprocessing frame-works. . . 25
4.3 Flow chart for the expectation maximization algorithm . . . 27
4.4 Flow chart for the multiple imputation algorithm. . . 29
4.5 An illustration of how to create the synthetic data points in the SMOTE technique [65] . . . 33
4.6 Flow chart for SMOTE. . . 36
5.1 Architecture of a Support Vector Machine classifier. [88] . . . 38
5.2 Architecture of a Fuzzy logic approach. . . 40
5.3 A recurrent neural network and the unfolding in time of the computation involved in its forward computation. . . 41
5.4 Evolution of academic publications concerning the methods in healthcare applications. . . 42
6.1 The vital issues based on the general smart healthcare system architecture. 47 6.2 Human-in-the-loop (Doctor-in-the-loop) Concept [3] . . . 53
7.5 Empatica RT application (a) Main Screen (b) Visualization Screen . . . 62
7.6 An example of JSON file name stored in Google Firebase Database Server 64 7.7 The Empatica Connect Interface. . . 66
7.8 Project Structure of a Django project . . . 68
7.9 The screenshot of the data visualization process (a) Healthcare System Online Service main screen (b) Data Visualization. . . 71
8.1 The proposed integrated home-based healthcare system . . . 77
A.1 CASAS smart home components. . . 79
A.2 Smartphone-Based Real-Time Indoor Location Tracking With 1-m Precision 81 B.1 Feed-Forward Neural Network . . . 83
B.2 Feed-Forward Neural Network by vector notation . . . 83
B.3 A recurrent neural network and the unfolding in time of the computation involved in its forward computation. [114] . . . 85
B.4 Example in case of 3 layers, W is used in every step up to the output we care about, we need to backpropagate gradients from t = 3 through the network all the way to t = 0. [114] . . . 89
B.5 Memory cells of LSTM . . . 90
B.6 The repeating module in an LSTM contains four interacting layers. . . 91
B.7 Tensorflow Data flow graph example. . . 92
List of Tables
2.1 The basic vital signs. . . 7
3.1 Some common sensor devices in healthcare applications. . . 13
3.2 Wireless communication protocols in BANs. . . 21
3.3 Comparison of Classic Bluetooth and Bluetooth Low Energy (BLE) [46] . . 22
4.1 The number of publication referring to three widely used imputation data algorithms in healthcare applications from 2010 to 2016 by Google Scholar. 29 4.2 The number of publication referring to two widely used noise filtering al-gorithms in healthcare applications from 2010 to 2016 by Google Scholar. . 32
4.3 The number of publication referring to Synthetic Minority Over-Sampling Technique - SMOTE in health care applications from 2010 to 2016 by Google Scholar. . . 35
5.1 The number of publication referring to several algorithms in healthcare applications from 2010 to 2016 by Google Scholar. . . 39
5.2 Summary of IoT-based healthcare applications . . . 44
5.3 Popular software packages that provide algorithms implementation. . . 45
5.4 Smartphone application for healthcare. . . 46
7.1 Technical aspects of Empatica E4 wristband sensors . . . 58
7.2 The applied Java method to retrieve the real-time data-streams from S-Healthcare gateway application . . . 60
7.3 Features provided by Google Firebase Database Server . . . 63
A.1 Strength and Weakness of the research . . . 78
B.1 The notations have been used in this report . . . 85
Abbreviation
APIs Application Package Interfaces
BANs Body Area Networks
BLE Bluetooth Low Energy
BP Blood Pressure
bPCA Bayesian Principal Component Analysis
bpm Beats Per Minute
BSN Body Sensor Network
BVP Blood Volume Pulse
DBN Deep Belief Network
DM Decision-Making
DNN Deep Neural Network
ECG Electrocardiogram
EDA Electrodermal Activity
EEG Electroencephalogram
EF Ensemble Filter
EIRP Effective Isotropic Rediated Power
EM Expectation-Maximization
EMG Electromyography
ETSI European Telecommunications Standards Institute
FFT Fast Fourier Transforms
FKM Fuzzy K-Means
FL Fuzzy Logic
GPUs Graphics Processing Units
GSR Galvanic Skin Response
HITL Human In The Loop
HR Heart Rate
IBI Inter Beat Interval
IDE Integrated Development Environment
IoT Internet Of Things
IPF Iterative-Partitioning Filter
IPSO Internet Protocol For Smart Objects Alliance
ITIF Information Technology and Innovation Foundation
JSON Javascript Object Notation
KNN K-Nearest Neighbors
kNNI K-Nearest Neighbor Imputation
LSTM Long Short-Term Memory
MEMS Micro-Electro Mechanical Systems
MI Multiple Imputation
MICE Multiple Imputations By Chained Equations
MICS Medical Implant Communication Service
nW Nanowatt
PCBs Printed Circuit Boards
PDA Personal Digital Assistant
PEM Personal ECG Monitoring
PPG Photoplethysmography
PSD Power Spectral Density
SIG Bluetooth Special Interest Group
SMOTE Synthetic Minority Over-Sampling Technique
SOA Service-Oriented Approach
SVD Singular Value Decomposition
SVM Support Vector Machines
TRL Technological Readiness Levels
URUS Ubiquitous Networking Robotics in Urban Settings
UWB Ultra-Wideband
WHO World Health Organization
WIP Work In Progress
WLAN Wireless Local Area Networks
WPAN Wireless Personal Area Network
Chapter 1
Introduction
1.1
Research Motivation
Figure 1.1: Applications of the Internet of Things by the year 2025
Nowadays, quality of life improves in advanced societies, life expectancy and the pro-portion of elderly citizens is projected to increase globally. In particularly, the propro-portion of Japanese population is above age 65 in 2015 is 26%. This proportion is estimated to reach one-third of the total population in 2050 according to United Nations Population
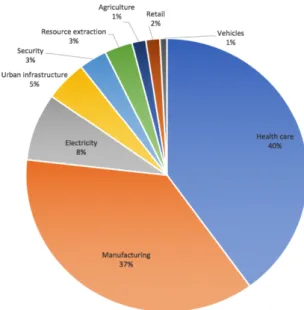
optional choice, but a requirement [3]. The concept of smart health is defined by the technology which must satisfy two main conditions. The first one is the achievement of better diagnostic tools and better treatment for patients. The second condition is iden-tified through the improvement of life quality. The Internet of Things (IoT) is generally accepted not only as a connected set of anyone, anything, anytime, anyplace, any service and any network but also as the core technology of smart health. The use of modern technology, particularly Internet of Things (IoT) in the field of medicine and healthcare will benefit patients with better medical assistance, shorten treatment time, lower medical costs and more satisfying health care services [4]. Moreover, health care applications and related IoT-based services are expected to be about 40% of the whole annual economic impact caused by the IoT. While the IoT is estimated to be in range of $2.7 trillion to $6.2 trillion by the year 2025 [5], the IoT-based services can possibly contribute $1.08 trillion to 2.48 trillion. Fig 1.1 presents the projected market share of dominant IoT applications by the year 2025.
1.2
Research Background
Many efforts have been made as well as a large body of research regarding the potential of IoT and its applications in healthcare have already existed. Besides, there are several published survey papers that explore different aspects of the IoT technology in the field.
• L´opez in [6] conducted a literature review of the IoT for specific clinical wireless
de-vices using 6LoWPAN/IEEE 802.15.4, Bluetooth and NFC for mHealth and eHealth applications.
• The research survey at [7] focused on the development of pervasive healthcare from its origination for activity recognition using wearable sensors to the future of sens-ing implant deployment and data processsens-ing. The possibilities of the combination between pervasive health monitoring through data linkages and other health in-formatics systems including the mining of health records, clinical trial databases, multiomics data integration, and social media was also discussed in this survey. • Regarding the smart health monitoring systems, over fifty different systems were
selected, categorized, classified and compared in [8] to make an extensive review of smart health monitoring systems and an overview of their design and modeling. In addition, a critical analysis of the efficiency, clinical acceptability, strategies and recommendations on improving current health monitoring systems were presented. • For the algorithms, the author of [9] reviewed models based on deep learning ap-proach including Recurrent Neural Network, Deep Boltzmann Machine, Deep Belief Network, Convolutional Neural Network, Deep Autoencoder and Deep Neural Net-work in the broad context of health informatics applications. Ranging from genomic analysis to biomedical image analysis, the research was focused exclusively on deep learning techniques tailored to Electronic Health Record data.
1.3
Research Objective
There is a need for a comprehensive literature review which states the extensive overview of the field, advances in IoT-based health care technologies in the aspect of system archi-tecture. Objectives of this research are clearly given by:
• Investigating and summarizing the existing knowledge and state-of-the-art technologies in the field. There are a lot of fundamental definitions and terms in healthcare research terms. Besides, multiple researchers have been studied for decays. They proposed a lot of problems and their own solutions with limitations. In addition, advanced techniques have developed through time and challenged new researchers. There may be a case that a problem was solved by multiple techniques; however, none of proposed manners gave a perfect solution. Researchers can waste years to study and understand identified problems and proposed solutions while they have to spend time on finding a new solution with updated technologies. • Provide an exhaustive understanding of the successful case studies on the
IoT in the healthcare context which is expected to be useful for further research. There are several of of the smart healthcare systems and applications which have been proposed with a lot of advantages of humans. However, each system and application have their own strength and weakness. It is necessarily to classify them into separated categories based on their purposes, applied manners and used techniques. It will help researchers to have deeper interpretation about systems in the same category to find a general solution dealing subproblems of each systems. • Identify the current problems of smart healthcare systems based on the
view of general system architecture. Besides, we will implement a smart health care system which applies methodologies to solve the current issues of the field. The implemented system is supposed to be useful for the smart healthcare research in the future.
Therefore, through the survey, researchers can get enough understanding, save their time in searching articles and reducing repetitious work for supporting the task of design-ing and developdesign-ing the smart healthcare system.
In order to accomplish our objectives, we have conducted this literature review. In this research, we focus on the following aspects of the healthcare system.
• First of all, we identify all necessary data which is essential collected for providing health care services.
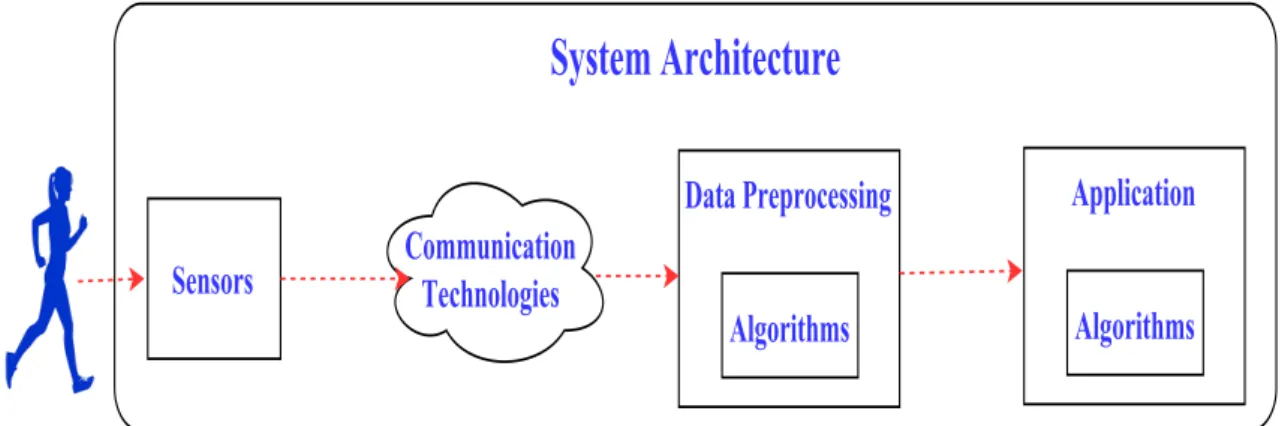
Figure 1.2: The process of literature review based on the general smart healthcare system architecture.
• Finally, we will study the system architecture design of smart health technologies. Through these discussions, further areas that would benefit from the introduction of IoT technologies will be identified. Moreover, based on this study, we will implement a smart healthcare system as a demo solution for the current problems of the field. Fig 1.2 visualizes the process of literature review following the smart health care system architecture.
1.4
Research Outline
This report consists of eight chapters: Introduction, Data Collected by Sensors, Sensor and Communication Technology, Data Preprocessing, Health Care Application, Open Challenges and Issuses, Implementation, Discussion and Concluding Remarks. Besides, the Appendix which is a further detailed for the finding will be attached at the end of this report research. The remained sections of this research are organized as follows:
• The necessary data in smart health including physiological information, the envi-ronmental aspects, indoor location information are introduced in Section II.
• Sensors and their communication technologies in the smart health care field are represented in Section III.
• Data preprocessing and health care applications along with their algorithms and methods are reviewed in Section IV and V.
• Later, opportunities for research and development will be identified in Section VI. • Chapter VII will be the implementation of smart healthcare system.
Chapter 2
Sensor Data
2.1
Introduction
Physiological information, the environmental aspects, indoor location information are certainly collected in order to ensure the quality of life, safety and well-being. Physiolog-ical information can reflex the health of humans while environmental aspects and indoor location information helps to identify the current position of an individual and warn the individual if the current state is dangerous because of unexpected objects or situations. Regarding details of mentioned information and aspects, following sections are presented.
2.2
Physiological information
2.2.1
Vital signs
Vital signs which primary are temperature, pulse rate (heart rate), respiration rate (breathing rate) and blood pressure, are the most important physiological signs that indicate the status of the body. They are often the fundamental information requested for during emergencies and required in any healthcare system. Vital signs can be used to measure the body’s most basic functions for effectively identifying or monitoring health problems. Either rapid changes or gradual differences in vital signs have been proven to be a significant predictor of life-threatening health events. The normal ranges for a person’s vital signs vary with patient demographics, age, gender, weight, overall physical conditions, and with environment variations, diet, uid status, stresses, and time of day [10]. Table 2.1 depicts the 4 basic vital signs.
Although individual body temperature fuctuation depends upon age, gender, exertion, time of day, food and fluid consumption, and the stage of the menstrual cycle of women,
The abnormal temperature can be classified into two types: fever (abnormally high body temperature) or hypothermia (abnormally low temperature).
• Fever is the stage that body temperature rises above the normal temperature of
98.6◦F(37◦C) with one degree or more. The body temperatures higher than 104◦F
(40◦C) becomes a medical emergency requiring urgent treatment to avoid potentially
disability or death.
• In contrast, hypothermia is a seriously low body temperature indicated when the
body loses heat faster than it can produce. The body temperature drops below 95◦F
(35◦C) when hypothermia occurs.
Pulse rate or heart rate is the speed of the heartbeat determined by the number of times a minute that human’s heart contracts or beats. Although the typical fluctuation of pulse rate are provoked by physical exercise, smoking, caffeine, illness, injury, mood changes and ingestion of drugs, the accepted normal resting adult human pulse rate are from 60 to 100 beats per minute (bpm). An irregular heartbeat or an arrhythmia is a symptom of basic fitness level, cardiovascular health such as the risk of a heart attack, hypertension and atherosclerosis. Based on not only origination (atria or ventricles) but also the speed of heart rate, arrhythmias can be classified into two typical types: tachycardia (fast heartbeat) and bradycardia (low heartbeat). Both tachycardia and bradycardia are not abnormal and often self recovery unless they become symptomatic arrhythmias.
• Tachycardia: a resting heart rate greater than 100 bpm (beats a minute). • Bradycardia: a resting heart rate less than 60 bpm (beats a minute).
Respiration rate (breathing rate) is the rate at which breathing occurs which is measured by the number of breaths a person takes per minute. The regular range of respiration rate for a healthy mature at rest is accepted as 12 to 18 breaths per minute. However, some research denote this range as high as 24 breaths per minute for matures. There is a wide range of variability in children commonly higher than matures from 17 to 40 breaths per minute [11]. Due to fever, illness, or other medical conditions, the normal respiration rates may change. There are also two types of abnormal respiration rate: tachypnea (rapid, abnormal breathing) and hypopnea (abnormally low respiratory rate). This abnormal respiration rate is an indicator of increasing nervousnessstar, exercise, infection, or stress and can be reversible by either calming measures or removing the infection.
Blood pressure is the force of circulating blood against the walls of blood vessels in-cluding both venous and arterial. When conducting blood pressure measurement, two numbers are captured: a systolic pressure and a diastolic pressure. A systolic pressure, the higher number, indicates the pressure strength (mm/Hg) inside the artery when the heart contracts and pumps blood through the body. A diastolic pressure, the lower num-ber, indicates to the pressure inside the artery when the heart is at rest and is filling with blood. Blood pressure is affected by cardiac output, total peripheral resistance and blood vessel stiffness and varies depending on situation, stress, exercise, and related medical
problems. 140 mm/Hg or higher systolic pressure or 90 mm/Hg and higher diastolic pres-sure is defined as high blood prespres-sure. The normal range of blood prespres-sure for healthy adult are 119 mm/Hg or less systolic and 79 mm/Hg or less diastolic.
Table 2.1: The basic vital signs.
Vital Sign Description Normal Range
Temperature Depending on gender, recent activity, food
and fluid consumption, time of day, and, in women, the stage of the menstrual cycle.
97.8◦F to 99.1◦F (36.5◦C to 37.3◦C) with an average of 98.6◦F (37◦C). Pulse (Heart) Rate
A measurement of the heart rate, or the number of times the heart beats per minute. Tachycardia is the heart rate that higher than 100 bpm while the heart rate that lower than 60 bpm is called Bradycar-dia. 60 to 100 beats per minute (bpm). Respiration Rate
The number of breaths a person takes per minute.
12 to 18 breaths per minute for an adult person, children’s ranges as high as 24 breaths per minute. Blood Pres-sure
The pressure of circulating blood on the walls of blood vessels. BP is composed of 3 pressures: systolic pressure, diastolic pres-sure.
119 mm/Hg or less systolic and
79 mm/Hg or
less diastolic.
2.2.2
The Extra Medical Signs
Several other parameters such as muscle activity level, blood glucose level, gaseous
carbon dioxide levels (CO2), electrical activity in brain, etc. are all very important to
track down the healthcare status [12], [13], [14], [15].
Blood glucose or blood sugar [16] is the amount of glucose circulating in the blood of hu-mans and other animals. Although blood glucose level fluctuates throughout the day, the
• Hyperglycemia or high blood sugar is a condition in which blood sugar increases to higher than normal levels due to an excessive amount of glucose circulates in
the blood plasma. The short-term hyperglycemia can make the body suppress
appetite while the long-term high blood sugar is the reason of many the medical problems including heart disease, eye, kidney, and nerve damage. Moreover, high blood sugar is an indicator of prediabetes and diabetes (both type 1 diabetes and type 2 diabetes). Therefore, blood glucose monitoring is an essential part of diabetes control. Patients with type 2 diabetes must test their blood sugar concentrations at least once a day. Those who need to take insulin that consists of all type 1 diabetes and some with type 2 ones, have to test their blood several times a day.
• Hypoglycemia or low blood sugar is a condition in which blood sugar drops to lower than normal levels. Hypoglycemia tends to occur on quickly and can vary from person to person with a feeling of hunger, sweating, shakiness, and weakness. Hypoglycemia is a potentially fatal condition which causes many health problems including uncoordinated, trouble talking, confusion, unconsciousness, convulsions, or even death. Glucose plays an important part of metabolism and nutrition, which is the suitable functioning of the body’s organs. Consequently, hypoglycemia is more dangerous than hyperglycemia.
The muscle activity level at rest and during contraction is another important infor-mation which can be analyzed to identify medical abnormalities, neuromuscular diseases, assessing low-back pain or activation level. The muscle activity level can aslo be used as a control signal for prosthetic devices such as prosthetic hands, arms, and lower limbs.
Gaseous carbon dioxide levels [17] is the amount of carbon dioxide (CO2) in the blood
serum. There are two major forms of CO2 in the human body with more than 90% in
the form of bicarbonate (HCO3) and nearly 10% in the form of carbon dioxide (P CO2).
The normal range for CO2 in the human blood is around 23 to 29 mEq/L (milliequivalent
units per liter of blood). The imbalance between the oxygen and carbon dioxide in human blood is the indications of a kidney, respiratory, or metabolic disorder. Shortness of breath, breathing difficulties, nausea or vomiting are the common signs of an imbalance of oxygen and carbon dioxide in blood. The abnormality blood carbon dioxide levels condition includes low bicarbonate and high bicarbonate combined with high blood pH and low blood pH.
• Metabolic acidosis is a condition of low bicarbonate and low blood pH (less than 7.35) because the body produces excessive quantities of acid or when the kidneys are not able to remove enough acid from the body. Kidney failure, severe diarrhea, lactic acidosis, seizures, cancer, prolonged lack of oxygen from severe anemia, heart, failure, or shock, diabetic ketoacidosis are the common reasons of metabolic acidosis, which can lead to serious consequences including coma and death.
• Respiratory alkalosis is a condition of low bicarbonate and high blood pH (more than 7.45) because the levels of carbon dioxide and oxygen in the blood are not balanced. Hyperventilation, fever, pain and anxiety are the common reasons of respiratory alkalosis
• Respiratory acidosis is a condition of abnormally increasing carbon dioxide levels in the blood, the blood pH is low (less than 7.35). It occurs when the lungs can not remove enough of the carbon dioxide produced by the body. There are various reasons for respiratory acidosis ranging from pneumonia, chronic obstructive pul-monary disease, asthma, pulpul-monary fibrosis, exposure to toxic chemicals, drugs that suppress breathing, tuberculosis, lung cancer, pulmonary hypertension and severe obesity.
• Metabolic alkalosis is a condition of both bicarbonate and pH level in blood are higher than normal. The pH figure is more than 7.45. The common reasons of metabolic alkalosis are chronic vomiting, low potassium levels, hypoventilation, and
decreased CO2 elimination.
Electrical activity in brain is caused by the communication activity of neurons across short and long ranges in the human brain. The abnormal change in electrical activity can lead to seizures, especially epilepsy. Moreover, the information is applied to identify mental health problems and physical problems such as problems in the brain, spinal cord, or nervous system of the patients.
Electrodermal Activity (EDA) or Galvanic Skin Response (GSR) refers to electrical properties of the human body captured at the surface of the skin that arise when the skin receives innervating signals from the brain. When individuals encounters nervous, emotional activation, increase cognitive workload or physical exertion, the brain sends signals to the skin to increase sweat gland activity. The result of these actions is the increasing of skin conductance. Consequently, skin conductance can be applied to measure emotional and sympathetic responses such as relaxation or distress biofeedback, emotional mapping, the polygraph test of an individual.
2.3
The Environmental Aspects and Indoor Location
Information
Since people spend about 80-90% of their time indoor, the research at [18] indicated that indoor environmental quality can impact on the comfort, health and productivity of the individual who lives inside the house. Abnormal change of indoor environment may
humidity can not only cause heat diseases but also result in slow to react or inappropriate judgement that indirectly cause harm with respect to nursing or taking care of young children. These indoor stressors can exert their effects additively or through complex interactions (synergistic or antagonistic) [20]. These relationships can have both short-term and long-short-term impact on the wellbeing of the occupants. The recent researches have specified that there is a link between indoor building conditions and mental health; cardiovascular diseases, asthma-related issues and obesity which are not easily detectable in the short term, however can be considerable problems in the long term [21]. Therefore, along with human’s health-related information, the environmental aspects as gas, smoke, light, temperature, sound, oxygen and humidity also have their roles to determine the environmental health and safety of an indoor space .
Indoor location is another neccesary information. In recent years, there is an increasing demand for indoor localisation, especially in healthcare area.
The indoor location information is useful for positioning people within buildings such as hospitals and nursing homes to track patients, either for their safety or their care. For specific mental disease like Alzheimer disease, there is the problem of lossing or forgetting patients around the hospital. For emergency response such as when a patient has suddenly fallen down or has not moved for a period of time, he or she may require a prompt assis-tance from doctors or other healthcare providers to avoid additional injuries, the location information can help to determine where in the facility a patient is located. Furthermore, a health facility also need location information for tracking expensive equipment, pre-venting theft, and precise locating for robotic assistants during surgeries [23].Therefore, observation of the precise position of a person inside a medical facility at any time is a significant problem inside indoor localization research area.
For senior citizens living alone, indoor location information can be used to monitor their daily activities and ensure the safety. Besides, daily movement patterns are effective for detection of early indications of new or deteriorating health issues [24].
Chapter 3
Supporting Infrastructure and
Technology
3.1
Introduction
Recent advances in sensor technology, microelectronics, and telecommunication, both physiological, environmental and location information can be easy collected and mon-itored. The environmental sensors can be used to capture environmental parameters. Accelerometer and compass sensors are applied in location monitoring application while the biomedical sensors such as Electrocardiogram (ECG), Electrodermal Activity (EDA) and Photoplethysmography (PPG) sensors can be used to monitor the health figure of the human [25]. The collected data can be analyzed and sent to the server by applying communication technologies. There is a wide range of communication technologies in smart health field which is well known such as RFID, NFC, WiFi, 6LowPAN, Bluetooth, ZigBee and 2G/3G/4G cellular.
3.2
Sensor Technology
3.2.1
The Advance in Sensor Technology
Sensors which is the bridge between the physical world and electronic system, play a critical role in IoT healthcare fields. The analog signals corresponding to body’s physio-logical actions, human activities, location and environmental aspect are collected and then forwarded to the radio receivers. Commonly, there are three main building blocks in a wireless sensing node including sensors, processing, and wireless electronics. These blocks are embedded on printed circuit boards (PCBs) made of the glass-refined epoxy laminate
than the imagine of a human.
Traditionally, textitinvasive sensors [27], in which the probe must enter the human body through the natural cavities (nostrils, throat, ears, skin), are widely used in healthcare applications. Due to the enormous potential of continuously monitoring physical and chemical parameters of the patient, optical becomes the key technology of invasive sen-sors. Besides, the possibility of accurate measurements improves thanks to this direct connection. Moreover, invasive sensors become small enough to fit in the tissue with min-imal damage, either as a part of a catheter or some other probe. However, the limitation of invasive sensors is in where and when they can be applied and the comfort of a human. The miniaturization of electronic circuits based on the use of microelectronics has taken an essential part in the advancement of sensor technology [24]. Moreover, the development of signal processing and especially Micro-Electro Mechanical Systems (MEMS), sensory data can be monitored in a non-invasive fashion. MEMS is an advanced technology for sensors design based on miniaturized mechanical and electro-mechanical components (i.e., devices and structures) that are made utilizing the techniques of micro-fabrication. Accordingly, sensors progressively tinier in the scope of 1 to 100 micrometers. As a re-sult, a new chance of ubiquitous healthcare applications has been created with the low medical cost, independence, more comfortable and high quality of healthcare services. MEMS technology has been applied to the design of different kinds of sensors such as
an accelerometer, blood glucose, blood pressure, carbon dioxide (CO2) gas sensor, ECG,
EEG, EMG, gyroscope, pulse oximetry, as well as some sensors typically used in WSNs recently. However, there is an increasing failure of electrical contacts along with skin irritation problems due to the long-term utilization of these types of electrodes. Fortu-nately, this issue can be alleviated by applying the textile structured electrodes of MEMS technology. These textile-structure electrodes or smart textiles contain pressure, chem-ical, humidity and temperature sensors in clothes fabrics which will not cause any skin irritation, adaptable shape to human activity. Therefore, smart textiles are comfortable, flexible, and advisable for long-term monitoring.
3.2.2
Some Common Sensor Devices
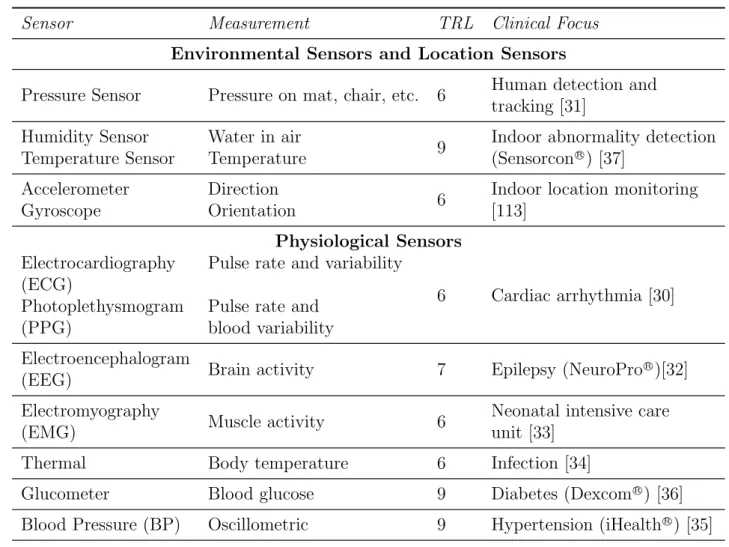
In this section, we introduce some commonly available sensor devices for the smart healthcare system. These sensors can be classified into two main categories: (1) contex-tual sensors and (2) physiological sensors. Contexcontex-tual sensors are the embedded sensors in the environment around patients such as temperature sensors, weather sensors, motion detection sensors, audio, video sensors, location sensors to measure various contextual properties. Physiological sensors capture patient vital signs or physiological statistics such as temperature, pulse rate (heart rate), respiration rate (breathing rate) and blood pressure or Electrocardiography (ECG), blood glucose sensor, etc. These two main cat-egories are summarized in table 3.1 The feature applications in the summarization are based on the technological readiness levels (TRL) with TRL = 4 indicating in-lab com-ponent validation through to TRL = 9 where technology is in its final form, being used under operational conditions.
Table 3.1: Some common sensor devices in healthcare applications.
Sensor Measurement TRL Clinical Focus
Environmental Sensors and Location Sensors
Pressure Sensor Pressure on mat, chair, etc. 6 Human detection and
tracking [31] Humidity Sensor
Temperature Sensor
Water in air
Temperature 9
Indoor abnormality detection
(Sensorcon R) [37]
Accelerometer Gyroscope
Direction
Orientation 6
Indoor location monitoring [113] Physiological Sensors Electrocardiography (ECG) Photoplethysmogram (PPG)
Pulse rate and variability
Pulse rate and blood variability
6 Cardiac arrhythmia [30]
Electroencephalogram
(EEG) Brain activity 7 Epilepsy (NeuroPro
R
)[32]
Electromyography
(EMG) Muscle activity 6
Neonatal intensive care unit [33]
Thermal Body temperature 6 Infection [34]
Glucometer Blood glucose 9 Diabetes (Dexcom R
) [36]
Blood Pressure (BP) Oscillometric 9 Hypertension (iHealth R
) [35]
Humidity and temperature sensor: measuring the temperature of the human body and the humidity of the immediate environment around a person.
Electrocardiography (ECG) sensor: ECG is a process of amplifying and recording the heart’s electrical activity that controls the expansion and contraction of heart chambers. ECG provides graphic information about the part of the heart that triggers each heartbeat, the nerve conduction pathways, the rate and rhythm of the heart. This information is used to help healthcare provider analyze a cardiovascular disease.
Blood glucose sensor: Measuring the amount of glucose circulating in the blood. Com-monly, blood glucose-level measurement requires taking a blood sample by pricking a finger which causes pain or trauma. A blood sample is placed and reacted on a test
Figure 3.1: The standard process for capturing PPG signal and example of PPG signal [29].
Electroencephalography (EEG) sensor: measure the electrical activity of the brain by placing small electrodes on the scalp. EEG measures voltage fluctuations resulting from ionic current within the neurons of the brain. The brain’s electrical activities data sensed by the electrodes is sent to an amplifier for generating a pattern of tracings. Synchronous electrical activities in different brain regions are generally assumed to imply functional relationships between these regions.
Electromyography (EMG) sensor: measure the electrical activity of muscles during contractions or at rest. The more body fat an individual has, the weaker the EMG signal. Since nerves control the muscles in the body by electrical signals, nerve conduction studies are often done together while measuring the electrical activity in muscles. The ideal location for placing the EMG sensor is the longitudinal midline.
Photoplethysmogram (PPG) or scientifically called Blood Volume Pulse (BVP) use a light-based technology to detect the rate of blood flow as controlled by the heart’s pumping activity. PPG makes uses of low-intensity infrared (IR) light. When light travels through biological tissues, it is absorbed by bones, skin pigments and both venous and arterial blood. Since light is more strongly absorbed by blood than the surrounding tissues, the changes in blood flow can be detected by PPG sensors as changes in the intensity of light. The voltage signal from PPG is proportional to the quantity of blood flowing through the blood vessels. Even small changes in blood volume can be detected using this method, though it cannot be used to quantify the amount of blood. Figure 3.1
illustrates the standard process for capturing PPG signal proposed based on the research of Bonhomme [29] and example of PPG signal. The derived unit of measurement for PPG is nanoW att(nW ). From PPG data, researcher can apply several algorithms to extract the interbeat interval (IBI) or well-known as heart beat interval (HBI) data, which is the time interval between individual beats of human. The derived unit of measurement for IBI is second(s). Heart rate (HR) can be simply calculated by 60/IBI(bpm−beatperminute). Electrodermal Activity (EDA): There are various of methodologies to measure EDA for example admittance, conductance, impedance, resistance and skin potential. Measuring electrical conductance across the skin is one of the popular methods to capture EDA figure. By passing a minuscule amount of current between two electrodes in contact with the skin, the information can be achieved. MicroSiemens (µS) is the derived unit of measurement for conductance. The example of EDA signal is shown in Figure 3.2
Thanks to technological advances as mentioned in Section 3.2.1, invasive and non-invasive sensors can be placed in any part of the body to collect not only physiological data but also contextual data. For example, sensors placed on the brain can capture glucose level, ECC, PPG signal while wearable sensors on the wrist can measure skin conductance level (EDA), the activity level of an individual. Figure 3.3 depicts a graphical demonstration of physiological sensor placement on the human body.
Figure 3.2: The example of ED A signal.
Figure 3.3: Graphical demon str ation of ph ysiological sensor placemen t.
3.3
Communication Technology
The sensors and equipment are connected through a communication network to share and exchange data. There are three purposes for the transmission of measured data in the overall context of smart healthcare needs. Firstly, for retrieving sensory data from human
body and environment. Secondly, for transmitting the collected physiological signals
from that biosensors to the system’s central node. Finally, for sending the aggregated measurements from the local system to remote medical stations.
The communication between sensors and system’s central node can be handled either by wires or by multiple wireless networks. In the past, the utilizing of wires not only severely hindered the user’s mobility and comfort but also increased the risk of system failure [38]. Many advanced technologies have been applied to overcome this problem. For example, conductive yarns have been used to transfer the collected data from sensors integrated into some flexible smart-textile clothing [39].
Currently, autonomous sensor nodes can construct a body area networks (BANs) or body sensor network (BSN).
3.3.1
Body Area Networks Architecture
The development of BANs has been empowered by the extensive use of wireless net-works and the constant miniaturization of electrical devices. There are several benefits introduced by using wireless BANs in healthcare application, mainly, flexibility, communi-cation efficiency and cost-effective. Positively, non-invasive sensors can be used to flexibly monitor and transmit physiological data to the central node of BAN, then forward to nearby devices based on the application needs. Moreover, the signals that body sensors provide can be efficiently processed to obtain reliable and accurate physiological estima-tions. Besides, the ultra-low power consumption of such sensors makes their batteries long lasting. Furthermore, more sensors, especially for healthcare purposes, will be mass-produced at a relatively low-cost thanks to the increasing demand of body sensors in the consumer electronics market. BANs may interface with other wireless technologies, such as WSNs, radio frequency identification (RFID) technology, Bluetooth, Zigbee, Bluetooth Low Energy, video surveillance systems, wireless personal area network (WPAN), wireless local area networks (WLAN), internet, and cellular networks.
Figure 3.4 depicts the research by M. Chen [40] which clearly separated the BAN communications system into three-tier architecture. The three different layers are tier 1 or intra-BSN communication, tier 2 or inter-BSN communication, and tier 3 or beyond-BSN communication. These three architectural layers cover various aspects of communication, from low-level to high-level design problems, assist the progress of a component-based, efficient BAN system for multiple healthcare service provisionings.
The terminology “intra-BAN communications” known as tier-1 refers to the wireless communication that directly connects to a human body with the coverage of about 2 meters. The construction of intra-BAN is essential because of this direct relationship with body sensors. The paradigms of the layer can be further subcategorized as: (1) the communication between body sensors, which are strategically attached or implanted on
Figure 3.4: A three-tier architecture based on a BAN communication system [40]
the patient’s body, as well as deployed within the human’s clothing; (2) the communication between the body sensors and the portable Personal Server (PS).
The “inter-BSN communication” known as tier-2 refers to the communication between the PS and one or multiple access points (APs). These APs can be deployed as a part of the system’s component or strategically placed in dynamic environment to handle emergencies. According to the terminology of “inter-BSN”, the tier-2 has capability to interconnect BSNs with various networks ranging from internet to cellular networks. The paradigms of inter-BAN communications are devided into two categories, infrastructure-based architecture, and ad hoc-infrastructure-based architecture. The benefit of infrastructure-infrastructure-based architecture is the ability to provide larger bandwidth with concentrated control and flex-ibility while the ad hoc-based architecture can be deployed faster in a dynamic situation, for example in medical emergency response, or at a disaster area [41]
Tier-3 or the “beyond-BSN communication” is designed for streaming collected data to the remote healthcare applications and systems utilizing cellular network or the Internet. A gateway device, such as a personal digital assistant (PDA), is usually employed to create a wireless link between inter-BAN and beyond-BSN communications. Depending on the specificity of services and the requirement of user-specific applications, there is the proper design of beyond-BSN communication.nding on the specific characteristics of services and the requirement of user-specific applications; there is the appropriate design of beyond-BSN communication.
Figure 3.5: Complete MICS communication network. [48]
3.3.2
Wireless Communication Technology
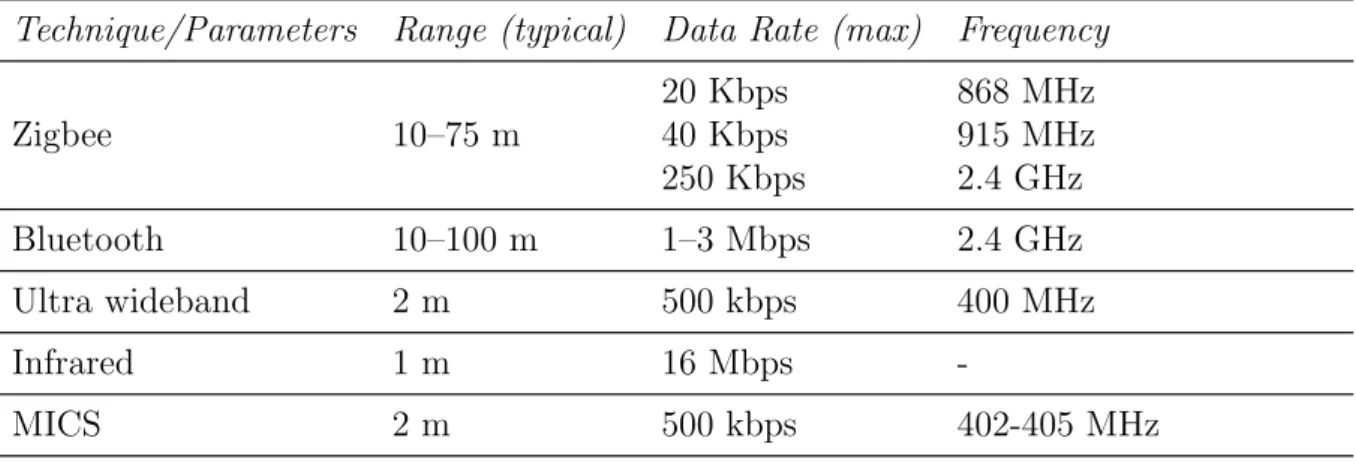
IEEE 802.15.1 (Bluetooth), 802.15.4 (the basis for Zigbee) and 802.15 (standard for wireless personal area network - WPAN), presented in table 3.2, are the most commonly employed wireless communication standards in BANs.
The Zigbee standard [42] is refers to a low-cost, low data-rate, low complexity however long battery life solutions along with a set of globally accepted specifications for wireless sensor networks. The radio design utilized by Zigbee has been strategically optimized in order to archive low cost in large scale production. This standard specifies operation in 16 channels in the 2.4 GHz industrial, scientific, and medical (ISM) band (250 kb/s, OQPSK modulation), in 10 channels in the 915 MHz band (40 kbps, BPSK modulation) and in one channel in the 868 MHz band (20 kb/s, BPSK modulation). Zigbee supports various network architectures including star, tree cluster, and mesh topologies with the maximum transmission range is about 75 meters. There is an extensive potential of ZigBee standards in healthcare area. These standards have been applied in a wide range of applications including healthy and independent living support for the disabled or elderly, foster safe, wellness and fitness [43].
Bluetooth [44] is a low power and linexpensive wireless technology standard for short-range radio frequency connectivity not only between fixed but also mobile devices. This
Table 3.2: Wireless communication protocols in BANs.
Technique/Parameters Range (typical) Data Rate (max) Frequency
Zigbee 10–75 m 20 Kbps 40 Kbps 250 Kbps 868 MHz 915 MHz 2.4 GHz Bluetooth 10–100 m 1–3 Mbps 2.4 GHz Ultra wideband 2 m 500 kbps 400 MHz Infrared 1 m 16 Mbps -MICS 2 m 500 kbps 402-405 MHz
standard operates in the unlicensed 2.4 GHz spectrum. After breaking transmitted data into packets, bluetooth transmits each of these packet on one of 79 designated Bluetooth channels with the bandwidth of each channel is 1 MHz. Consequently, Bluetooth is able to transfer moderate amounts of data over a versatile, robust and secure wireless connection. Although the common transmission distance is around 10 meters, the maximum figure can reach to 100 meters. Piconet is the basic configuration of Bluetooth. It is an ad hoc network with one master interconnect with up to seven slaves, whereby the master provides the synchronization reference (common clock and frequency hopping pattern).
Introduced under the Bluetooth 4.0 specification by Bluetooth Special Interest Group (SIG) since 2004, Bluetooth Low Energy (BLE) or also called Bluetooth Smart is a wireless personal area network technology. BLE has shown great promise in the development of applications not only in the health monitoring and fitness but also in smart home industries. In spite of the similarity in some regards, BLE is not backward compatible with Classic Bluetooth protocols as a consequence of applying a different controller, for example, physical and link layer. The key difference between BLE and previous Bluetooth protocols is low power consumption. Thanks to the applying of BLE, with just a small battery can let applications run on for years. It is ideal choice for healthcare applications, which only need to exchange small amounts of data periodically. In 2018, SIG believe that BLE will be supported by 90 percent of Bluetooth-enabled smartphones in the market [45]. The comparison of classic Bluetooth and BLE is shown in Table 3.3.
Along with Zigbee and Bluetooth, the medical implant communication service (MICS) and ultra wideband (UWB) are emerging technologies applied in short-range intra-BAN communication which have many potential applications to be researched.
Table 3.3: Comparison of Classic Bluetooth and Bluetooth Low Energy (BLE) [46]
Specifications Classic Bluetooth Bluetooth Low Energy
Range 100 m Greater than 100 m
Data rate 1–3 Mbps 125 kbitps – 1 Mbps – 2 Mbps
Application throughput 0.7–2.1 Mbps 0.27 Mbps
Active slaves 7 Not defined
Frequency 2.4 GHz 2.4 GHz
Security 56/128-bit 128-bit AES with
Counter Mode CBC-MAC
Robustness Adaptive fast frequency
hopping, FEC, fast ACK
24-bit CRC, 32-bit Message Integrity Check
Latency 100 ms 6 ms
Time Lag 100 ms 3 ms
Voice capable Yes No
Network topology Star Star
Power consumption 1 W 0.01 - 0.50 W
Peak current consumption less than 30mA less than 15mA
wide for transmitting high data rate to support of diagnostic or therapeutic functions associated with medical devices [47]. The universal radio frequency band of 402–405 MHz with 300 kHz channels is proposed in MICS. Effective isotropic rediated power (EIRP) is limited to 25 µW and targets mostly devices such as cardiac pacemakers and defibrilla-tors, without causing interference to other users of the electromagnetic radio spectrum. Figure 3.5 present a high-level summary of the MICS band. Despite its beneficial ele-ment, because of the lack of commercially available solutions, MICS has not been utilized generally by scientists.
Ultra-wideband (UWB) radio is a technology that can use a very low energy level for short-range, high-bandwidth communications over a large portion of the radio spectrum [49]. UWB operates in the frequency range from 3.1GHz to 10.6GHz in America. However, the frequencies have been devided into two parts from 3.4 GHz to 4.8 GHz and 6 GHz to 8.5 GHz in Europe.
Chapter 4
Data Preprocessing
4.1
Introduction
In the healthcare field, especially in healthcare monitoring system, the reliability of input data is of extremely importance. Accurate health care decisions can only be made with accurate input data. However, sensor data is possible to contain noise and outliers due to the low quality or errors of the sensors, occurrence of noise, motion artifacts in any sensor networks. Consequently, these might lead to false readings, false alarms to be delivered to patients or healthcare providers. Therefore, a preprocessing of the raw sensor data is necessary.
Preprocessing in the healthcare domain involves filter imperfect data to remove arti-facts or high-frequency noise; fill in missing values and imbalanced data preprocessing [50]. Many researchers have proposed various cleaning algorithms in order to increase the reliability of sensor data [51] - [52]. As an illustration, for filtering artifacts, designed modules have usually applied threshold-based methods to filter sensor data [53] or used statistical tools to interpolate the missing data points [54]. To remove frequency noise, the other methods in the frequency domain such as power spectral density (PSD) fast Fourier transforms (FFT), and low-pass/high-pass filtering tools are standard to remove the fluctuations in sensor signals [55]. For the missing data imputation, there are sev-eral methods such as Mean, K-nearest neighbors (KNN), fuzzy K-means (FKM), singular value decomposition (SVD), Bayesian principal component analysis (bPCA) and multiple imputations by chained equations (MICE) [56].
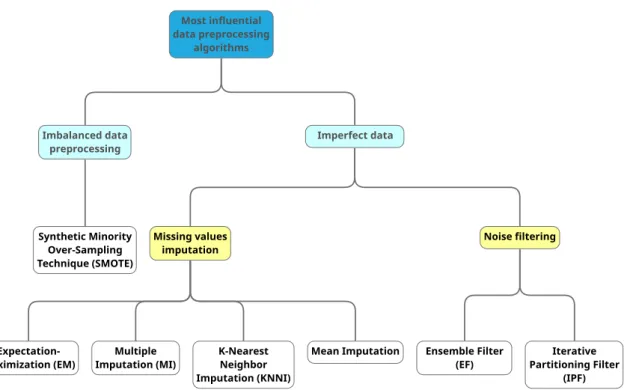
Among abundant technologies for data preprocessing, several algorithms emerge in popularity. In this section, we tackle the most important data preprocessing algorithms in health care system, which is presented in figure 4.1, based on the criteria proposed in [57]. They are:
Most influential data preprocessing algorithms Imperfect data Missing values imputation
Expectation-Maximization (EM) Imputation (MI)Multiple K-NearestNeighbor Imputation (KNNI)
Mean Imputation
Noise filtering
Ensemble Filter
(EF) Partitioning FilterIterative (IPF) Imbalanced data preprocessing Synthetic Minority Over-Sampling Technique (SMOTE)
Figure 4.1: The classification of most influential data preprocessing algorithms in health-care.
• Popularity: the associated publication is considered as a highly cited one in well-known databases: Web of Knowledge, Google Scholar, Scopus, etc.
• Standardization: the algorithm has been the baseline of inspiration of several mod-ern and hybrid extensions.
• Smart: it must somehow incorporate a smart procedure in its definition, for the sake of not including direct and basic mechanisms as algorithms.
• Variability: there have been a minimum number of representatives belonging to each data preprocessing family.
Figure 4.2 illustrates the evolution of academic publications concerning the data prepro-cessing algorithms. Publication statistics are acquired from Google Scholar; the search query is defined as the subfield name of algorithms and at least one of medical or health appearing, e.g., “kNN Imputation” AND medical OR health.
1992 1993 1994 1995 1996 1997 1998 1999 2000 2001 2002 2003 2004 2005 2006 2007 2008 2009 2010 2011 2012 2013 2014 2015 2016 Sy nth eti c Mi no rity Ov er -S am pl in g T ech ni qu e Ite ra tiv e-Par titi on in g F ilt er En se m bl e F ilt er kN N Im pu ta tio n Mu lti pl e Im pu ta tio n Exp ect ati on Ma xi m iza tio n 4.2: Ev olution of academic publications concerning the data prepro cessing framew orks.
4.2
Imperfect data
In health care or health informatics, the data is rarely clean or complete, imperfect data are prevalent due to missing or noise. Therefore, data analysis and modeling techniques in healthcare applications should be able to remove the noisy data and fill in the missing values. In this section, the widely used preprocessing techniques for imputing the missing values and for filtering the noise will be identified.
4.2.1
Missing Data Imputation
As a definition, a missing value is an attribute that has not been sampled in the data set, or that was never recorded, for any reason. The accuracy of applications in health care system depends on a data set that is supposedly complete. To support the health care tasks, the application expects to process sequences of complete instances sampled collected from sensors. However, due to various reasons such as equipment errors, incorrect measurements, limitations in the data acquisition process or faulty sampling, missing data are a common incidents. The presence of missing value makes the conduct of data analysis complicated, and it usually poses severe troubles for scientists. Improper handling of the missing value in the analysis can have a critical consequence of the decision that can be deduced from the data. We can point out three types of issue are usually associated with missing value: (1) loss of efficiency in the extraction process; (2) complications in handling and analyzing the data; and (3) bias due to incomplete data [58]. Therefore, cleaning and preparing the data is usually a required preprocessing stage in order to be helpful to and adequately clear for the knowledge extraction process.
To diminish the negative influence of missing data, there are usually three different approaches:
• The simplest, very usual however rarely practical method is to delete the samples that contain them. Only when a relatively low number of samples with missing values in data and analysis carried out over the remaining complete examples will not lead to serious bias during the inference, this simplest method can be practical. • Traditional approaches to missing data come from statistics which are based on the applying of maximum likelihood procedures, where the parameters of a model for the complete data are estimated, while the probability functions are sampled to impute the missing value.
• The final goal of the missing value imputation is to fill in the missing value with estimated ones. In most cases, a data set’s attributes are not independent of each other. Therefore, missing values can be determined through the identification of relationships among values.
Among a broad family of existing missing value imputation methods, we focus our at-tention on maximum likelihood and imputation methods which are widely used by re-searchers.
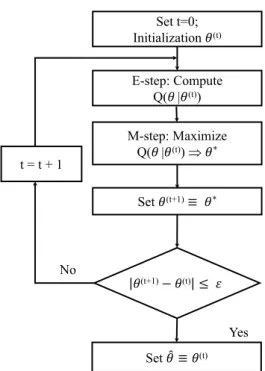
t = t + 1 Yes No Set t=0; Initialization !(t) E-step: Compute Q(! |!(t)) M-step: Maximize Q(! |!(t)) Þ !* Set !(t+1)≡ !* Set !$ ≡ !(t) !(t+1)− !(t) ≤ '
Figure 4.3: Flow chart for the expectation maximization algorithm
Regularized Expectation-Maximization (EM) [59] is a meta-algorithm applied to op-timize the maximum likelihood of data. The given estimates of the mean and of the covariance matrix are revised in three steps in an iteration of the EM algorithm.
• First, the regression parameters of the variables with MVs among the variables with the available attribute are computed from the estimates of the mean and of the covariance matrix for each record with MVs.
• Second, the MVs in a record are filled in with their conditional expectation values given the available values and the estimates of the mean and the covariance matrix, the conditional expectation values being the product of the available values and the estimated regression coefficients.
• Third, the mean and the covariance matrix are re-estimated, the mean is considered as the sample mean of the completed data set and the covariance matrix as the sum of the sample covariance matrix of the completed data set and an estimate of the
51,359 citations. Therefore, for missing value imputation, EM is one of the first successful solutions which applies maximum likelihood as a guaranteed approach. Thanks to its effective, the repercussion of EM has spread to numerous fields, especially in health care area. In 2016, there was 5500 research applied EM in health care application which was indexed by Google Scholar. Figure 4.3 illustrates the flow chart for the expectation maximization algorithm
Multiple Imputation (MI) [60] is a statistical algorithm for handling incomplete data sets. There are three required steps for the application of this algorithm: imputation, analysis, and pooling, which are depicted in figure 4.4.
• Imputation: in this step, the missing entries of the incomplete data sets are imputed for m times (m=3 in the figure). Imputed values, which can be different for each missing entry, are drawn from a distribution. The result of this step is m completed data sets. Because missing values can appear anywhere in the data set or missing entries could be related its value, the construction of this m completed data sets is the most challenging problem of MI.
• Analysis: in this step, each of the m completed data sets is analyzed. The result of this step is m analyses.
• Pooling: a final result is combined with the m analysis results thanks to the proposed simple rules.
The MI algorithm a prevalent method which was cited and compared in thousands of research articles. Since its proposal by Rubin et al. [60], the impact of this method is notable in the literature with 14813 citations while over 8820 research projects applied MI in health care applications accounted by Google Scholar.
Figure 4.4: Flow chart for the multiple imputation algorithm.
Table 4.1: The number of publication referring to three widely used imputation data algorithms in healthcare applications from 2010 to 2016 by Google Scholar.
2010 2011 2012 2013 2014 2015 2016
Expectation Maximization 4840 5880 6230 7190 7630 8150 8660
Multiple Imputation 3060 3830 4890 5850 6780 7600 8820
kNN Imputation 21 34 38 33 55 69 59
kNNI: kNN Imputation or K-Nearest Neighbor Imputation (KNNI) [61] Despite be-ing extremely simple, the KNNI algorithm is extensively applied thanks to two basic properties:
• Firstly, it can adapt to any problem because only a dissimilarity function among two samples is needed. In this method, the k nearest neighbors are computed, and value from them is imputed.
• Secondly, both numerical and nominal values can handle with kNNI. The most gen-eral value among all neighbors is taken for nominal values, and for numerical values,
![Figure 3.1: The standard process for capturing PPG signal and example of PPG signal [29].](https://thumb-ap.123doks.com/thumbv2/123deta/6114140.1077667/29.892.289.606.153.563/figure-standard-process-capturing-ppg-signal-example-signal.webp)
![Figure 3.4: A three-tier architecture based on a BAN communication system [40]](https://thumb-ap.123doks.com/thumbv2/123deta/6114140.1077667/34.892.114.786.162.458/figure-tier-architecture-based-ban-communication.webp)
![Figure 3.5: Complete MICS communication network. [48]](https://thumb-ap.123doks.com/thumbv2/123deta/6114140.1077667/35.892.110.790.163.619/figure-complete-mics-communication-network.webp)
![Table 3.3: Comparison of Classic Bluetooth and Bluetooth Low Energy (BLE) [46]](https://thumb-ap.123doks.com/thumbv2/123deta/6114140.1077667/37.892.108.790.199.680/table-comparison-classic-bluetooth-bluetooth-low-energy-ble.webp)