The safety and efficacy of acute graft-versus-host disease prophylaxis with a higher target blood concentration of cyclosporine around 500 ng/mL.
Tomohito Machishima, Shinichi Kako, Hidenori Wada, Ryoko Yamasaki, Yuko Ishihara, Koji Kawamura, Kana Sakamoto, Miki Sato, Masahiro Ashizawa, Kiriko Terasako, Shun-ichi Kimura , Misato Kikuchi, Hideki Nakasone, Junya Kanda, Rie Yamazaki, Junji Nishida and Yoshinobu Kanda.
Department of Hematology, Saitama Medical Center, Jichi Medical University, Saitama, Japan.
Correspondence: Professor Yoshinobu Kanda
Division of Hematology, Saitama Medical Center, Jichi Medical University, 1-847, Amanuma, Omiya-ku, Saitama 330-8503, Japan.
TEL: +81-48-647-2111, FAX: +81-48-648-5188 E-mail: [email protected]
Running head: GVHD prophylaxis with CsA at 500 ng/mL
Keywords: cyclosporine, target level, acute GVHD, allogeneic hematopoietic stem cell transplantation
Word count: for abstract and for text
東京慈恵会医科大 学
電子署名者 : 東京慈恵会医科大学
DN : cn=東京慈恵会医科大学, o, ou, [email protected], c=JP日付 : 2017.03.17 16:41:39 +09'00'
Abstract
Cyclosporine (CsA) is the most widely used immunosuppressive agent for the
prevention of acute graft-versus-host disease (GVHD). In a previous report, the
incidence of acute GVHD was decreased by increasing the target blood concentration
of CsA during a continuous infusion from 300 to 500 ng/mL without excessive
toxicities. To confirm these results, we retrospectively analyzed 69 patients who
received a continuous infusion of CsA at a higher target CsA level between 450 and
550 ng/mL (CsA500 group) and compared the clinical outcome with 29 patients who
received CsA with a lower target concentration between 250 and 350 ng/mL (CsA300
group). The target concentration was determined based on the status of background
diseases. Multivariate analysis revealed that the incidence of grade III-IV acute
GVHD was significantly lower in the CsA500 group, although the incidence of grade
II-IV acute GVHD was not different. Toxicities were equivalently observed between
the two groups. Concomitant administration of voriconazole or itraconazole and
higher hematocrit were identified as independent significant factors for higher
concentration/dose ratio of CsA. The average dose of CsA to maintain CsA level
around 500 ng/mL was higher compared to the previous study (3.4 mg/kg vs. 2.7
mg/kg at 3 weeks), probably due to the difference in measuring method of CsA
concentration. We conclude that continuous infusion of CsA with a target level
between 450 and 550 ng/mL is a feasible and effective GVHD prophylaxis, but
caution should be paid for the difference in measuring method.
Introduction
A combination of cyclosporine (CsA) and methotrexate (MTX) is the most
commonly used immunosuppressive regimen in patients who undergo allogeneic stem cell transplantation (SCT). However, the dose, target blood level, and schedule of infusion of CsA vary among protocols and have not been optimized
1. Several previous studies have evaluated the relationship between CsA plasma or blood concentration and the incidence of GVHD or toxicity. Most studies concluded that lower CsA concentrations were closely related to an increased incidence of GVHD
2,3. Previously, Ogawa et al retrospectively compared two methods of CsA infusion; continuous infusion with a target level between 250 and 400 ng/mL and twice-daily infusion with a target trough level between 150 and 300 ng/mL in the early period after allogeneic SCT
4. The incidence of grade II-IV acute GVHD was significantly higher in patients who received continuous infusions of CsA, although these patients showed
significantly lower incidences of renal dysfunction and relapse. The actual daily dose of CsA in the continuous group was decreased from the starting dose of 3.0
mg/kg/day to 1.8 mg/kg/day on average at 4 weeks after SCT, which might have
adversely affected the incidence of acute GVHD. The lower incidence of relapse in
the continuous infusion group resulted in better disease-free survival among patients
with high-risk diseases (43 vs. 16% at 2 years, P=0.039), but not in standard-risk
patients (72 vs. 80%, P=0.45). Hence, they considered that the target CsA level of
250-400 ng/mL in the continuous infusion group was appropriate in high-risk patients,
but too low in standard-risk patients. Therefore, they raised the target level of CsA to
450-550 ng/mL when they continuously infuse CsA in standard-risk patients and
reported that the incidence of acute GVHD was significantly decreased by increasing
the target blood concentration of CsA with acceptable toxicities
5. Based on these
results, we have been administering CsA by continuous infusion with target
concentrations of 500 ng/mL for standard-risk patients and 300 ng/mL for high-risk patients. In this study, we retrospectively analyzed the safety and efficacy of
continuous infusion of CsA with a high target blood concentration at 500 ng/mL to
confirm the previous findings. In addition, we evaluated the effect of factors that may
affect the pharmacokinetics of CsA.
Patients and Methods Patients
We retrospectively analyzed the records of adult patients who underwent allogeneic hematopoietic stem cell transplantation at our institution between June 2007 and September 2011 using GVHD prophylaxis regimen consisting of CsA and MTX.
Those who received conditioning regimens including anti-thymocyte globulin or alemtuzumab and those who received cord blood transplantation were excluded.
Finally, the data for 98 patients were analyzed.
Transplantation procedure
The conditioning regimen was mainly a combination of cyclophosphamide (60 mg/kg for 2 days) with either intravenous busulfan (3.2 mg/kg/day for 4 days) or total body irradiation (TBI; 2 Gy twice daily for 3 days).The reduced-intensity conditioning regimen was a combination of fludarabine and melphalan or busulfan, with or without low-dose TBI. Bone marrow (BM) was exclusively used as stem cell source in
unrelated HSCT, whereas peripheral blood (PB) or bone marrow was chosen in HSCT from a relative.
GVHD prophylaxis consisted of CsA and short term methotrexate (MTX). The dose of MTX was 10 mg/m
2on day 1, and 7 mg/m
2on days 3 and 6 in HLA-matched related HSCT. MTX at 7 mg/m
2was added on day 11 in HLA-mismatched related HSCT and HLA-matched unrelated HSCT. In HLA-mismatched unrelated HSCT, the dose of MTX were increased to 15 mg/m
2on day 1 and 10 mg/m
2on days 3, 6 and 11.
CsA was administered as a 24-hour continuous infusion. The starting cyclosporine
dose was 3 mg/kg/day for all patients. The concentration of CsA was measured three
times a week by fluorescence polarization immunoassay with a specific monoclonal
antibody (the CEDIA Cyclosporine kit, Sekisui Medical, Tokyo, japan), using whole blood samples
6. The dose of CsA was adjusted to maintain the blood CsA
concentration between 450 and 550 ng/mL for standard-risk patients (CsA500 group) or between 250 and 350 ng/mL (CsA300 group) for high-risk patients. The route of CsA administration was converted to oral at a ratio of 1:2 when patients were able to tolerate oral intake after engraftment
7. Acute GVHD was graded as previously described
8.
Standard-risk diseases were defined as acute leukemia in first or second complete remission, chronic myelocytic leukemia in first or second chronic phase,
myeloproliferative disorders without leukemic transformation and myelodysplastic syndrome without leukemic transformation, while others were considered high-risk diseases.
Statistical considerations
Toxicities were evaluated until the route of CsA was changed to oral. Renal
dysfunction was defined as an elevation of serum creatinine level above x1.5 or x2.0 from the baseline value. Liver dysfunction was defined as an elevation of the total bilirubin level above 2 mg/dL.
Dichotomous variables of the patients’ characteristics in the two groups were compared using Fisher’s exact test. Overall survival and disease-free survival were calculated with Kaplan-Meier method. The cumulative incidences of acute GVHD, relapse and non-relapse mortality were calculated considering the effects of
competing events. Univariate and multivariate analyses for the incidence of acute
GVHD was performed with Fine-Gray proportional hazard regression.
We used a concentration/dose (C/D) ratio ([ng/mL]/[mg/kg]) on day 14 after transplantation in CsA500 group to evaluate the effect of various factors on the relationship between CsA concentration and actual dose of CsA. The C/D ratio was calculated by dividing concentration by actual dose per weight at the 2nd week after HSCT. This value corresponds to a reciprocal of clearance (CL), which is a
well-established pharmacokinetic disposition parameter and can be calculated by dividing the rate of infusion by the steady state blood concentration during a
continuous infusion of CsA
9,10. However, in this study, we used C/D ratio instead of CL, since C/D ratio has been used in the previous studies in this field and it is easily understood by physicians. The t-test was used to compare the C/D ratio between groups and multivariate analysis was performed with linear regression. Factors with at least borderline significance (P<0.10) by univariate analyses were subjected to
multivariate analyses. Backward stepwise deletion of the explanatory variables was
performed to leave only significant variables in the final model. All statistical
analyses were performed with EZR (Saitama Medical Center, Jichi Medical
university)
11, which is a graphical user interface for R (The R Foundation for
Statistical Computing, version 2.13.0). More precisely, it is a modified version of R
commander (version 1.6-3) designed to add statistical functions frequently used in
biostatistics.
Results
Patient characteristics
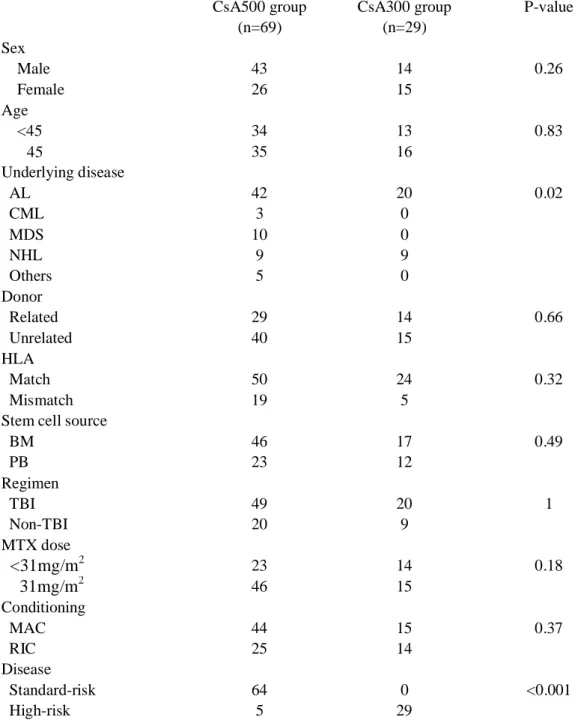
There were 69 and 29 patients in the CsA500 and CsA300 groups, respectively. The characteristics of the patients were equivalent between the two groups, except for the underlying disease (Table 1). Five patients with high-risk diseases were included in the CsA500 group, as there was an HLA-mismatch at a low-resolution level.
Blood concentration and actual daily dose of CsA
The dose adjustment of CsA in the CsA500 group was successful and the mean CsA concentration was 380±105 ng/mL, 482±71 ng/mL, and 512±70 ng/mL at the 1st, 2nd and 3rd week after HSCT, respectively (Figure 1A). The actual dose of CsA was 3.3 ± 0.9 mg/kg, 3.6 ± 1.1 mg/kg, and 3.4 ± 1.2 mg/kg at the 1st, 2nd and 3rd week after HSCT, respectively (Figure 1B). The median duration of intravenous
administration of CsA was 35.5 days (range 14-112 days) after transplantation. The dose adjustment of CsA in the CsA300 group was also successful and the mean CsA concentration was 340±101 ng/mL, 328±48ng/mL, and 347±76 ng/mL at the 1st, 2nd and 3rd week after HSCT, respectively. The actual dose of CsA was 1.9 ± 0.5 mg/kg, 1.9 ± 0.6 mg/kg, and 1.8 ± 0.7 mg/kg at the 1st, 2nd and 3rd week after HSCT, respectively. The median duration of intravenous administration of CsA was 34 days (range 15-103 days) after transplantation.
Toxicity and Incidence of infection
The incidence of renal dysfunction defined as an elevation of the serum creatinine
level above x1.5 and x2.0 from the baseline value was equivalent between the
CsA500 group and the CsA300 group (Table 2, 46% vs. 48%, P=1.00 and 17% vs.
7%, P=0.58, respectively). Liver dysfunction defined as an elevation of the total bilirubin level above 2 mg/dL was also similar (48% vs. 52%, P=0.83). In the CsA500 group, we decreased the target level of CsA to 300 ng/mL, due to renal dysfunction in six patients, and thrombotic microangiopathy in one patient. In 3 of these patients, two with renal dysfunction and one with thrombotic microangiopathy, an
improvement in each toxicity was observed by decreasing the target level of CsA without worsening acute GVHD. No central nerves system toxicities were observed.
The incidences of blood stream infection (BSI), fungal infection other than BSI, and viral infection including cytomegalovirus infection and viral hemorrhagic cystitis were equivalent between the CsA500 group and the CsA300 group (20% vs. 28%, P=0.44, 12% vs. 14%, P=0.75, 4% vs. 7%, P=0.63, respectively).
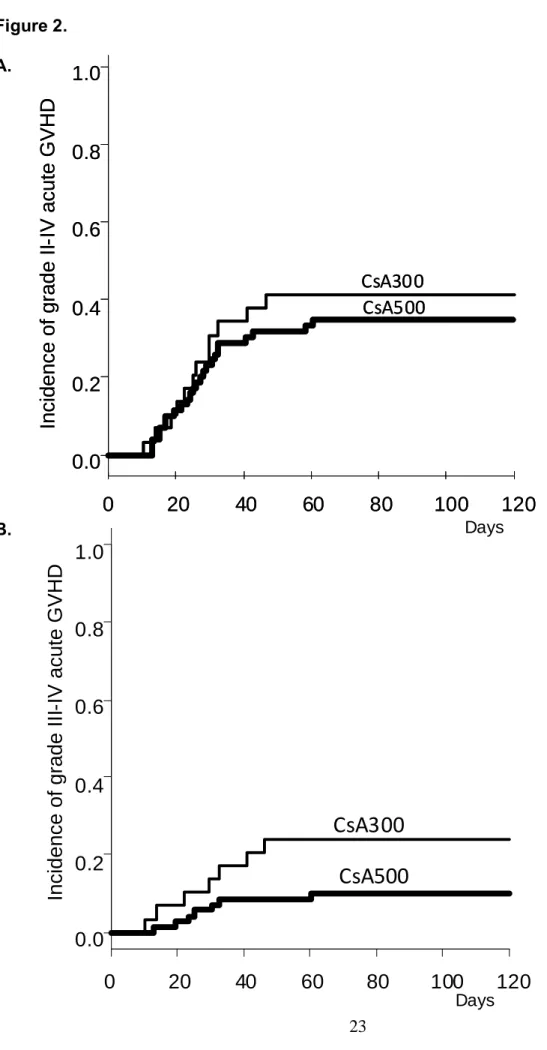
Incidence of acute GVHD
As shown in Figure 2, the incidence of grade II-IV acute GVHD was equivalent between the CsA500 and CsA300 groups (34.8 % vs. 41.4%, P=0.53), but the incidence of grade III-IV acute GVHD tended to be higher in the CsA300 group (24.1% vs.10.1 %, P=0.08). Multivariate analysis revealed that the presence of HLA mismatch was the only independent significant factor for the development of grade II-IV acute GVHD, while two factors were identified as independent risk factors for the development of grade III-IV acute GVHD; the CsA300 group (hazard risk [HR]
3.60, 95% confidence interval [CI] 1.19-10.81, P=0.02) and the presence of HLA
mismatch (HR 4.77, 95% CI 1.60-14.25, P=0.005) (Table 3, 4).
Transplantation outcome of the CsA500 group patients
In the CsA500 group, engraftment was achieved in 68 patients (99%) at a median of 19 days after HSCT. Overall survival and disease-free survival for the CsA500 group were 70.7 and 60.9% at 4 years after transplantation (Figure 3A and B). The
cumulative incidence of non-relapse mortality at 4 years was 13.3% (Figure 3C).
Effect of various factors for the C/D ratio of CsA
We assessed the effects of possible factors on CsA concentrations, including sex, age, liver function, renal function, serum triglyceride level, total cholesterol level, blood glucose level, body mass index, concurrent administration of voriconazole or
itraconazole, and hematocrit. Among these factors, three factors were associated with significantly higher C/D ratio of CsA; age older than 45 years (P=0.04),
administration of voriconazole or itraconazole (P=0.01), and hematocrit higher than 22.6% (P=0.02). By multivariate analysis, administration of voriconazole or
itraconazole and hematocrit were identified as independent significant factors that
associated with higher C/D ratio of CsA (Table5).
Discussion
In this study, we evaluate the safety and efficacy of a continuous infusion of CsA with a target blood concentration around 500 ng/mL. Renal and liver dysfunctions were observed with a similar frequency between the CsA300 and CsA500 groups. The incidence of grades III-IV in the CsA500 group was significantly lower than that in the CsA300 group. The incidence non-relapse mortality was only 13.3% in CsA500 group, suggesting that the administration of CsA at a higher concentration enables safe allogeneic SCT.
The patients in the CsA300 group and those in the CsA500 group, however, had completely different disease status and the CsA300 group may not be an appropriate control group. Therefore, we also compared the clinical outcomes in the CsA500 group in this study with those in the CsA500 group in a study previously reported by Oshima, et al. The incidences of an elevated creatinine doubled from the baseline value were similar, 15% and 17% in the previous and current studies, respectively, whereas the incidence of an elevated bilirubin level was higher in the current study (30% vs. 48%). A possible explanation for this increased incidence of liver toxicity is the increased actual dose of CsA. The actual doses of CsA were 3.3 ± 0.9 mg/kg, 3.6
± 1.1 mg/kg, and 3.4 ± 1.2 mg/kg at the 1st, 2nd and 3rd week after SCT in the current
study, whereas they were 2.9 ± 0.4, 2.8 ± 0.8, and 2.7 ± 0.7 mg/kg in the previous
study. The difference in the actual dose might result from the differences in the
measuring methods of CsA concentration between the two institutions. We used the
CEDIA Cyclosporine kit (Sekisui Medical, Tokyo, japan), whereas TDx (Abott japan,
Tokyo, Japan) was used in the previous study. Nevertheless, the incidence of grade
II-IV acute GVHD was slightly higher in the current study (27% vs. 35%). This
discrepancy could be explained by the different proportions of patients who received
HLA-mismatched SCT (15% vs. 28%). In fact, the incidence of grade II-IV acute GVHD was 26% if we calculated in limited population of patients who underwent HLA-matched SCT.
CsA pharmacokinetics was highly variable
12-14, with factors such as transplant type, patient age and concurrent drug therapy. In this study, the C/D ratio of CsA
significantly increased by three factors; age of patients over 45 years, hematocrit higher than 22.6%, administration of voriconazole or itraconazole. By multivariate analysis, administration of voriconazole or itraconazole and higher hematocrit were identified as independent significant factors that were associated with higher C/D ratio of CsA. The azole antifungal agents act as an inhibiter of Cytochrome P450. The intensity of the interaction is depended on the type of azole antifungal agents.
Voriconazole and itraconazole are considered to exhibit strong interaction compared to fluconazole
15. In this study, we also observed the increase in the C/D ratio of CsA by the administration of voriconazole or itraconazole. In addition, higher hematocrit was associated with higher C/D ratio, which can be explained by the fact that the uptake of CsA by erythrocytes was found to be about 50%
16.
CsA is extensively metabolized, with the liver being the main site of metabolism. In
a previous report, hepatic dysfunction delays the clearance of CsA or CsA metabolites,
whereas additional studies showed that standard biochemical tests of liver function
including serum bilirubin, AST, ALT and alkaline phoshatase levels were not
indicators of the ability of the liver of metabolizing CsA
13. In the current study,
elevated serum ALP and bilirubin levels were associated with higher C/D/ ratio with
borderline significance by univariate analyses, but these factors were not significant in
multivariate analysis. In addition, it has been generally considered that renal function
does not affect the CsA pharmacokinetics, although there have been some conflicting
reports
17-19. In the current study, the correlation of the C/D ratio of CsA and renal failure was not observed.
In conclusion, the continuous infusion of CsA with a target level between 450 and
550 ng/mL is a feasible and effective GVHD prophylaxis, but caution should be paid
for the difference in measuring method of CsA concentration. Each center should
monitor the actual daily dose of CsA and compare the data with those in previous
reports.
References
1. Ruutu T, Niederwieser D, Gratwohl A, Apperley JF. A survey of the prophylaxis and treatment of acute GVHD in Europe: a report of the European Group for Blood and Marrow, Transplantation (EBMT). Chronic Leukaemia Working Party of the EBMT. Bone Marrow Transplant. 1997;19(8):759-764.
2. Yee GC, Self SG, McGuire TR, Carlin J, Sanders JE, Deeg HJ. Serum cyclosporine concentration and risk of acute graft-versus-host disease after allogeneic marrow transplantation.
N Engl J Med. 1988;319(2):65-70.
3. Przepiorka D, Shapiro S, Schwinghammer TL, et al. Cyclosporine and methylprednisolone after allogeneic marrow transplantation: association between low
cyclosporine concentration and risk of acute graft-versus-host disease. Bone Marrow Transplant.
1991;7(6):461-465.
4. Ogawa N, Kanda Y, Matsubara M, et al. Increased incidence of acute graft-versus-host disease with the continuous infusion of cyclosporine A compared to twice-daily infusion. Bone Marrow Transplant. 2004;33(5):549-552.
5. Oshima K, Kanda Y, Nakasone H, et al. Decreased incidence of acute graft-versus-host disease by continuous infusion of cyclosporine with a higher target blood level. Am J Hematol.
2008;83(3):226-232.
6. Alvarez JS, Sacristan JA, Alsar MJ. Comparison of a monoclonal antibody fluorescent polarization immunoassay with monoclonal antibody radioimmunoassay for cyclosporin determination in whole blood. Ther Drug Monit. 1992;14(1):78-80.
7. Holt DW, Mueller EA, Kovarik JM, van Bree JB, Kutz K. The pharmacokinetics of Sandimmun Neoral: a new oral formulation of cyclosporine. Transplant Proc.
1994;26(5):2935-2939.
8. Przepiorka D, Weisdorf D, Martin P, et al. 1994 Consensus Conference on Acute GVHD Grading. Bone Marrow Transplant. 1995;15(6):825-828.
9. Murakami Y, Tanaka T, Murakami H, Tsujimoto M, Ohtani H, Sawada Y.
Pharmacokinetic modelling of the interaction between St John's wort and ciclosporin A. Br J Clin Pharmacol. 2006;61(6):671-676.
10. Mori T, Aisa Y, Kato J, Nakamura Y, Ikeda Y, Okamoto S. Drug interaction between voriconazole and calcineurin inhibitors in allogeneic hematopoietic stem cell transplant recipients.
Bone Marrow Transplant. 2009;44(6):371-374.
11. Kanda Y. Investigation of the freely available easy-to-use software 'EZR' for medical statistics. Bone Marrow Transplant. 2012.
12. Ptachcinski RJ, Venkataramanan R, Burckart GJ. Clinical pharmacokinetics of cyclosporin. Clin Pharmacokinet. 1986;11(2):107-132.
13. Yee GC, Lennon TP, Gmur DG, et al. Clinical pharmacology of cyclosporine in patients undergoing bone marrow transplantation. Transplant Proc. 1986;18(6 Suppl 5):153-159.
14. Yee GC, McGuire TR, Gmur DJ, Lennon TP, Deeg HJ. Blood cyclosporine
pharmacokinetics in patients undergoing marrow transplantation. Influence of age, obesity, and hematocrit. Transplantation. 1988;46(3):399-402.
15. Saad AH, DePestel DD, Carver PL. Factors influencing the magnitude and clinical significance of drug interactions between azole antifungals and select immunosuppressants.
Pharmacotherapy. 2006;26(12):1730-1744.
16. Lemaire M, Tillement JP. Role of lipoproteins and erythrocytes in the in vitro binding
and distribution of cyclosporin A in the blood. J Pharm Pharmacol. 1982;34(11):715-718.
17. Critical issues in cyclosporine monitoring: report of the Task Force on Cyclosporine Monitoring. Clin Chem. 1987;33(7):1269-1288.
18. Schroeder TJ, Sridhar N, Pesce AJ, Alexander JW, First MR. Clinical correlations of cyclosporine-specific and -nonspecific assays in stable renal transplants, acute rejection, and cyclosporine nephrotoxicity. Ther Drug Monit. 1993;15(3):190-194.
19. Shibata N, Hoshino N, Minouchi T, et al. Relationship between area under the concentration versus time curve of cyclosporin A, creatinine clearance, hematocrit value, and other clinical factors in Japanese renal transplant patients. Int J Clin Pharmacol Ther.
1998;36(4):202-209.
Table 1. Characteristics of the patients.
CsA500 group CsA300 group P-value
(n=69) (n=29)
Sex
Male 43 14 0.26
Female 26 15
Age
<45 34 13 0.83
≥ 45 35 16
Underlying disease
AL 42 20 0.02
CML 3 0
MDS 10 0
NHL 9 9
Others 5 0
Donor
Related 29 14 0.66
Unrelated 40 15
HLA
Match 50 24 0.32
Mismatch 19 5
Stem cell source
BM 46 17 0.49
PB 23 12
Regimen
TBI 49 20 1
Non-TBI 20 9
MTX dose
<31mg/m
223 14 0.18
≥31mg/m
246 15
Conditioning
MAC 44 15 0.37
RIC 25 14
Disease
Standard-risk 64 0 <0.001
High-risk 5 29
BM, bone marrow; PB, peripheral blood; TBI, total body irradiation; AL, acute leukemia; CML, chronic
myelogenous leukemia; MDS, myelodysplastic syndrome; NHL, non-Hodgkin’s lymphoma; MAC, myeloablative
conditioning; RIC, reduced-intensity conditioning
Table 2. Incidences of adverse events due to cyclosporine.
(-) (+) Incidence P-value Incidence of elevated serum creatinine level > 1.5 x baseline value
CsA500 37 32 (46%) 1.00
CsA300 15 14 (48%)
Incidence of elevated serum creatinine level > 2.0 x baseline value
CsA500 57 12 (17%) 0.58
CsA300 22 7 (24%)
Incidence of elevated serum bilirubin level > 2.0 mg/dL
CsA500 36 33 (48%) 0.83
CsA300 14 15 (52%)
Incidence of thrombotic microangiopathy
CsA500 61 8 (12%) 1.00
CsA300 26 3 (10%)
Table 3. Factors associated the incidence of grade II–IV acute GVHD
HR, hazard ratio, CI, confidence interval; AL, acute leukemia; BM, bone marrow; PB, peripheral blood; TBI, Total body irradiation; MAC, myeloablative conditioning; RIC, reduced-intensity conditioning
Univariate analyses Multivariate analyses
Factors HR (95%CI) p-value HR (95%CI) p-value
Target level of CsA
CsA500 vs. CsA300 1.24 (0.63-2.45) 0.53 Sex
Male vs. Female 1.35 (0.70-2.57) 0.36
Age
<45 vs. ≥45years 1.16 (0.60-2.22) 0.66 Underlying disease
AL vs. Non-AL 0.83 (0.42-1.64) 0.59 Donor
Related vs. Unrelated 0.79 (0.42-1.51) 0.48
HLA
Match vs. Mismatch 2.84 (1.48-5.42) 0.002 2.84 (1.48-5.42) 0.002
Stem cell source
BM vs. PB 1.47 (0.77-2.79) 0.24
Regimen
TBI vs. Non-TBI 0.81 (0.37-1.74) 0.58
MTX dose
<31 vs. ≥31mg/m2 1.30 (0.66-2.57) 0.44 Conditioning
MAC vs. RIC 1.00 (0.51-1.94) 0.99
Disease
Standard vs High-risk
1.29 (0.67-2.51) 0.45
Table 4. Factors associated the incidence of grade III–IV acute GVHD
HR, hazard ratio, CI, confidence interval; AL, acute leukemia; BM, bone marrow; PB, peripheral blood; TBI, Total body irradiation; MAC, myeloablative conditioning; RIC, reduced-intensity conditioning
Univariate analyses Multivariate analyses
Factors HR (95%CI) p-value HR (95%CI) p-value
Target levels of CsA
CsA500 vs. CsA300 2.56 (0.90-7.19) 0.08 3.60(1.20-10.81) 0.02 Sex
Male vs. Female 1.46 (0.52-4.11) 0.47
Age
<45 vs. ≥45years 1.22 (0.43-3.48) 0.71
Underlying disease
AL vs. Non-AL 0.64 (0.21-1.99) 0.44 Donor
Related vs. Unrelated 0.58 (0.20-1.65) 0.31
HLA
Match vs. Mismatch 3.55 (1.26-9.98) 0.02 4.77(1.60-14.25) 0.005
Stem cell source
BM vs. PB 1.36 (0.48-3.85) 0.57
Regimen
TBI vs. Non-TBI 0.99 (0.30-3.19) 0.99
MTX dose
<31 vs. ≥31mg/m2 1.57 (0.50-4.94) 0.44
Conditioning
MA vs. RIC 2.24 (0.79-6.34) 0.13
Disease
Standard vs High-risk 1.98 (0.70-5.57) 0.20
Table 5. Factors that may affect CsA C/D ratio
Univariate analysis Multivariate analysis
Factor C/D ratio p-value p-value
SEX
Male 134.60±58.73 0.14 Female 114.49±39.98
Age
<45years 113.41±39.00 0.04
≥45years 140.55±61.69
AST
<18mg/dL 124.70±47.66 0.74
≥18mg/dL 129.13±58.23
ALT
<25mg/dL 123.90±44.81 0.66
≥25mg/dL 129.71±59.87
ALP
<241mg/dL 112.57±39.28 0.06
≥241mg/dL 137.83±60.58
γGTP
<63.5mg/dL 125.00±49.20 0.78
≥63.5mg/dL 128.71±56.68
T-Bil
<0.96mg/dL 114.98±39.87 0.08
≥0.96mg/dL 137.61±61.00
Cr
<0.55mg/dL 124.74±58.83 0.73
≥0.55mg/dL 129.36±46.86
Ccr
<100.3mL/min 130.19±47.00 0.64
≥100.3mL/min 123.97±58.65
TG
<149mg/dL 124.22±50.07 0.68
≥149mg/dL 129.74±56.43
TC
<174mg/dL 120.29±47.40 0.34
≥174mg/dL 132.91±57.56.
Blood glucose
<124mg/dL 122.41±37.29 0.51
≥124mg/dL 131.66±68.01
BMI
<21.43 121.53±57.80 0.41
≥21.43 132.43±48.02
ITCZ,VRCZ
- 117.74±39.88 0.01 0.008
+ 158.41±77.44
Ht
<22.6% 110.37±39.43 0.02 0.002
≥22.6% 141.70±59.38
Ccr, creatinine clearance; TG, triglyceride; TC, total cholesterol; BMI, body mass index;
ITCZ, itraconazole; VRCZ, voriconazole; Ht, hematocrit
Figure 1. Serial blood concentrations (A) and actual daily doses (B) of cyclosporine.
Figure 2. Incidence of acute GVHD, grouped according to the target level of cyclosporine.
(A) grade II-IV, (B) grade III-IV.
Figure 3. Probabilities of overall survival (A), disease-free survival (B), and non-relapse
mortality (c) in the CsA500 group.
Figure 1.
A.
B.
Blood conc entration of cyclosporine (ng/m L l ) Actual daily dose of cyclosporine ( mg/kg/day )
Weeks after transplantation
Weeks after transplantation
Figure 2.
A.
B. Days
0 20 40 60 80 100 120
0.0 0.2 0.4 0.6 0.8 1.0
Incidence of grade II -IV acute GVHD
CsA500 CsA300
0 20 40 60 80 100 120
0.0 0.2 0.4 0.6 0.8 1.0
Incidence of grade II -IV acute GVHD
CsA500 CsA300
CsA500 CsA300
0 20 40 60 80 100 120
0.0 0.2 0.4 0.6 0.8 1.0
Days
Incidence of grade III -IV acute GVHD
Figure 3.
A. B.
B.
C.
Days
Probabilityof over all survival
0 200 400 600 800 1000 1200 1400
0.0 0.2 0.4 0.6 0.8 1.0
Days
Probabilityof over all survival
0 200 400 600 800 1000 1200 1400
0.0 0.2 0.4 0.6 0.8 1.0
0 200 400 600 800 1000 1200 1400
0.0 0.2 0.4 0.6 0.8 1.0
Probabilityof Disease-free survival
0 200 400 600 800 1000 1200 1400
0.0 0.2 0.4 0.6 0.8 1.0
D ays
Probabilityof Disease-free survival
0 200 400 600 800 1000 1200 1400
0.0 0.2 0.4 0.6 0.8 1.0
D ays
0 200 400 600 800 1000 1200 1400
0.0 0.2 0.4 0.6 0.8 1.0
0 200 400 600 800 1000 1200 1400
0.0 0.2 0.4 0.6 0.8 1.0
D ays
Days
Cumulative incidence of non-relapse mortality
0 200 400 600 800 1000 1200 1400
0.0 0.2 0.4 0.6 0.8 1.0
0 200 400 600 800 1000 1200 1400
0.0 0.2 0.4 0.6 0.8 1.0