Influence of Gas Flow Rate and Reactor Length on NO Removal Using Pulsed Power
journal or
publication title
IEEE TRANSACTIONS ON PLASMA SCIENCE
volume 29
number 4
page range 592‑598
year 2001‑08
URL http://hdl.handle.net/2298/3486
doi: 10.1109/27.940952
used to remove nitric oxide (NO) in a mixture of nitrogen, oxygen, water vapor, and NO, simulating flue gases from a power station.
The effects of the gas flow rate, the reactor length, and the pulse repetition rate on the percentage of NO removal and its energy ef- ficiency are reported. The percentage of NO removal at a fixed gas flow rate increased with increasing pulse repetition rate due to the increased energy into the discharge. At a fixed pulse rate, the re- moval of NO increased with decreasing gas flow rate due to the in- creased residence time of the gas in the discharge reactor, thus facil- itating the creation of increased radicals of O and N which then de- creased NO. The energy removal efficiency of NO (in mol/kWh) de- creased with increasing gas flow rate and increasing removal ratio of NO. The removal of NO increased with increasing energy den- sity (J/l) input into the discharge at different reactor length.
Index Terms—Coaxial reactor, energy efficiency, flue gases, NO
Xremoval, pulsed power.
I. I
NTRODUCTIONA IR POLLUTION caused by emission of a pollutant pro- duced by a variety of sources must be substantially re- duced as mandated by recent national legislations and interna- tional agreements. In recent years, several techniques have been used to remove pollutants from air, with various degrees of suc- cess. Nonthermal plasmas, in which the mean energy of elec- trons is substantially higher than that of the ions and the neutrals, offer a major advantage in reducing the energy requirements to remove the pollutants [1], [2]. The application of a short-dura- tion pulsed power to a gaseous gap at an atmospheric pressure results in the production of nonthermal plasma. The short-du- ration pulsed power produces high-energy electrons while the temperature of the ions and the neutrals remains relatively un- changed, thus, the energy consumed is reduced. Applications of nonthermal plasmas for the removal of NO
have been reported using electron beams, dielectric barrier dis-
Manuscript received October 24, 2000; revised April 16, 2001. This work was supported by a grant-in-aid for Scientific Research from the Ministry of Education of Japan.
T. Namihira and S. Katsuki are with the Department of Electrical and Com- puter Engineering, Kumamoto University, Kumamoto 860-8555, Japan (e-mail:
S. Tsukamoto, D. Wang, H. Hori, and H. Akiyama are with the Graduate School of Science and Technology, Kumamoto University, Kumamoto 860-8555, Japan.
R. Hackam is with the Department of Electrical and Computer Engineering, University of Windsor, Windsor, ON N9B3P4, Canada.
M. Shimizu and K. Yokoyama are with the Research Laboratory, Kyushu Electric Power Company, Inc., Fukuoka 815-0032, Japan.
Publisher Item Identifier S 0093-3813(01)07458-6.
at various energy effectiveness.
In the present work, a short-duration pulsed corona discharge has been used to obtain a high NO removal efficiency. The effect of the gas flow rate, the reactor length, and the pulse repetition rate on the percentage removal of NO and its energy efficiency are reported.
II. E
XPERIMENTALS
ET-U
P ANDP
ROCEDUREDetails of the experimental setup including the method used for measuring the gas flow rate, the NO and NO concentra- tions, and a description of the three-stage Blumlein line gener- ator have recently been given [3] and, therefore, they are omitted here for brevity. Only details relevant to the present experiments are briefly described here for completeness. In this work, the Blumlein line generator had an impedance of 300 and a pulse duration of 100 ns using six 10 m cables. The cable used had 0.1 nF/m and 0.25 H/m, which give a characteristic impedance of 50 . The pulse duration was defined as the full-width at half-maximum (FWHM) of the voltage waveform.
A mixture of gases was used to simulate the flue gases from a thermal power station. Gas cylinders of N , 0.09% NO with the balance N , and O were used to obtain the required mix- ture. Water vapor was mixed with the gas mixture by passing it through water at a constant temperature. In the present work, the gas composition of the simulated exhaust gases were NO of 200 ppm (part of NO per million parts of molecules of the mixture), 5% of O , 2.7% of H O and the balance N at an at- mospheric pressure (1.01 10 Pa) and 300 4 K. The per- centage of the pressure of water vapor in the gas mixture was controlled by maintaining a constant temperature of water [4].
The gas flow rate was varied from 2 to 12 l/min, and is reported here at an atmospheric pressure and corrected to 273 K. The gas flow rate was controlled by a mass flow controller (SEC-E440J, STEC Inc., Japan).
The reactor employed concentric coaxial cylindrical elec- trodes. The central rod made of stainless steel, 0.5 mm in diameter was placed concentrically in a copper cylinder having 76 mm in internal diameter. In the present work, the applied voltage from the Blumlein line generator to the reactor was measured using a resistive divider (1 /10 k ), which was connected between the central electrode of the reactor and the ground. The positive polarity of the applied voltage was used, as it was more effective than the negative polarity [1], [6]. The discharge current in the reactor was measured using a Rogowski coil (Pearson current monitor model 2878, Pearson
0093–3813/01$10.00 © 2001 IEEE
(a)
(b)
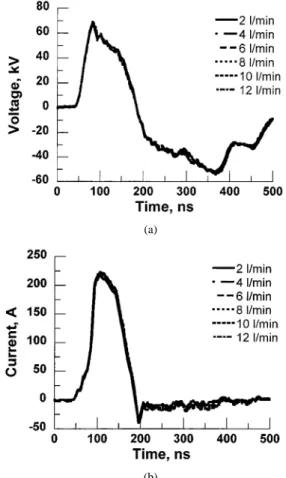
Fig. 1. Typical waveforms of (a) applied voltage and (b) discharge current in the reactor for different gas flow rates. Conditions: Reactor length, 250 mm; gas pressure, 1.012 10 Pa; gas temperature, 300 6 4 K; initial concentration, NO
= 200 ppm, O = 5%, H O = 2.7% and balance N ; series resistance with reactor, 0.
Electronics, USA), which was located on the return current to the ground. A digital oscilloscope (HP54542A, Hewlett Packard, USA) with a maximum bandwidth of 500 MHz and a maximum sample rate of 2 G Samples/s recorded the signal.
The oscilloscope was located inside a shielded room (70 dB), as this was necessary to reduce transients interference. The charged dc voltage to the generator was fixed at 25 kV when a fixed reactor length of 250 mm was used. A pulse repetition rate from 2 to 12 pulses per second (pps) was used.
For the study of the effects of the gas flow rate on the removal of NO, a fixed reactor length of 250 mm was employed. For the study of the effects of varying the reactor length on the removal of NO, the gas flow rate was set at 2.0 l/min, and four reactor lengths of 200, 400, 600, and 800 mm were employed. In this case, the applied peak pulse voltage was maintained at 53.9 kV.
The charging voltage had to be increased because the use of longer reactors resulted in progressively larger currents, thus necessitating increased charging voltage to maintain the same peak pulse voltage. All other conditions were kept the same.
III. R
ESULTS ANDD
ISCUSSIONSA. Effects of Gas Flow Rate
1) Voltage and Current Wave Shapes: Fig. 1 shows typical waveforms of applied voltage (a) to and the discharge current (b) in the coaxial reactor for varying gas flow rates. The applied
Fig. 2. Dependence of the input energy/pulse into the coaxial reactor as a function of time for different gas flow rates. Other conditions as in Fig. 1.
voltage had almost the same peak of 67.6 1.4 kV and nom- inal pulse width of 100 ns for all gas flow rates in the range 2 to 12 l/min [Fig. 1(a)]. The negative voltage swing following the positive peak was due to impedances mismatch between the Blumlein line generator and the reactor. The peak of the current was constant at 221.9 3.4 A for all gas flow rates used here [Fig. 1(b)].
2) Energy Input to the Discharge Per Pulse: Fig. 2 shows the input energy to the discharge per pulse for different gas flow rates and for durations of up to 500 ns. It should be noted that the current has decreased to 0 at about 400 ns [Fig. 1(b)]. The input energy ( ) per pulse was calculated from the voltage (in V) and current (in A) waveforms and (in s). The input energy to the reactor was constant at 0.89 0.03 J/pulse for all gas flow rates in the range 2 to 12 l/min. This is because both the voltage and the current wave shapes (Fig. 1) were not affected by the large variation of the gas flow rate.
3) NO and NO Reductions: Fig. 3 shows the final concen- trations of NO (a) and NO (b), respectively, for different gas flow rates and as a function of the pulse repetition rate after they have reached saturations. This took typically about 5 min after applying the pulsed power. It is observed from Fig. 3(a) that the concentration of NO decreased with increasing pulse repetition rate from 2 to 12 pps at a constant gas flow rate. Typically, the concentration of NO decreased from an initial value of 200 ppm to 146 ppm at 2 pps and to 38 ppm at 12 pps when the gas flow rate was 2 l/min [Fig. 3(a)]. This is because the energy input into the discharge increased with increasing the pulse repetition rate, and this resulted in an increased production of the O and N radicals, which then reduced NO via the following reactions [7]:
(1) where M is a third body, which can be said N . The reaction rate
of k cm /s [8] and
(2) with a reaction rate of K cm /s [9].
At a constant pulse repetition rate, the concentration of NO
decreased with decreasing gas flow rate. The larger reduction
of NO with decreasing gas flow rate (Fig. 3) is attributed to the
increasing residence time of the gas in the reactor. With longer
(a)
(b)
Fig. 3. Final concentrations of (a) NO and (b) NO as a function of pulse repetition rate for different gas flow rates. Nominal pulse width, 100 ns;
peak voltage, 67.6 kV; peak current, 221.9 A; reactor length, 250 mm; other conditions as in Fig. 1.2 l/min; 4 l/min; 6 l/min; 8 l/min; 10 l/min;
212 l/min.
durations of the gas in the reactor, a larger number of collisions between electrons and the neutrals take place and produce more of the radicals O and N, according to [11]
(3) (4) as well as other reactions [1], which then remove NO according to (1) and (2).
The production of NO after the application of the pulsed power [Fig. 3(b)] closely follows the removal of NO [Fig. 3(a)].
NO is produced from conversion of NO and from [11]
(5) 4) Energy Efficiency of NO Removal: Fig. 4 shows the de- pendence of the energy efficiencies (in mol/kWh), of NO [Fig. 4(a)] and of NO [Fig. 4(b)], respectively, on the removal ratios of NO and NO . The removal ratio of NO ( , in%) is given by
(6) where (in ppm) and (in ppm) are the initial (be- fore treatment) and the final (after treatment) concentrations of NO in the gas mixture, respectively. The removal ratio of NO
(a)
(b)
Fig. 4. Dependence of the energy efficiency of the removal of (a) NO and (b) NO on the removal ratios of NO and NO , respectively, for different gas flow rates. Conditions and symbols as in Fig. 3.
(NO , in%) is defined in a similar way to that of eq. (6). In the present work, the concentration of was 200 ppm. The energy efficiency of the removal of NO ( , in mol/kWh) is given by
(7) where
gas flow rate [l/min];
f pulse repetition rate [pps];
input energy to the reactor per pulse [J/pulse].
The energy efficiency of the removal of NO ( , in mol/kWh) is also given by an equation similar to (7) except
that and are used instead of and ,
respectively. The data in Fig. 4 can readily be converted to g/kWh since 0.03 kg of NO and 0.046 kg of NO are equivalent to 1 mol and 0.0224 m at atmospheric pressure and 273 K.
Fig. 4 shows the dependence of on (a) and
on (b) for different gas flow rates. The energy
efficiency for NO and NO removals decreased with increasing
NO and NO removal ratios at a constant gas flow rate. At a
fixed removal ratio of either NO [Fig. 4(a)] or NO [Fig. 4(b)],
the energy efficiency for the removal of NO and NO decreased
with increasing gas flow rate. This is because a higher input
energy is required to attain the same value of the NO removal
(a)
(b)
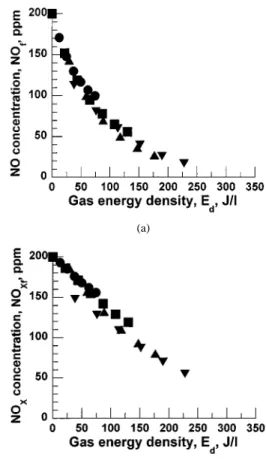
Fig. 5. Dependence of the final concentrations of (a) NO and (b) NO on the energy density J/l. Conditions and symbols as in Fig. 3.
ratio at a higher flow rate. This can be readily seen from Fig. 3(a) that, in order to attain a given final concentration of NO, larger pulse repetition rate and, therefore, a higher energy is required with increasing gas flow rate. The successive data in Fig. 4 (from left to right) with increasing and are plotted for increasing pulse repetition rate from 2 to 12 pps.
5) Energy Efficiencies of Removals of NO and NO : Fig. 5 shows the dependence of the final concen- trations of NO (a) and NO (b) on the input energy density to the gas mixture for different gas flow rates. The input energy density to the gas mixture ( , in J/l) is calculated using
(8) where , and have been defined in (7). Fig. 5 shows that the final values of NO and NO decreased with increasing energy density J/l for all gas flow rates from 2 to 12 l/min. The depen- dence of the final values of NO and NO at a fixed J/l does not depend on the gas flow rate.
B. Effect of Reactor Length
1) Voltage and Current Waveforms: Fig. 6 shows typical waveforms of the applied voltage (a) and the discharge current (b) in the reactor for varying lengths at a fixed gas flow rate of 2 l/min. The dc charging voltage had to be increased with increasing the reactor length to maintain the peak pulse voltage at 53.9 0.3 kV [Fig. 6(a)]. The peak of the pulse current increased from 70.4 to 208.9 A with increasing reactor
(a)
(b)
Fig. 6. Typical waveforms of (a) applied voltage and (b) discharge current for different reactor lengths. Gas flow rate 2 l/min. Other conditions as in Fig. 1.
Fig. 7. Dependence of input energy/pulse into the discharge for different lengths of the coaxial reactor. Gas flow rate 2 l/min, other conditions as in Fig. 1.
length, respectively, from 200 to 800 mm [Fig. 6(b)]. The characteristics of these waveforms suggest that the impedance of the discharge decreased with increasing reactor length. This is because, progressively, a larger number of streamers were produced and, therefore, a larger current flow with increasing anode wire length in the longer reactors.
2) Energy Input/Pulse to the Discharge: Fig. 7 shows the input energy to the reactor per pulse for different reactor lengths.
The input energy to the reactor increased from 0.206 to 0.632
J/pulse with increasing reactor length, respectively, from 200 to
800 mm. The coupling of a high-input energy into the discharge
for longer reactor is useful as it leads to a larger reduction in
(a)
(b)
Fig. 8. Dependence of the final concentrations of (a) NO and (b) NO on pulse repetition rate for different reactor lengths. Conditions as in Fig. 6.20 cm;
40 cm; 60 cm; 80 cm.
NO and NO . The reason for the increase in the energy that can be fed into the discharge is due to the larger current, which is formed by a larger number of streamer channels with increasing reactor length (Fig. 6).
3) NO and NO Removals: Fig. 8 shows the final concen- trations of NO (a) and NO (b) as a function of pulse repeti- tion rate for different reactor lengths. It will be observed from Fig. 8(a) that the concentration of NO decreased with increasing pulse repetition rate at a constant reactor length. This is because, and I as mentioned in Section III-A3, the energy input into the discharge increased with increasing pulse repetition rate. At a fixed pulse repetition rate the final concentrations of NO and NO decreased with increasing reactor length (Fig. 8). This is due to the increased residence time of the gas in the reactor with increasing reactor length.
4) Energy Efficiency of NO Removal: Fig. 9 shows the dependence of the energy removal efficiency as a function of the NO removal ratio [Fig. 9(a)] and the NO removal ratio [Fig. 9(b)] for different reactor lengths. It will be observed that the energy efficiencies of both NO and NO are not strongly dependent on the reactor length. Fig. 9 shows that the removal energy efficiencies, over a restricted range of the removal ratios of NO and NO , when 800 mm long reactor is used, are slightly higher than for shorter reactors.
5) Dependence on Energy Density J/l: Fig. 10 shows the de- pendence of the final concentrations of NO (a) and NO (b) on the input energy density to the gas mixture for different reactor lengths. Fig. 10 shows that the final concentrations of NO and
(a)
(b)
Fig. 9. Dependence of the energy efficiency of the removal of (a) NO and (b) NO on the removal ratios of NO and NO , respectively, for different reactor lengths. Conditions and symbols as in Fig. 8.
(a)
(b)
Fig. 10. Dependence of the final concentrations of (a) NO and (b) NO on the energy density J/l. Conditions and symbols as in Fig. 8.
NO decreased with increasing the energy density input to the discharge. At a fixed input energy density to the gas mixture, the final concentrations of NO and NO slightly decreased with increasing reactor length in the range 200 to 800 mm. Fig. 10 shows that, in order to obtain a constant value of reduced NO and NO , the amount of J/l required is not strongly dependent on the reactor length. This can be explained by a reference to Fig. 8, where it can be seen that a lower pulse repetition rate can be used to attain fixed values of the reduced NO and NO . However, at the same peak pulse voltage of 53.9 kV, much larger discharge currents were present [Fig. 6(b)] for longer reactors.
IV. C
ONCLUSIONPulsed power has been used to remove NO in a mixture of N , O , and H O. The following conclusions have been de- duced.
1) For a fixed length of the reactor, the peak of the pulse voltage and the peak of the pulse discharge current were independent of the gas flow rate in the range 2–12 l/min when a constant charging voltage was used.
2) The energy input/pulse into the discharge was indepen- dent of the gas flow rate at a fixed reactor length.
3) The final concentrations of NO and NO decreased with increasing pulse rate at a fixed reactor length and a fixed gas flow rate.
4) The final concentrations of NO and NO decreased with decreasing gas flow rate at a fixed reactor length and a fixed pulse repetition rate.
5) The energy efficiency removal (mol/kWh) of NO and NO decreased with increasing their removal ratios at a constant gas flow rate.
6) The energy efficiency removal (mol/kWh) of NO and NO decreased with increasing gas flow rate at constant removal ratios of NO and NO , respectively.
7) The final concentrations of NO and NO decreased with increasing energy density (J/l) input to the discharge and were independent of the gas flow rate at a constant J/l.
8) At a fixed gas flow rate, the peak of the pulsed voltage was maintained constant by increasing the charging voltage, and the peak of the pulsed current increased, with increasing reactor length.
9) The energy input/pulse into the discharge increased with increasing reactor length.
10) At a fixed gas flow rate and a fixed pulse repetition rate, the final concentrations of NO and NO decreased with increasing reactor length.
11) The NO and NO energy efficiency removal at a fixed removal ratio was not strongly dependent on the length of the reactor.
12) At a fixed energy density input (J/l) the final concentra- tions of NO and NO were independent of the reactor length.
R
EFERENCES[1] B. M. Penetrante and S. E. Schultheis, “Nonthermal plasma techniques for pollution control,” in Overview, Fundamentals and Supporting Tech- nologies. New York: Springer-Verlag, 1993, pt. A, pp. 1–393.
[2] B. M. Penetrante and S. E. Schultheis, “Nonthermal plasma techniques for pollution control,” in Electron Beam and Electrical Discharge Pro- cessing. New York: Springer-Verlag, 1993, pt. B, pp. 1–397.
[3] T. Namihira, S. Tsukamoto, D. Wang, S. Katsuki, R. Hackam, H.
Akiyama, Y. Uchida, and M. Koike, “Improvement of NO removal efficiency using short-width pulsed power,” IEEE Trans. Plasma Sci., vol. 28, pp. 434–442, Apr. 2000.
[4] R. C. Weast, Ed., CRC Handbook of Chemistry and Physics, 65th ed., 1984–1985, p. D-193.
[5] S. Masuda, “Pulse corona induced plasma chemical process: A horizon of new plasma chemical technologies,” Pure Appl. Chem., vol. 60, pp.
727–731, 1988.
[6] E. J. M. van Heesch, H. W. M. Smulders, S. V. B. van Paasen, P. P.
M. Blom, F. M. van Gompel, A. J. P. M. Staring, and K. J. Ptasinski,
“Pulsed corona for gas and water treatment,” in Proc. 11th IEEE Int.
Pulsed Power Conf., Baltimore, MD, 1997, pp. 103–108.
[7] R. Hackam and H. Akiyama, “Air pollution control by electrical dis- charges,” IEEE Trans. Dielect. Elect. Insulation, vol. 7, pp. 654–683, Oct. 2000.
[8] K. Urashima and J. S. Chang, “The effect of ammonia injection rate and discharge power on the reduction of NO from combustion flue gas by superimposing barrier discharge reactors,” J. Adv. Oxid. Technol., vol.
2, pp. 286–293, 1997.
[9] K. Urashima, J. S. Chang, and T. Ito, “Reduction of NO from com- bustion flue gases by superimposed barrier discharge plasma reactions,”
IEEE Trans. Ind. Applicat., vol. 33, pp. 879–886, 1997.
[10] B. M. Penetrante, “Removal of NO from diesel generator exhaust by pulse electron beams,” in 11th IEEE Int. Pulsed Power Conf., 1997, pp.
91–96.
[11] B. M. Penetrante, “Plasma chemistry and power consumption in non- thermal de-NO ,” in Nonthermal Plasma Techniques for Pollution Con- trol, B. M. Penetrante and S. E. Schultheis, Eds. New York: Springer- Verlag, 1993, pt. A, pp. 65–90.
Takao Namihira (M’00) was born in Shizuoka, Japan, on January 23, 1975. He received the B.S.
and M.S. degrees from Kumamoto University, Kumamoto, Japan, in 1997 and 1999, respectively.
Since 1999, he has been a Research Associate at Kumamoto University.
Shunsuke Tsukamoto was born in Kumamoto, Japan, on July 3, 1954. He received the B.S. degree in electrical engineering from Ariake National College of Technology, Fukuoka, Japan, and the M.S. and Ph.D. degrees from Kumamoto University, Japan, in 1975, 1998, and 2001, respectively.
He is currently an Assistant Professor of Ariake National College of Technology.
Douyan Wang was born in Beijing, China, on May 18, 1975. She received the B.S. and M.S. degrees from Kumamoto University, Kumamoto, Japan, in 1998 and 2000, respectively.
Since 2000, she has been with Hitachi, Ltd., Japan.
Sunao Katsuki (M’99) was born in Kumamoto, Japan, on January 5, 1966. He received the B.S., M.S., and Ph.D. degrees from Kumamoto Univer- sity, Kumamoto, Japan, in 1989, 1991, and 1998, respectively.
From 1991 to 1998, he was a Research Associate at Kumamoto University, where he has been an As- sociate Professor since 1998.
Reuben Hackam (M’76–SM’76–F’88) received the B.S. degree from the Technion, Israel Institute of Technology, Haifa, Israel, and the Ph.D. and D.Eng.
degrees from the University of Liverpool, U.K., in 1960, 1964, and 1988, respectively.
From 1964 to 1968, he was with General Electric-English Electric Company, Stafford, U.K.
From 1969 to 1978, he was with the University of Sheffield and, since 1979, he has been a Professor of Electrical Engineering at the University of Windsor, Canada, where he holds the position of University Distinguished Professor. During 1998–1999, he was on sabbatical leave at Kumamoto University, Japan.
Masaru Shimizu was born on March 10, 1957, in Fukuoka, Japan. He was graduated from the industrial chemistry course of Kanda Technical High School in 1975.
In the same year, he joined Kyushu Electric Power Company, Inc. His research interests include the water chemistry of fossil fuel power plants.
Currently, he is the Senior Research Engineer of the Power Plant Engineering Group, Research Laboratory, Kyushu Electric Power Company.
Kenichi Yokoyama was born on May 22, 1951. He received the B.S. degree in nuclear engineering from Tokyo University, Japan, in 1974.
In 1974, he joined Kyushu Electric Power Company, Inc., Fukuoka, Japan. His research has included the design and operation of nuclear power plants. Currently, he is the Manager of the Power Plant Engineering Group, Research Laboratory, Kyushu Electric Power Company.