関東・東海地域における最近20年間の地震観測結果
(発震機構解)−特別研究「関東・東海地域におけ る地震活動に関する研究」観測成果のまとめ(その 4)−
著者 松村 正三, 関東東海地殻活動観測研究グループ
雑誌名 防災科学技術研究所 研究資料
号 224
ページ 1‑84
発行年 2002‑03
URL http://doi.org/10.24732/nied.00001838
防災科学技術研究所研究資料 第224号 2002年3月
− 1 − 1
本資料は,特別研究「関東・東海地域における地震活 動に関する研究」のもとで観測,解析された結果を紹介 した成果集の第4弾である.成果集(その2)(木村ほか,
2001)では,同プロジェクトの観測網によって関東・東 海地域で観測された微小地震の震源について1979年7月 から1999年末までの20年にわたって得られたデータが,
平面分布図,断面分布図上で提示された.本資料では,
微小地震の発震機構解(focal mechanism solution)につ いて,同じ期間,同じ地域を選んで同様の図面上に描き 出した.微小地震データの解析においては震源分布と発 震機構解分布の2種がもっとも基本となる情報である.
本資料−成果集(その4)は,成果集(その2)とあわ せ比べながら参照されることを期して作成した.そのた めに,図の並び,断面の切り口の選び方などは可能な限 り成果集(その2)と整合するように図ったつもりであ る.
2
ここで集成した発震機構解は,P波の初動極性に基づ いて解析された結果である.P波初動は,観測点ごとに 押し,引きの2相に分別され,震源における四象元型の 発震機構を想定することで観測結果にもっとも適合する 解が選ばれる.実際の解析は,一定のアルゴリズムのも とでコンピュータによって試行錯誤的に行われる.アル ゴリズムの詳細については,岡田(1988)を参照された い.コンピュータによる解析は,最低6個の極性読み取 りのデータがあった場合から開始されるが,実際に解が 求まる割合は震源の数の15%程度であり,ここで扱った 解の総数は35,280個であった.現実には6点くらいのデ ータでは精度のよい解は得られ難い.従って,結果には 通常一定程度の不確定性と読み取りの間違いなどによる 誤差が含まれていることを承知しておく必要がある.岡 田(1988)は,結果の信頼性を表す指標としてA,B,C,
Dの4ランク分けを導入したが,本資料の作成において 松村正三*・関東東海地殻活動観測研究グループ**
Focal Mechanism Solutions in the Kanto-Tokai District over the Past 20 Years
−
−Summary of Observational Results from the Special Research Project
“ Research on Seismic Activities in the Kanto-Tokai District ” (Part 4)−−
Shozo MATSUMURA* and Observation and Research Group of Crustal Activities in the Kanto-Tokai District**
*Solid Earth Research Group
**National Research Institute for Earth Science and Disaster Prevention, Japan
Abstract
This paper compiles the focal mechanism solutions data that were observed and analyzed in the Kanto-Tokai district in Japan. It is based on the database constructed by the special research project “Research on Seismic Activities in the Kanto-Tokai District”, which has been ongoing since July, 1979. The reader of this paper should refer to the similar paper compiling hypocenter data, which was previously issued (Kimura et al., 2000). It is expected that both papers will play an important role in revealing, and resolving, various tectonic problems in the Kanto-Tokai district, and the source mechanisms of disastrous earthquakes that have occurred in the past, or might occur in the future.
Key words: Kanto-Tokai district, Microearthquake observation, Focal mechanism solution
*独立行政法人 防災科学技術研究所 固体地球研究部門
**独立行政法人 防災科学技術研究所
はランク分けに対しての考慮をはらっていない.微小地 震の発震機構解には誤差が含まれていることを覚悟した うえで,個別の解を見るのではなくある空間範囲のデー タを集団として観察した時,その平均的な分布パタンが その場の応力パタンを表現している,という考えに基づ いてできるだけ多くのデータを集積することを意図した ためである.ただし,比較的マグニチュードが大きい地 震では極性読み取り数も多く個別の解の信頼性は高い.
1では,M3.5以上の地震を対象とし,これについてだ けは個別の発震機構解を震源球投影による表示とした.
2以降は,マグニチュードによる足切りはせず,すべ ての解についてP軸(圧縮軸),T軸(伸張軸)の投影図 としている.以下に図番ごとの内容を概説する.
1は,各年の解の分布図である.M3.5以上の地震を 取り上げ,震源球の下半球に等積投影した結果である.
また,深さ20kmで分別し,地殻内の浅い地震(赤色系 統)とそれよりも深い地震(青色系統)に分けて図を描 き出した.
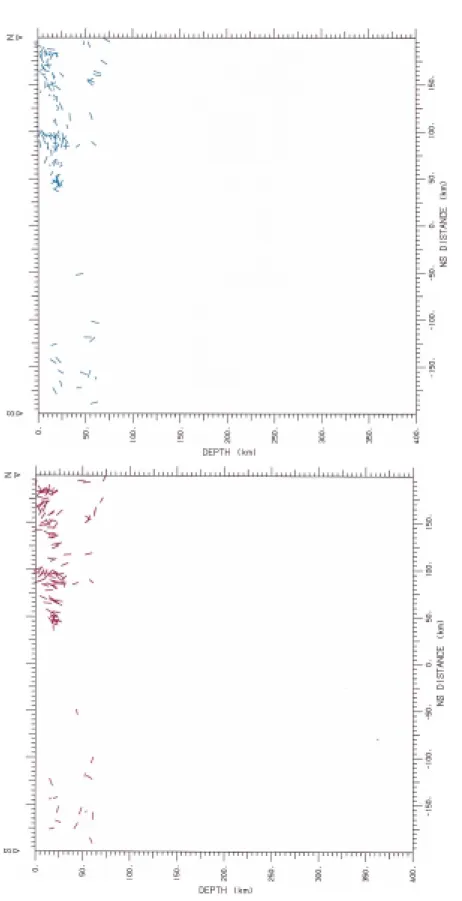
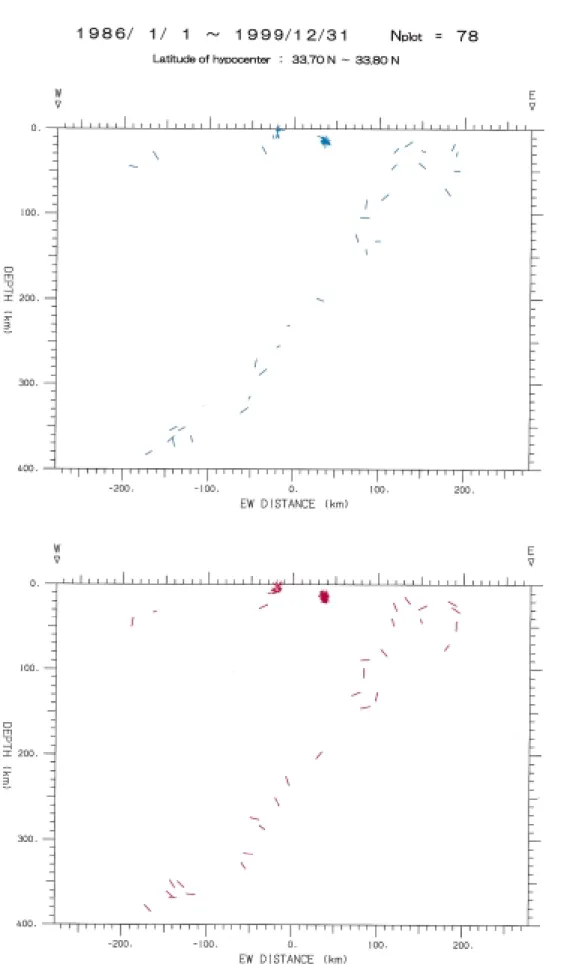
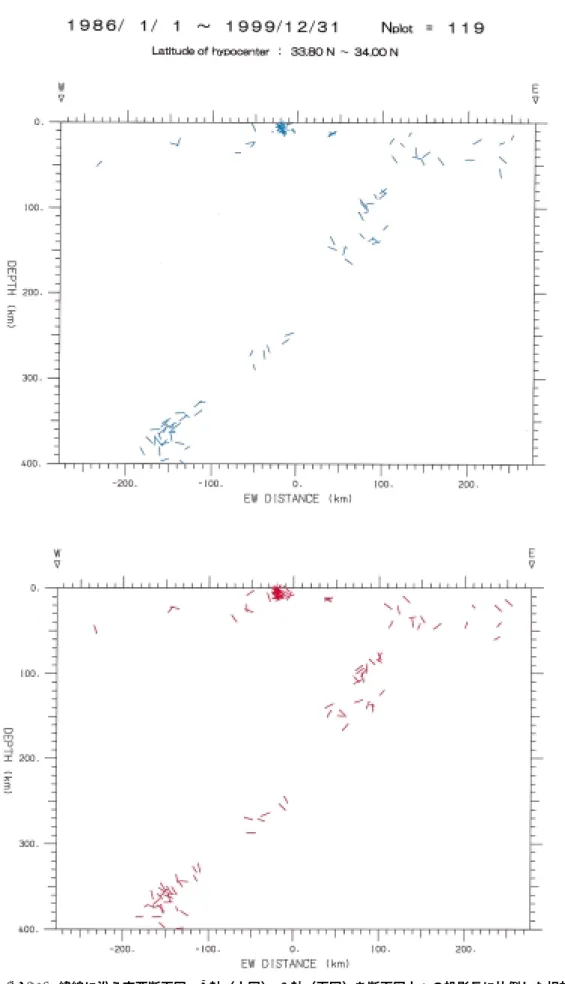
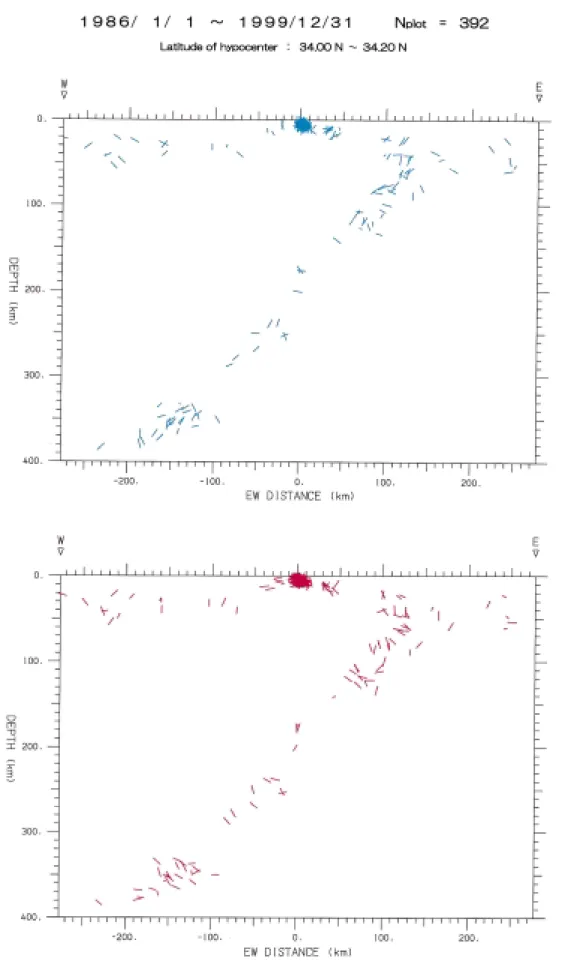
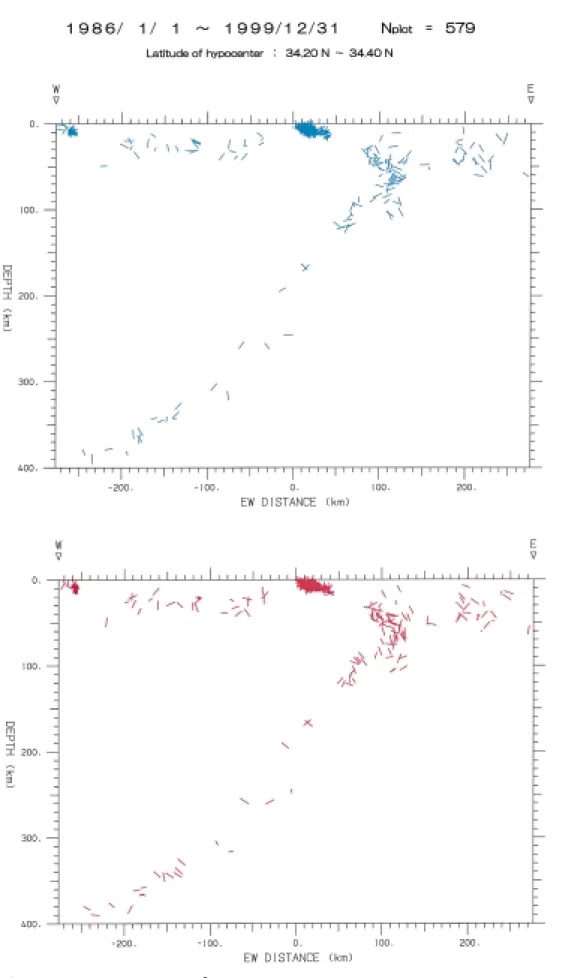
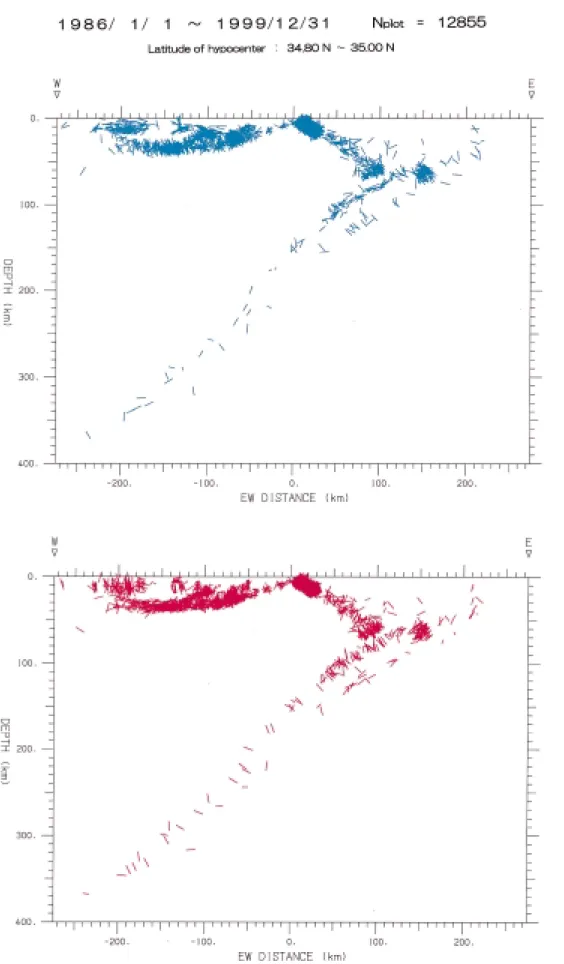
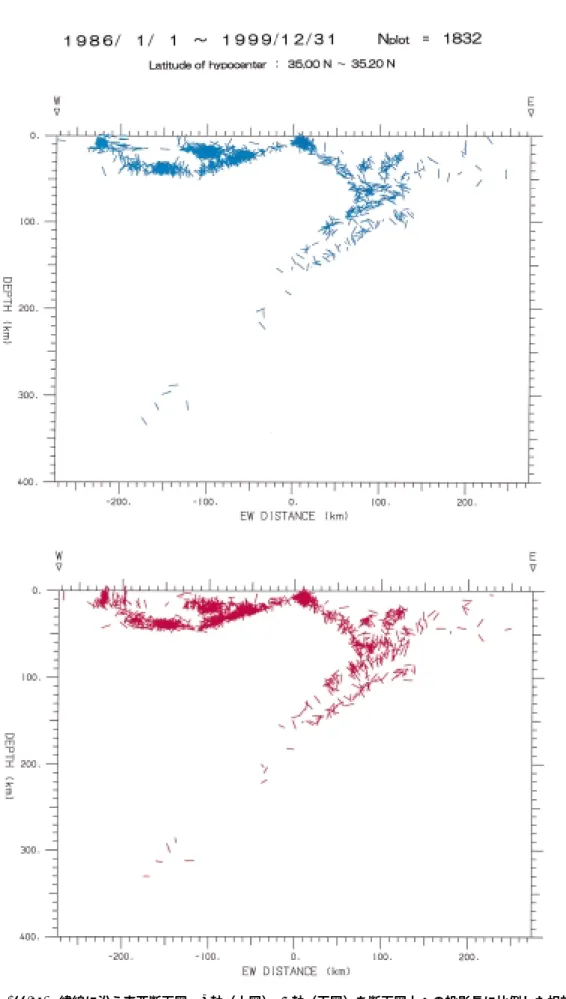
2は,経度方向,緯度方向に切り分けた断面図であ る.P軸(圧縮軸:青色)とT軸(伸張軸:赤色),それ ぞれについて断面図上への投影を相対長さで表示してい る.それぞれの軸の鉛直または水平からの傾きの分布に 注目されたい.
3は, 2と同様の図を深さ方向に区切って描き出 したものである.P軸,T軸それぞれの方位分布に注目さ れたい.
3
関東・東海地殻活動観測網による観測は1979年7月に
始まり,本年(2001年)で22年目となる.この間,多 少の変遷はあったが,基本的な観測網およびデータ処理 のためのシステムや方式には改変を施していない.完璧 とは言えないまでも,全期間を通してのデータの一様性 については他に誇るところである.とはいえ,100年を 越える大地震の1サイクルから見ればまだまだ観測デー タの蓄積は十分ではない.今後,システムの老朽化や,
観測手法の高度化といった時代の波を乗り切っていかに 安定した観測を続けていくかは重要かつ至難な問題であ る.こうした問題を解決すること,また,観測の節目ご とに多様な観測成果集をまとめていくこと,これらは関 東・東海プロジェクトの遂行における本質的な課題であ る.
本資料集の図面作成にあたっては,町田文子さん(固 体地球研究部門)の多大な労力に負っています.ここに 記して感謝の意を表します.
1) 木 村 尚 紀 ・ 関 東 東 海 地 殻 活 動 観 測 研 究 グ ル ー プ
(2001):関東・東海地域における最近20年間の地震 活動―特別研究「関東・東海地域における地殻活動 に関する研究」観測成果のまとめ(その2)―. 防災 科学技術研究所研究資料,No.209,1-130.
2) 岡田義光(1988):震源計算・発震機構解計算プログ ラムの改良. 国立防災科学技術センター研究報告,
No.41,153-162.
(原稿受理:2001年12月7日)
防災科学技術研究所研究資料 第224号 2002年3月
− 2 −
防災科学技術研究所の関東・東海地殻活動観測網により1979年7月から続けられてきた微小地震観測によって構 築されたデータベースに基づき,同地域の発震機構解の解析結果をまとめた.この資料集は,既に発刊されている震 源データの資料集とセットで扱われるべきものである.双方の資料を参照することは,関東・東海地域の複雑なテク トニクスの解明に,また,この地域に起きる地震の発生機構の解明を推進するうえで大きな役割を演ずることが期待 される.
:関東・東海地域,微小地震観測,発震機構解
関東・東海地域における最近20年間の地震観測結果(発震機構解)―松村ほか
− 3 −
1 (1/21) 年ごとの発震機構解分布図.M3.5以上,下半球等積投影.上図:20km以浅,下図:20km以深 Fig. 1 (1/21) Annual projection of focal mechanism solutions. Solutions of M3.5 and greater are given in the lower
hemisphere equal-area projection. Top: focal depth shallower than 20 km; and bottom: deeper than 20 km.
防災科学技術研究所研究資料 第224号 2002年3月
− 4 −
1 (2/21) 年ごとの発震機構解分布図.M3.5以上,下半球等積投影.上図:20km以浅,下図:20km以深 Fig. 1 (2/21) Annual projection of focal mechanism solutions. Solutions of M3.5 and greater are given in the lower
hemisphere equal-area projection. Top: focal depth shallower than 20 km; and bottom: deeper than 20 km.
関東・東海地域における最近20年間の地震観測結果(発震機構解)―松村ほか
− 5 −
1 (3/21) 年ごとの発震機構解分布図.M3.5以上,下半球等積投影.上図:20km以浅,下図:20km以深 Fig. 1 (3/21) Annual projection of focal mechanism solutions. Solutions of M3.5 and greater are given in the lower
hemisphere equal-area projection. Top: focal depth shallower than 20 km; and bottom: deeper than 20 km.
防災科学技術研究所研究資料 第224号 2002年3月
− 6 −
1 (4/21) 年ごとの発震機構解分布図.M3.5以上,下半球等積投影.上図:20km以浅,下図:20km以深 Fig. 1 (4/21) Annual projection of focal mechanism solutions. Solutions of M3.5 and greater are given in the lower
hemisphere equal-area projection. Top: focal depth shallower than 20 km; and bottom: deeper than 20 km.
関東・東海地域における最近20年間の地震観測結果(発震機構解)―松村ほか
− 7 −
1 (5/21) 年ごとの発震機構解分布図.M3.5以上,下半球等積投影.上図:20km以浅,下図:20km以深 Fig. 1 (5/21) Annual projection of focal mechanism solutions. Solutions of M3.5 and greater are given in the lower
hemisphere equal-area projection. Top: focal depth shallower than 20 km; and bottom: deeper than 20 km.
防災科学技術研究所研究資料 第224号 2002年3月
− 8 −
1 (6/21) 年ごとの発震機構解分布図.M3.5以上,下半球等積投影.上図:20km以浅,下図:20km以深 Fig. 1 (6/21) Annual projection of focal mechanism solutions. Solutions of M3.5 and greater are given in the lower
hemisphere equal-area projection. Top: focal depth shallower than 20 km; and bottom: deeper than 20 km.
関東・東海地域における最近20年間の地震観測結果(発震機構解)―松村ほか
− 9 −
1 (7/21) 年ごとの発震機構解分布図.M3.5以上,下半球等積投影.上図:20km以浅,下図:20km以深 Fig. 1 (7/21) Annual projection of focal mechanism solutions. Solutions of M3.5 and greater are given in the lower
hemisphere equal-area projection. Top: focal depth shallower than 20 km; and bottom: deeper than 20 km.
防災科学技術研究所研究資料 第224号 2002年3月
− 10 −
1 (8/21) 年ごとの発震機構解分布図.M3.5以上,下半球等積投影.上図:20km以浅,下図:20km以深 Fig. 1 (8/21) Annual projection of focal mechanism solutions. Solutions of M3.5 and greater are given in the lower
hemisphere equal-area projection. Top: focal depth shallower than 20 km; and bottom: deeper than 20 km.
関東・東海地域における最近20年間の地震観測結果(発震機構解)―松村ほか
− 11 −
1 (9/21) 年ごとの発震機構解分布図.M3.5以上,下半球等積投影.上図:20km以浅,下図:20km以深 Fig. 1 (9/21) Annual projection of focal mechanism solutions. Solutions of M3.5 and greater are given in the lower
hemisphere equal-area projection. Top: focal depth shallower than 20 km; and bottom: deeper than 20 km.
防災科学技術研究所研究資料 第224号 2002年3月
− 12 −
1 (10/21) 年ごとの発震機構解分布図.M3.5以上,下半球等積投影.上図:20km以浅,下図:20km以深 Fig. 1 (10/21) Annual projection of focal mechanism solutions. Solutions of M3.5 and greater are given in the lower
hemisphere equal-area projection. Top: focal depth shallower than 20 km; and bottom: deeper than 20 km.
関東・東海地域における最近20年間の地震観測結果(発震機構解)―松村ほか
− 13 −
1 (11/21) 年ごとの発震機構解分布図.M3.5以上,下半球等積投影.上図:20km以浅,下図:20km以深 Fig. 1 (11/21) Annual projection of focal mechanism solutions. Solutions of M3.5 and greater are given in the lower
hemisphere equal-area projection. Top: focal depth shallower than 20 km; and bottom: deeper than 20 km.
防災科学技術研究所研究資料 第224号 2002年3月
− 14 −
1 (12/21) 年ごとの発震機構解分布図.M3.5以上,下半球等積投影.上図:20km以浅,下図:20km以深 Fig. 1 (12/21) Annual projection of focal mechanism solutions. Solutions of M3.5 and greater are given in the lower
hemisphere equal-area projection. Top: focal depth shallower than 20 km; and bottom: deeper than 20 km.
関東・東海地域における最近20年間の地震観測結果(発震機構解)―松村ほか
− 15 −
1 (13/21) 年ごとの発震機構解分布図.M3.5以上,下半球等積投影.上図:20km以浅,下図:20km以深 Fig. 1 (13/21) Annual projection of focal mechanism solutions. Solutions of M3.5 and greater are given in the lower
hemisphere equal-area projection. Top: focal depth shallower than 20 km; and bottom: deeper than 20 km.
防災科学技術研究所研究資料 第224号 2002年3月
− 16 −
1 (14/21) 年ごとの発震機構解分布図.M3.5以上,下半球等積投影.上図:20km以浅,下図:20km以深 Fig. 1 (14/21) Annual projection of focal mechanism solutions. Solutions of M3.5 and greater are given in the lower
hemisphere equal-area projection. Top: focal depth shallower than 20 km; and bottom: deeper than 20 km.
関東・東海地域における最近20年間の地震観測結果(発震機構解)―松村ほか
− 17 −
1 (15/21) 年ごとの発震機構解分布図.M3.5以上,下半球等積投影.上図:20km以浅,下図:20km以深 Fig. 1 (15/21) Annual projection of focal mechanism solutions. Solutions of M3.5 and greater are given in the lower
hemisphere equal-area projection. Top: focal depth shallower than 20 km; and bottom: deeper than 20 km.
防災科学技術研究所研究資料 第224号 2002年3月
− 18 −
1 (16/21) 年ごとの発震機構解分布図.M3.5以上,下半球等積投影.上図:20km以浅,下図:20km以深 Fig. 1 (16/21) Annual projection of focal mechanism solutions. Solutions of M3.5 and greater are given in the lower
hemisphere equal-area projection. Top: focal depth shallower than 20 km; and bottom: deeper than 20 km.
関東・東海地域における最近20年間の地震観測結果(発震機構解)―松村ほか
− 19 −
1 (17/21) 年ごとの発震機構解分布図.M3.5以上,下半球等積投影.上図:20km以浅,下図:20km以深 Fig. 1 (17/21) Annual projection of focal mechanism solutions. Solutions of M3.5 and greater are given in the lower
hemisphere equal-area projection. Top: focal depth shallower than 20 km; and bottom: deeper than 20 km.
防災科学技術研究所研究資料 第224号 2002年3月
− 20 −
1 (18/21) 年ごとの発震機構解分布図.M3.5以上,下半球等積投影.上図:20km以浅,下図:20km以深 Fig. 1 (18/21) Annual projection of focal mechanism solutions. Solutions of M3.5 and greater are given in the lower
hemisphere equal-area projection. Top: focal depth shallower than 20 km; and bottom: deeper than 20 km.
関東・東海地域における最近20年間の地震観測結果(発震機構解)―松村ほか
− 21 −
1 (19/21) 年ごとの発震機構解分布図.M3.5以上,下半球等積投影.上図:20km以浅,下図:20km以深 Fig. 1 (19/21) Annual projection of focal mechanism solutions. Solutions of M3.5 and greater are given in the lower
hemisphere equal-area projection. Top: focal depth shallower than 20 km; and bottom: deeper than 20 km.
防災科学技術研究所研究資料 第224号 2002年3月
− 22 −
1 (20/21) 年ごとの発震機構解分布図.M3.5以上,下半球等積投影.上図:20km以浅,下図:20km以深 Fig. 1 (20/21) Annual projection of focal mechanism solutions. Solutions of M3.5 and greater are given in the lower
hemisphere equal-area projection. Top: focal depth shallower than 20 km; and bottom: deeper than 20 km.
関東・東海地域における最近20年間の地震観測結果(発震機構解)―松村ほか
− 23 −
1 (21/21) 年ごとの発震機構解分布図.M3.5以上,下半球等積投影.上図:20km以浅,下図:20km以深 Fig. 1 (21/21) Annual projection of focal mechanism solutions. Solutions of M3.5 and greater are given in the lower
hemisphere equal-area projection. Top: focal depth shallower than 20 km; and bottom: deeper than 20 km.
防災科学技術研究所研究資料 第224号 2002年3月
− 24 −
2 (1/44) 断面図の位置を示す索引図
Fig. 2 (1/44) Index map for cross-sectional projection.
関東・東海地域における最近20年間の地震観測結果(発震機構解)―松村ほか
− 25 −
2 (2/44) 経線に沿う南北断面図.P軸(上図),T軸(下図)を断面図上への投影長に比例した相対長で描い ている.
Fig. 2 (2/44) Cross-sectional projection of focal mechanism solutions. P-axes (top) and T-axes (bottom) are projected on the section parallel to N-S direction.
防災科学技術研究所研究資料 第224号 2002年3月
− 26 −
A
2 (3/44) 経線に沿う南北断面図.P軸(上図),T軸(下図)を断面図上への投影長に比例した相対長で描い ている.
Fig. 2 (3/44) Cross-sectional projection of focal mechanism solutions. P-axes (top) and T-axes (bottom) are projected on the section parallel to N-S direction.
関東・東海地域における最近20年間の地震観測結果(発震機構解)―松村ほか
− 27 −
B
2 (4/44) 経線に沿う南北断面図.P軸(上図),T軸(下図)を断面図上への投影長に比例した相対長で描い ている.
Fig. 2 (4/44) Cross-sectional projection of focal mechanism solutions. P-axes (top) and T-axes (bottom) are projected on the section parallel to N-S direction.
防災科学技術研究所研究資料 第224号 2002年3月
− 28 −
C
2 (5/44) 経線に沿う南北断面図.P軸(上図),T軸(下図)を断面図上への投影長に比例した相対長で描い ている.
Fig. 2 (5/44) Cross-sectional projection of focal mechanism solutions. P-axes (top) and T-axes (bottom) are projected on the section parallel to N-S direction.
関東・東海地域における最近20年間の地震観測結果(発震機構解)―松村ほか
− 29 −
D
2 (6/44) 経線に沿う南北断面図.P軸(上図),T軸(下図)を断面図上への投影長に比例した相対長で描い ている.
Fig. 2 (6/44) Cross-sectional projection of focal mechanism solutions. P-axes (top) and T-axes (bottom) are projected on the section parallel to N-S direction.
防災科学技術研究所研究資料 第224号 2002年3月
− 30 −
E
2 (7/44) 経線に沿う南北断面図.P軸(上図),T軸(下図)を断面図上への投影長に比例した相対長で描い ている.
Fig. 2 (7/44) Cross-sectional projection of focal mechanism solutions. P-axes (top) and T-axes (bottom) are projected on the section parallel to N-S direction.
関東・東海地域における最近20年間の地震観測結果(発震機構解)―松村ほか
− 31 −
F
2 (8/44) 経線に沿う南北断面図.P軸(上図),T軸(下図)を断面図上への投影長に比例した相対長で描い ている.
Fig. 2 (8/44) Cross-sectional projection of focal mechanism solutions. P-axes (top) and T-axes (bottom) are projected on the section parallel to N-S direction.
防災科学技術研究所研究資料 第224号 2002年3月
− 32 −
G
2 (9/44) 経線に沿う南北断面図.P軸(上図),T軸(下図)を断面図上への投影長に比例した相対長で描い ている.
Fig. 2 (9/44) Cross-sectional projection of focal mechanism solutions. P-axes (top) and T-axes (bottom) are projected on the section parallel to N-S direction.
関東・東海地域における最近20年間の地震観測結果(発震機構解)―松村ほか
− 33 −
H
2 (10/44) 経線に沿う南北断面図.P軸(上図),T軸(下図)を断面図上への投影長に比例した相対長で描い ている.
Fig. 2 (10/44) Cross-sectional projection of focal mechanism solutions. P-axes (top) and T-axes (bottom) are projected on the section parallel to N-S direction.
防災科学技術研究所研究資料 第224号 2002年3月
− 34 −
I
2 (11/44) 経線に沿う南北断面図.P軸(上図),T軸(下図)を断面図上への投影長に比例した相対長で描い ている.
Fig. 2 (11/44) Cross-sectional projection of focal mechanism solutions. P-axes (top) and T-axes (bottom) are projected on the section parallel to N-S direction.
関東・東海地域における最近20年間の地震観測結果(発震機構解)―松村ほか
− 35 −
J
2 (12/44) 経線に沿う南北断面図.P軸(上図),T軸(下図)を断面図上への投影長に比例した相対長で描い ている.
Fig. 2 (12/44) Cross-sectional projection of focal mechanism solutions. P-axes (top) and T-axes (bottom) are projected on the section parallel to N-S direction.
防災科学技術研究所研究資料 第224号 2002年3月
− 36 −
K
2 (13/44) 経線に沿う南北断面図.P軸(上図),T軸(下図)を断面図上への投影長に比例した相対長で描い ている.
Fig. 2 (13/44) Cross-sectional projection of focal mechanism solutions. P-axes (top) and T-axes (bottom) are projected on the section parallel to N-S direction.
関東・東海地域における最近20年間の地震観測結果(発震機構解)―松村ほか
− 37 −
L
2 (14/44) 経線に沿う南北断面図.P軸(上図),T軸(下図)を断面図上への投影長に比例した相対長で描い ている.
Fig. 2 (14/44) Cross-sectional projection of focal mechanism solutions. P-axes (top) and T-axes (bottom) are projected on the section parallel to N-S direction.
防災科学技術研究所研究資料 第224号 2002年3月
− 38 −
M
2 (15/44) 経線に沿う南北断面図.P軸(上図),T軸(下図)を断面図上への投影長に比例した相対長で描い ている.
Fig. 2 (15/44) Cross-sectional projection of focal mechanism solutions. P-axes (top) and T-axes (bottom) are projected on the section parallel to N-S direction.
関東・東海地域における最近20年間の地震観測結果(発震機構解)―松村ほか
− 39 −
N
2 (16/44) 経線に沿う南北断面図.P軸(上図),T軸(下図)を断面図上への投影長に比例した相対長で描い ている.
Fig. 2 (16/44) Cross-sectional projection of focal mechanism solutions. P-axes (top) and T-axes (bottom) are projected on the section parallel to N-S direction.
防災科学技術研究所研究資料 第224号 2002年3月
− 40 −
O
2 (17/44) 経線に沿う南北断面図.P軸(上図),T軸(下図)を断面図上への投影長に比例した相対長で描い ている.
Fig. 2 (17/44) Cross-sectional projection of focal mechanism solutions. P-axes (top) and T-axes (bottom) are projected on the section parallel to N-S direction.
関東・東海地域における最近20年間の地震観測結果(発震機構解)―松村ほか
− 41 −
P
2 (18/44) 経線に沿う南北断面図.P軸(上図),T軸(下図)を断面図上への投影長に比例した相対長で描い ている.
Fig. 2 (18/44) Cross-sectional projection of focal mechanism solutions. P-axes (top) and T-axes (bottom) are projected on the section parallel to N-S direction.
防災科学技術研究所研究資料 第224号 2002年3月
− 42 −
Q
2 (19/44) 経線に沿う南北断面図.P軸(上図),T軸(下図)を断面図上への投影長に比例した相対長で描い ている.
Fig. 2 (19/44) Cross-sectional projection of focal mechanism solutions. P-axes (top) and T-axes (bottom) are projected on the section parallel to N-S direction.
関東・東海地域における最近20年間の地震観測結果(発震機構解)―松村ほか
− 43 −
R
2 (20/44) 経線に沿う南北断面図.P軸(上図),T軸(下図)を断面図上への投影長に比例した相対長で描い ている.
Fig. 2 (20/44) Cross-sectional projection of focal mechanism solutions. P-axes (top) and T-axes (bottom) are projected on the section parallel to N-S direction.
防災科学技術研究所研究資料 第224号 2002年3月
− 44 −
S
2 (21/44) 経線に沿う南北断面図.P軸(上図),T軸(下図)を断面図上への投影長に比例した相対長で描い ている.
Fig. 2 (21/44) Cross-sectional projection of focal mechanism solutions. P-axes (top) and T-axes (bottom) are projected on the section parallel to N-S direction.
関東・東海地域における最近20年間の地震観測結果(発震機構解)―松村ほか
− 45 −
T
2 (22/44) 経線に沿う南北断面図.P軸(上図),T軸(下図)を断面図上への投影長に比例した相対長で描い ている.
Fig. 2 (22/44) Cross-sectional projection of focal mechanism solutions. P-axes (top) and T-axes (bottom) are projected on the section parallel to N-S direction.
防災科学技術研究所研究資料 第224号 2002年3月
− 46 −
U
2 (23/44) 経線に沿う南北断面図.P軸(上図),T軸(下図)を断面図上への投影長に比例した相対長で描い ている.
Fig. 2 (23/44) Cross-sectional projection of focal mechanism solutions. P-axes (top) and T-axes (bottom) are projected on the section parallel to N-S direction.
関東・東海地域における最近20年間の地震観測結果(発震機構解)―松村ほか
− 47 −
V
2 (24/44) 経線に沿う南北断面図.P軸(上図),T軸(下図)を断面図上への投影長に比例した相対長で描い ている.
Fig. 2 (24/44) Cross-sectional projection of focal mechanism solutions. P-axes (top) and T-axes (bottom) are projected on the section parallel to N-S direction.
防災科学技術研究所研究資料 第224号 2002年3月
− 48 −
W
2 (25/44) 経線に沿う南北断面図.P軸(上図),T軸(下図)を断面図上への投影長に比例した相対長で描い ている.
Fig. 2 (25/44) Cross-sectional projection of focal mechanism solutions. P-axes (top) and T-axes (bottom) are projected on the section parallel to N-S direction.
関東・東海地域における最近20年間の地震観測結果(発震機構解)―松村ほか
− 49 −
X
2 (26/44) 緯線に沿う東西断面図.P軸(上図),T軸(下図)を断面図上への投影長に比例した相対長で描い ている.
Fig. 2 (26/44) Cross-sectional projection of focal mechanism solutions. P-axes (top) and T-axes (bottom) are projected on the section parallel to E-W direction.
防災科学技術研究所研究資料 第224号 2002年3月
− 50 −
a
2 (27/44) 緯線に沿う東西断面図.P軸(上図),T軸(下図)を断面図上への投影長に比例した相対長で描い ている.
Fig. 2 (27/44) Cross-sectional projection of focal mechanism solutions. P-axes (top) and T-axes (bottom) are projected on the section parallel to E-W direction.
関東・東海地域における最近20年間の地震観測結果(発震機構解)―松村ほか
− 51 −
b
2 (28/44) 緯線に沿う東西断面図.P軸(上図),T軸(下図)を断面図上への投影長に比例した相対長で描い ている.
Fig. 2 (28/44) Cross-sectional projection of focal mechanism solutions. P-axes (top) and T-axes (bottom) are projected on the section parallel to E-W direction.
防災科学技術研究所研究資料 第224号 2002年3月
− 52 −
c
2 (29/44) 緯線に沿う東西断面図.P軸(上図),T軸(下図)を断面図上への投影長に比例した相対長で描い ている.
Fig. 2 (29/44) Cross-sectional projection of focal mechanism solutions. P-axes (top) and T-axes (bottom) are projected on the section parallel to E-W direction.
関東・東海地域における最近20年間の地震観測結果(発震機構解)―松村ほか
− 53 −
d
2 (30/44) 緯線に沿う東西断面図.P軸(上図),T軸(下図)を断面図上への投影長に比例した相対長で描い ている.
Fig. 2 (30/44) Cross-sectional projection of focal mechanism solutions. P-axes (top) and T-axes (bottom) are projected on the section parallel to E-W direction.
防災科学技術研究所研究資料 第224号 2002年3月
− 54 −
e
2 (31/44) 緯線に沿う東西断面図.P軸(上図),T軸(下図)を断面図上への投影長に比例した相対長で描い ている.
Fig. 2 (31/44) Cross-sectional projection of focal mechanism solutions. P-axes (top) and T-axes (bottom) are projected on the section parallel to E-W direction.
関東・東海地域における最近20年間の地震観測結果(発震機構解)―松村ほか
− 55 −
f
2 (32/44) 緯線に沿う東西断面図.P軸(上図),T軸(下図)を断面図上への投影長に比例した相対長で描い ている.
Fig. 2 (32/44) Cross-sectional projection of focal mechanism solutions. P-axes (top) and T-axes (bottom) are projected on the section parallel to E-W direction.
防災科学技術研究所研究資料 第224号 2002年3月
− 56 −
g
2 (33/44) 緯線に沿う東西断面図.P軸(上図),T軸(下図)を断面図上への投影長に比例した相対長で描い ている.
Fig. 2 (33/44) Cross-sectional projection of focal mechanism solutions. P-axes (top) and T-axes (bottom) are projected on the section parallel to E-W direction.
関東・東海地域における最近20年間の地震観測結果(発震機構解)―松村ほか
− 57 −
h
2 (34/44) 緯線に沿う東西断面図.P軸(上図),T軸(下図)を断面図上への投影長に比例した相対長で描い ている.
Fig. 2 (34/44) Cross-sectional projection of focal mechanism solutions. P-axes (top) and T-axes (bottom) are projected on the section parallel to E-W direction.
防災科学技術研究所研究資料 第224号 2002年3月
− 58 −
i
2 (35/44) 緯線に沿う東西断面図.P軸(上図),T軸(下図)を断面図上への投影長に比例した相対長で描い ている.
Fig. 2 (35/44) Cross-sectional projection of focal mechanism solutions. P-axes (top) and T-axes (bottom) are projected on the section parallel to E-W direction.
関東・東海地域における最近20年間の地震観測結果(発震機構解)―松村ほか
− 59 −
j
2 (36/44) 緯線に沿う東西断面図.P軸(上図),T軸(下図)を断面図上への投影長に比例した相対長で描い ている.
Fig. 2 (36/44) Cross-sectional projection of focal mechanism solutions. P-axes (top) and T-axes (bottom) are projected on the section parallel to E-W direction.
防災科学技術研究所研究資料 第224号 2002年3月
− 60 −
k
2 (37/44) 緯線に沿う東西断面図.P軸(上図),T軸(下図)を断面図上への投影長に比例した相対長で描い ている.
Fig. 2 (37/44) Cross-sectional projection of focal mechanism solutions. P-axes (top) and T-axes (bottom) are projected on the section parallel to E-W direction.
関東・東海地域における最近20年間の地震観測結果(発震機構解)―松村ほか
− 61 −
l
2 (38/44) 緯線に沿う東西断面図.P軸(上図),T軸(下図)を断面図上への投影長に比例した相対長で描い ている.
Fig. 2 (38/44) Cross-sectional projection of focal mechanism solutions. P-axes (top) and T-axes (bottom) are projected on the section parallel to E-W direction.
防災科学技術研究所研究資料 第224号 2002年3月
− 62 −
m
2 (39/44) 緯線に沿う東西断面図.P軸(上図),T軸(下図)を断面図上への投影長に比例した相対長で描い ている.
Fig. 2 (39/44) Cross-sectional projection of focal mechanism solutions. P-axes (top) and T-axes (bottom) are projected on the section parallel to E-W direction.
関東・東海地域における最近20年間の地震観測結果(発震機構解)―松村ほか
− 63 −
n
2 (40/44) 緯線に沿う東西断面図.P軸(上図),T軸(下図)を断面図上への投影長に比例した相対長で描い ている.
Fig. 2 (40/44) Cross-sectional projection of focal mechanism solutions. P-axes (top) and T-axes (bottom) are projected on the section parallel to E-W direction.
防災科学技術研究所研究資料 第224号 2002年3月
− 64 −
o
2 (41/44) 緯線に沿う東西断面図.P軸(上図),T軸(下図)を断面図上への投影長に比例した相対長で描い ている.
Fig. 2 (41/44) Cross-sectional projection of focal mechanism solutions. P-axes (top) and T-axes (bottom) are projected on the section parallel to E-W direction.
関東・東海地域における最近20年間の地震観測結果(発震機構解)―松村ほか
− 65 −
p
2 (42/44) 緯線に沿う東西断面図.P軸(上図),T軸(下図)を断面図上への投影長に比例した相対長で描い ている.
Fig. 2 (42/44) Cross-sectional projection of focal mechanism solutions. P-axes (top) and T-axes (bottom) are projected on the section parallel to E-W direction.
防災科学技術研究所研究資料 第224号 2002年3月
− 66 −
q
2 (43/44) 緯線に沿う東西断面図.P軸(上図),T軸(下図)を断面図上への投影長に比例した相対長で描い ている.
Fig. 2 (43/44) Cross-sectional projection of focal mechanism solutions. P-axes (top) and T-axes (bottom) are projected on the section parallel to E-W direction.
関東・東海地域における最近20年間の地震観測結果(発震機構解)―松村ほか
− 67 −
r
2 (44/44) 緯線に沿う東西断面図.P軸(上図),T軸(下図)を断面図上への投影長に比例した相対長で描い ている.
Fig. 2 (44/44) Cross-sectional projection of focal mechanism solutions. P-axes (top) and T-axes (bottom) are projected on the section parallel to E-W direction.
防災科学技術研究所研究資料 第224号 2002年3月
− 68 −
s
3 (1/16) 深さ別に切り出した平面図.P軸(上図),T軸(下図)を平面図上への投影長に比例した相対 長で描いている.
Fig. 3 (1/16) Horizontal projection of focal mechanism solutions. P-axes (top) and T-axes (bottom) are projected on each plane sliced in depth range.
関東・東海地域における最近20年間の地震観測結果(発震機構解)―松村ほか
− 69 −
3 (2/16) 深さ別に切り出した平面図.P軸(上図),T軸(下図)を平面図上への投影長に比例した相対 長で描いている.
Fig. 3 (2/16) Horizontal projection of focal mechanism solutions. P-axes (top) and T-axes (bottom) are projected on each plane sliced in depth range.
防災科学技術研究所研究資料 第224号 2002年3月
− 70 −
3 (3/16) 深さ別に切り出した平面図.P軸(上図),T軸(下図)を平面図上への投影長に比例した相対 長で描いている.
Fig. 3 (3/16) Horizontal projection of focal mechanism solutions. P-axes (top) and T-axes (bottom) are projected on each plane sliced in depth range.
関東・東海地域における最近20年間の地震観測結果(発震機構解)―松村ほか
− 71 −
3 (4/16) 深さ別に切り出した平面図.P軸(上図),T軸(下図)を平面図上への投影長に比例した相対 長で描いている.
Fig. 3 (4/16) Horizontal projection of focal mechanism solutions. P-axes (top) and T-axes (bottom) are projected on each plane sliced in depth range.
防災科学技術研究所研究資料 第224号 2002年3月
− 72 −
3 (5/16) 深さ別に切り出した平面図.P軸(上図),T軸(下図)を平面図上への投影長に比例した相対 長で描いている.
Fig. 3 (5/16) Horizontal projection of focal mechanism solutions. P-axes (top) and T-axes (bottom) are projected on each plane sliced in depth range.
関東・東海地域における最近20年間の地震観測結果(発震機構解)―松村ほか
− 73 −
3 (6/16) 深さ別に切り出した平面図.P軸(上図),T軸(下図)を平面図上への投影長に比例した相対 長で描いている.
Fig. 3 (6/16) Horizontal projection of focal mechanism solutions. P-axes (top) and T-axes (bottom) are projected on each plane sliced in depth range.
防災科学技術研究所研究資料 第224号 2002年3月
− 74 −
3 (7/16) 深さ別に切り出した平面図.P軸(上図),T軸(下図)を平面図上への投影長に比例した相対 長で描いている.
Fig. 3 (7/16) Horizontal projection of focal mechanism solutions. P-axes (top) and T-axes (bottom) are projected on each plane sliced in depth range.
関東・東海地域における最近20年間の地震観測結果(発震機構解)―松村ほか
− 75 −
3 (8/16) 深さ別に切り出した平面図.P軸(上図),T軸(下図)を平面図上への投影長に比例した相対 長で描いている.
Fig. 3 (8/16) Horizontal projection of focal mechanism solutions. P-axes (top) and T-axes (bottom) are projected on each plane sliced in depth range.
防災科学技術研究所研究資料 第224号 2002年3月
− 76 −
3 (9/16) 深さ別に切り出した平面図.P軸(上図),T軸(下図)を平面図上への投影長に比例した相対 長で描いている.
Fig. 3 (9/16) Horizontal projection of focal mechanism solutions. P-axes (top) and T-axes (bottom) are projected on each plane sliced in depth range.
関東・東海地域における最近20年間の地震観測結果(発震機構解)―松村ほか
− 77 −
3 (10/16) 深さ別に切り出した平面図.P軸(上図),T軸(下図)を平面図上への投影長に比例した相対 長で描いている.
Fig. 3 (10/16) Horizontal projection of focal mechanism solutions. P-axes (top) and T-axes (bottom) are projected on each plane sliced in depth range.
防災科学技術研究所研究資料 第224号 2002年3月
− 78 −
3 (11/16) 深さ別に切り出した平面図.P軸(上図),T軸(下図)を平面図上への投影長に比例した相対 長で描いている.
Fig. 3 (11/16) Horizontal projection of focal mechanism solutions. P-axes (top) and T-axes (bottom) are projected on each plane sliced in depth range.
関東・東海地域における最近20年間の地震観測結果(発震機構解)―松村ほか
− 79 −
3 (12/16) 深さ別に切り出した平面図.P軸(上図),T軸(下図)を平面図上への投影長に比例した相対 長で描いている.
Fig. 3 (12/16) Horizontal projection of focal mechanism solutions. P-axes (top) and T-axes (bottom) are projected on each plane sliced in depth range.
防災科学技術研究所研究資料 第224号 2002年3月
− 80 −