amplification
journal or
publication title
Food Chemistry
volume 252
page range 390‑396
year 2018‑06‑30
URL http://id.nii.ac.jp/1578/00002410/
doi: 10.1016/j.foodchem.2017.12.036
Creative Commons : 表示 ‑ 非営利 ‑ 改変禁止 http://creativecommons.org/licenses/by‑nc‑nd/3.0/deed.ja
Original Research Article
Title: Development and Evaluation of Rapid Screening Detection Methods for Genetically Modified Crops Using Loop-Mediated Isothermal Amplification
Reona Takabatakea, Yukari Kagiyab, Yasutaka Minegishic, Sabina Yeasmind, Satoshi Futob, Akio Noguchie, Kazunari Kondoe, Junichi Manoa, and Kazumi Kittaa,*
aAnalytical Science Division, Food Research Institute, National Agriculture and Food Research Organization: 2-1-12 Kannondai, Tsukuba, Ibaraki 305-8642, Japan
bFASMAC Co., Ltd.: 5-1-3 Midorigaoka, Atsugi, Kanagawa 243-0041, Japan
cNIPPON GENE Co., Ltd.: 1-8-7 Toiyamachi, Toyama, Toyama 930-0834, Japan
dUniversity of Dhaka, Dhaka-1000, Bangladesh
eNational Institute of Health Sciences: 1-18-1 Kamiyoga, Setagaya-ku, Tokyo 158-8501, Japan
*Corresponding author: Dr. Kazumi Kitta, Analytical Science Division, Food Research Institute, National Agriculture and Food Research Organization: 2-1-12 Kannondai, Tsukuba, Ibaraki 305-8642, Japan.
Email: [email protected]
No. of black and white figures: 1 No. of tables: 5
No. of supplementary materials: 3
ABSTRACT 1
2
We developed new loop-mediated isothermal amplification (LAMP)-based detection methods for the 3
screening of genetically modified (GM) maize and soybean events. The LAMP methods developed 4
targeted seven sequences: cauliflower mosaic virus 35S promoter; 5-enolpyruvylshikimate-3-phosphate 5
synthase gene from Agrobacterium tumefaciens strain CP4 (cp4epsps); phosphinothricin 6
acetyltransferase (pat) gene; mannose-6-phosphate isomerase gene; Pisum sativum ribulose 1, 7
5-bisphosphate carboxylase terminator; a common sequence between Cry1Ab and Cry1Ac genes; and a 8
GA21 construct-specific sequence. We designed new specific primer sets for each target, and the limit of 9
detection (LOD) was evaluated using authorized GM maize and soybean events. LODs for each target 10
were ≤ 0.5%. To make the DNA extraction process simple and rapid, we also developed a direct LAMP 11
detection scheme using crude cell lysates. The entire process, including pretreatments and detection, 12
could be completed within 1 hour.
13 14
Key words: Loop-mediated isothermal amplification (LAMP); Genetically modified (GM); Direct 15
LAMP; Rapid qualitative analysis 16
17 18 19 20 21 22 23
1. Introduction 24
25
The cultivation area of genetically modified (GM) crops continues to expand. The global area of GM 26
crops reached 179.7 million hectares in 2015, from 1.7 million hectares in 1996 (James, 2015). However, 27
some consumers still express concerns about the utilization of genetically modified organisms (GMs) in 28
food or feed and, in response, many countries and regions, including Japan, have legislated labeling 29
systems to indicate the presence of authorized GM crops.
30
The number of GM events is also increasing. As of November 2015, 26 GM crops and 363 GM events 31
had been approved for use as food or feed or for environmental release in 40 countries (James, 2015). In 32
Japan, 201 varieties of GM maize and 22 varieties of GM soybean have been authorized (MHLW, 2016).
33
To deal with the increased number of GM events, an efficient screening detection method for 34
comprehensive GMO inspection is required. Polymerase chain reaction (PCR) is a reliable, robust, and 35
sensitive technique that has been used in many countries as a gold standard for GMO detection 36
(Holst-Jensen, Ronning, Lovseth, & Berdal, 2003; http://gmo-crl.jrc.ec.europa.eu/StatusOfDossiers.aspx;
37
ISO21570:2005; ISO21571:2005; Kuribara et al., 2002; Notification 201, 2012). However, PCR takes a 38
relatively long time, and requires expensive instruments and reagents. In contrast, loop-mediated 39
isothermal amplification (LAMP) is a rapid, inexpensive and highly specific isothermal DNA 40
amplification technique that uses DNA polymerase with high strand displacement activity (Notomi et al., 41
2000). Several techniques have been developed to detect LAMP products. Pyrophosphate ions, which are 42
a by-product of DNA amplification, yield a white magnesium pyrophosphate precipitate in the reaction 43
mixture, the turbidity of which can be used for detection (Tomita, Mori, Kanda, & Notomi, 2008).
44
Alternatively, to visualize the presence of LAMP products, dyes such as calcein, hydroxynaphtol blue, 45
and SYBR Green I have been employed (Goto, Honda, Ogura, Nomoto, & Hanaki, 2009).
46
Electrochemical detection by current response, using redox molecules, has also been developed for 47
LAMP product detection (Ahmed, Hasan, Hossain, Saito, & Tamiya, 2010; Safavieh et al., 2016).
48
LAMP techniques have also been adapted for GMO detection. As in other uses of LAMP for DNA 49
amplification, detection is based on either turbidity (Fukuta et al., 2004; Huang, Chen, Xu, Ji, Zhu, &
50
Chen, 2014), or SYBR Green I mediated fluorescence (Chen et al., 2012; Huang, et al., 2014; Randhawa, 51
Singh, Morisset, Sood, & Zel, 2013; Wang et al., 2015; Zhang et al., 2013). In addition, Kiddle et al.
52
(2012) reported a detection method using a bioluminescent real-time reporter coupled with LAMP 53
amplification. These methods better PCR-based approaches in terms of their simplicity, but they do not 54
permit discernment between specific and non-specific amplification products.
55
To overcome these drawbacks, we have developed a novel screening method using a real-time 56
fluorometer, Genie II (OptiGene, UK), that permits the rapid and robust detection of LAMP products.
57
With the Genie II system, annealing curve analysis can be performed to confirm the presence of specific 58
LAMP products because the annealing temperature is unique to the amplified sequence. Moreover, the 59
developed method covers almost all approved GM maize and soybean events in Japan, and uses common 60
segments that have been introduced into many GM events, such as sequences derived from the 35S 61
promoter of cauliflower mosaic virus (P35S), mannose-6-phosphate isomerase (pmi) gene, and Pisum 62
sativum ribulose 1, 5-bisphosphate carboxylase terminator, referred to as the E9 terminator (tE9) by 63
Coruzzi et al. (1984). Despite this universality, the method is highly specific and sensitive. Also, our 64
newly-designed primer set, targeting P35S, is more sensitive than the previously reported primer sets.
65
Finally, to reduce the sample preparation time, we developed a direct LAMP amplification scheme using 66
crude extracts derived directly from ground seed samples, instead of purified DNA. From a practical point 67
of view, our methods are expected to provide significant value for GMO testing.
68 69
2. Materials and Methods 70
71
2.1. Plant materials 72
The GM soybean and maize seeds, MON810, MON863, MON88017, MON87460, MON89034, 73
NK603, MON89788, MON87701, MON87705, MON87769 and 40-3-2 (RRS), were kindly provided by 74
Monsanto Co. (St. Louis, MO, USA). The maize seeds, 3272, Bt11, Event176, GA21, MIR162, and 75
MIR604, were kindly provided by Syngenta Seeds AG (Basel, Switzerland). The maize seeds, TC1507 76
and DAS59122, were kindly provided by Pioneer Hi-Bred International (Johnston, IA). The soybean seed 77
A2704-12 was kindly provided by its developer, and the maize seed T25 was directly imported from the 78
USA. QC9651 maize, from Quality Technology International (Elgin, IL), was used as a non-GM maize.
79
Seeds for wheat, barley, Lotus japonicus, alfalfa, buck wheat, sorghum, rye, and oat were kindly provided 80
by the NARO Genebank Project (Ibaraki, Japan).
81 82
2.2. DNA extraction 83
Maize and soybean genomic DNA were extracted using a DNeasy Plant Maxi kit (Maxi kit) (Qiagen, 84
Hilden, Germany) according to the protocol provided in the JAS analytical test handbook 85
(http://www.famic.go.jp/technical_information/jashandbook/gmo/manual_3.pdf). The concentration and 86
quality of the extracted DNA were evaluated by ultraviolet (UV) absorbance using an ND-1000 87
spectrophotometer (NanoDrop Technologies, Wilmington, DE). The concentration of genomic DNA was 88
adjusted to 50 ng/μL, and 100 ng was used as the template for LAMP analyses.
89
For the evaluation of specificity, genomic DNA from other plants was also extracted, as described.
90 91
2.3. The design of the LAMP primers 92
The primers used in this study are listed in Table 1. For the detection of each target sequence, a set of 93
six primers consisting of two outer primers (F3 and B3), two inner primers (FIP and BIP), and two loop 94
primers (LoopF and LoopB) was used. We designed the primer set for each segment using LAMP 95
Designer 1.13 (PREMIER Biosoft, Palo Alto, CA). The oligonucleotide primers were synthesized by 96
FASMAC (Kanagawa, Japan). We used starch synthase IIb (SSIIb) and lectin1 (Le1) genes, as 97
maize-specific and soybean-specific endogenous sequences, respectively.
98 99
2.4. Sample preparation 100
To evaluate the limit of detection (LOD), mixed DNA samples, which are easy to prepare, were used.
101
Genomic DNAs were extracted from each GM maize and soybean event and the non-GM maize and 102
soybeans, and adjusted to 50 ng/μL. GM and non-GM DNAs were mixed by volume ratios to create 103
samples containing GM maize at 0%, 0.1%, 0.3%, and 0.5% and GM soybean at 0%, 0.05%, 0.1%, and 104
0.5%.
105
For the direct LAMP analyses, we used weight-based mixed samples. The weight-based mixed samples 106
are listed in Table S1 in the Supplementary material. We used the following GM maize samples: ① 107
0.5% of MON810 and 0.5% of GA21, ② 0.4% of Bt11 and 0.2% of GA21, and ③ 0.5% of MIR604.
108
We also used a GM soybean sample containing ④ 0.5% of RRS, 0.5% of A2704-12, and 0.5% of 109
MON89788. All four were prepared as described previously (Mano et al., 2012a; Takabatake et al., 2011, 110
2013a, b). We also prepared the following: ⑤ 0.5% of MON88017, and ⑥ 0.5% of RRS and 0.5% of 111
MON87701. To prepare these samples, we ground GM and non-GM seeds separately, and mixed them on 112
a weight-basis, then confirmed the homogeneities, as described previously (Takabatake et al., 2011).
113 114
2.5. LAMP assay 115
LAMP reactions were performed with Genie II (OptiGene Ltd., Horsham, UK). The reactions were 116
conducted in a 25-μL volume using 2.0 μL of template DNA, 15 μL of isothermal master mix (OptiGene), 117
10 mM Tris-KCl (pH 8.0), 1 mM DTT, and primers at the final concentrations of 0.02 μM for F3 and B3, 118
0.16 μM for FIP and BIP, and 0.08 μM for LoopF and LoopB. For the detection of P35S, a concentration 119
of 0.32 μM rather than 0.16μM was used for FIP and BIP. The amplification conditions were as follows:
120
amplification at 65°C for 30 min, followed by annealing from 98°C to 80°C with a ramp rate of 0.05°C 121
/sec. The LAMP assay was repeated 21 times for each target and each sample, and a no-template control 122
assay was also performed for all the primer sets.
123 124
2.6. Direct LAMP detection 125
We used GenCheck® DNA Extraction Reagent (FASMAC), which was originally developed for direct 126
PCR analyses (http://www.fasmac.co.jp/GM/kit/DER.html), for the sample-direct LAMP analyses. For 127
sample preparation, 400 µl of lysis buffer was added to 40 mg and 20 mg of ground maize and soybeans 128
samples, which were heated for 10 min at 100°C and then chilled on ice. The samples were centrifuged at 129
15,000 × g for 5 min, and the resulting supernatants were used directly as templates for LAMP analyses.
130 131
3. Results 132
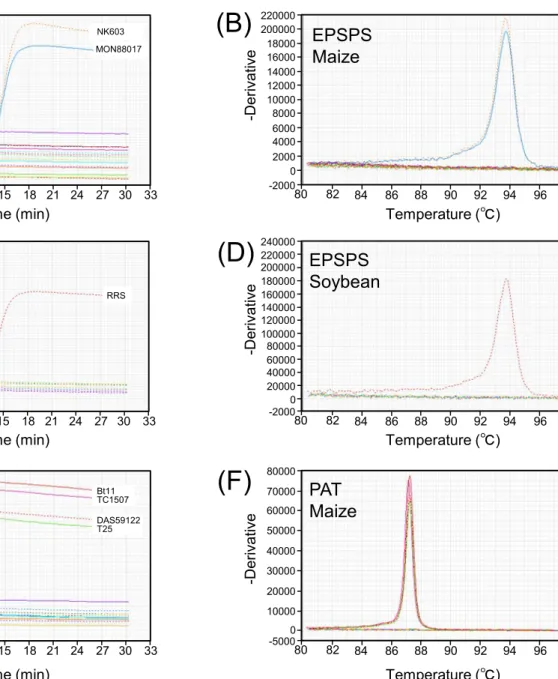
133
3.1. Specificity evaluation of the primer sets for each target 134
LAMP amplification was detected as fluorescence intensity with the isothermal Genie II system. Genie 135
II is a compact, portable instrument that is suitable for real-time fluorescence detection and annealing 136
analyses for LAMP products. First, we checked the specificity of the primer sets and the results are 137
summarized in Table 2. Seven targets for LAMP assays were newly designed: (1) cauliflower mosaic 138
virus 35S promoter (P35S), (2) cp4epsps gene (EPSPS), (3) pat gene (PAT), (4) mannose-6-phosphate 139
isomerase gene (pmi), (5) Pisum sativum ribulose 1, 5-bisphosphate carboxylase E9 terminator (tE9), (6) 140
a common sequence between Cry1Ab and Cry1Ac genes (Cry1Ab/Cry1Ac), and (7) a GA21 construct 141
specific sequence (GA21). The amplifications were observed from only GM events that contained each 142
target: Fig. 1A, C, E, G, and Fig. S1A, C, E, G, I, K, M. In each, only a single peak was detected, and no 143
unexpected amplification was observed from the no-template control, non-GM maize or soybean, or 144
from other GM events that did not include target segments. We also designed LAMP target sequences 145
for the SSIIb and Le1 genes, as maize- and soybean-specific sequences, because species-specific 146
endogenous sequences are generally needed, as internal positive controls, for the development of 147
detection methods for both authorized and unauthorized GM crops. To evaluate the specificity, we 148
prepared genomic DNAs from other plants including rice, wheat, barley, Lotus japonicus, alfalfa, buck 149
wheat, sorghum, rye, and oat. The LAMP amplifications of SSIIb and Le1 were only observed in maize 150
and soybean genomic DNAs, respectively, and there were no non-specific amplifications with other 151
plants (Fig. 1I and J). These data confirmed that the LAMP assays developed were highly specific for 152
the target sequences (Table 2).
153 154
3.2. LOD evaluation of the primer sets for each target 155
To evaluate the limit of detection (LOD) of the newly developed methods, we used mixed DNA 156
samples prepared from genomic DNA from individual GM events and non-GM maize or soybeans. For 157
the qualitative analyses, we set the criterion for LOD determination as being positive ≥ 20 times in 21 158
analyses, meaning the false-negative rate had to be ≤ 5%, as described previously (Mano et al., 2009, 159
2012b). This conforms with the criterion for collaborative study in ISO24276. The LODs determined for 160
each target and each GM event are listed in Table 3. All the LODs were ≤ 0.5% for both GM maize and 161
soybean events. Notably, the LODs for GM soybeans were ≤ 0.1%, except for MON87705 and 162
MON87769 targeting tE9.
163
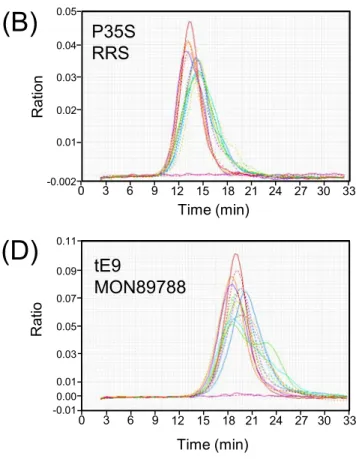
The detection time was defined as the point at which the second derivative of an amplification curve 164
peaked: examples are shown in Fig. S2. For each, the signal started to appear at approximately 10-15 min 165
and detection times were within 25 min (Table 3). After amplification, we analyzed the LAMP products 166
using annealing curve analyses. Since the annealing temperature is unique to the amplified sequence, 167
annealing curve analysis can confirm the specificity of LAMP products. Single peaks were detected in 168
each target (Fig. 1B, D, F, H, and Fig. S1B, D, F, H, J, L, N). The values for each target were very close in 169
both maize and soybean, which clearly indicated that the amplifications were specific.
170
Several sequences targeting common GM segments, such as P35S and NOS terminator (TNOS), have 171
been applied previously in LAMP analyses (Fukuta et al., 2004; Kiddle et al., 2012; Randhawa et al., 172
2013; Wang et al., 2015; Zhang et al., 2013). Using our LAMP system, we compared the sensitivity of our 173
newly-designed primer set for LAMP amplification, using Genie II targeting P35S, to those of three 174
primer sets previously reported for LAMP amplification targeting P35S (Table 4). Primer sets for LAMP 175
amplification targeting P35S in Zhang et al. (2013), Randhawa et al. (2013), and Wang et al. (2015) were 176
named P35S-1, P35S-2, and P35S-3, respectively. As shown in Table 3, when using our primer set for 177
P35S, the LODs for MON810 and RRS were 0.3% and 0.05%, respectively. The positive rates for all 178
three previous sets, P35S-1, P35S-2 and P35S-3, were not acceptable, even at 0.5% of MON810 or 0.1%
179
of RRS (Table 4). These results suggest that our primer set was more sensitive than the previously 180
reported primer sets, at least when used with the Genie II detection system.
181 182
3.3. Direct LAMP detection 183
To shorten sample preparation time, we developed a direct LAMP detection scheme using crude cell 184
lysates prepared directly from ground maize or soybean seed samples without any DNA extraction or 185
purification steps. We used the GenCheck® DNA Extraction Reagent (GenCheck reagent) for direct 186
LAMP detection analyses, which was, originally developed for PCR amplifications from blood, animal 187
cells, plant cells, microorganisms, and food samples. In our direct LAMP detection scheme, sample 188
preparation procedures took less than 20 min and included very few steps, mainly heat treatment and 189
centrifugation. We tested the applicability of the GenCheck reagent to LAMP analysis. Six distinct GM 190
mixed samples were used in our evaluation (Table S1). 0.5% of MON810, 0.5% of MON88017, 0.4% of 191
Bt11, 0.5% of MIR604, 0.4% of Bt11, and 0.5% of GA21 were used for detection of P35S, EPSPS, PAT, 192
pmi, Cry1Ab/Cry1Ac and GA21. 0.5% of RRS, 0.5% of RRS, 0.5% of A2704-12, 0.5% of MON89788, 193
and 0.5% of MON87701 were used for detection of P35S, EPSPS, PAT, tE9, and Cry1Ab/Cry1Ac. The 194
results are summarized in Table 5. Twenty-milligram samples were sufficient for the GM soybean 195
analyses. On the other hand, for the GM maize events, when 20-mg samples were used, positive detection 196
rates were not acceptable (< 95%) at 0.5% of MON810 and MIR604 (Table 5). The sensitivities were 197
improved using 40-mg samples, meaning 40 mg was sufficient for GM maize analyses. These targets 198
could be detected within 25 min at concentrations near the LOD. The entire detection process, including 199
sample preparation and LAMP detection, was completed within one hour.
200 201
4. Discussion 202
The commercialization of GM crops has brought huge economic benefit, but concerns about the new 203
technology have arisen among consumers, leading to the introduction of GMO labeling systems in many 204
countries. Our research group has developed several real-time PCR-based screening detection methods 205
(Oguchi et al., 2009; Takabatake et al., 2013a), but in recent years, the number of varieties of GM maize 206
and soybean events have increased. Thus, it has become difficult to find common sequences that cover 207
many events and allow development of efficient PCR-mediated screening detection methods.
208
To resolve these problems, additional time- and cost-effective technologies are needed. LAMP is one 209
such relatively new DNA amplification technique and, under certain circumstances, is simpler, quicker, 210
and costs less than PCR. In fact, LAMP has the potential to replace PCR as an initial screening for 211
comprehensive GMO detection.
212
In this study, we developed screening methods for GM maize and GM soybeans using a LAMP assay 213
targeting seven sequences, namely P35S, EPSPS, PAT, pmi, tE9, Cry1Ab/Cry1Ac, and GA21. To detect 214
LAMP products, we used a Genie II system that can confirm specific amplifications through annealing 215
curve analyses. Genie II and the reagents for Genie II are also reasonably priced compared to other DNA 216
detection systems, such as real-time PCR. Results from this study demonstrate that our newly-developed 217
methods are rapid and cost-effective, and the LODs equal to or less than 0.5%. Thus, the LODs were 218
equivalent to or better than those reported previously for PCR-based qualitative screening methods 219
(Kodama et al., 2011; Takabatake et al., 2013). We also developed a direct LAMP amplification scheme, 220
using crude extracts derived from ground seed samples. In terms of just the basic sample-preparation 221
procedures, DNA extraction and purification usually take about 60 min or more. In our direct LAMP 222
detection scheme, however, sample preparation required less than 20 min, and the entire detection process, 223
including sample preparation and LAMP detection, was completed within one hour. Therefore, we 224
conclude that our new methods are applicable for the detection of GM crops to monitor the validity of 225
food labels in many countries.
226 227
Acknowledgements 228
We thank the Genetic Resources Center, National Agriculture and Food Research Organization (NARO).
229
The biological genetic resources, JP16471, JP21313, JP31147, JP31346, JP38350, JP51518, JP77857, 230
JP79656, JP209867 and JP212442, were distributed from the NARO Genebank Project.
231
This work was supported by a grant from the Ministry of Agriculture, Forestry and Fisheries of Japan 232
(Research project for Genomics-based Technology for Agricultural Improvement GRA201-1).
233 234
References 235
236
Ahmed, M. U., Hasan, Q., Hossain, M. M., Saito, M., & Tamiya, E. (2010). Most species identification 237
based on the loop mediated isothermal amplification and electrochemical DNA sensor. Food control, 238
21, 599-605.
239
Chen, X., Wang, X., Jin, N., Zhou, Y, Huang, S., Miao, Q., Zhu, Q., & Xu, J. (2012). Endpoint visual 240
detection of three genetically modified rice events by loop-mediated isothermal amplification.
241
International Journal of Molecular Sciences, 13, 14421-14433.
242
Coruzzi, G., Broglie, R., Edwards, C., & Chua, N. H. (1984). Tissue-specific and light-regulated 243
expression of a pea nuclear gene encoding the small subunit of ribulose-1,5-bisphosphate carboxylase.
244
The EMBO Journal, 3, 1671-1679.
245
Fukuta, S., Mizukami, Y., Ishida, A., Ueda, J., Hasegawa, M., Hayashi, I., Hashimoto, M., & Kanbe, M.
246
(2004). Real-time loop-mediated isothermal amplification for the CaMV-35S promoter as a screening 247
method for genetically modified organisms. European Food Research and Technology, 218, 496-500.
248
Goto, M., Honda, E., Ogura, A., Nomoto, A., & Hanaki, K. (2009). Colorimetric detection of 249
loop-mediated isothermal amplification reaction by using hydroxyl naphthol blue. BioTechniques, 46, 250
167-172.
251
Holst-Jensen, A., Ronning, S. B., Lovseth, A., & Berdal, K. G. (2003). PCR technology for screening and 252
quantification of genetically modified organisms (GMOs). Analytical and Bioanalytical Chemistry, 375, 253
985-993.
254
Huang, X., Chen, L., Xu, J., Ji, H. F., Zhu, S., & Chen, H. (2014). Rapid visual detection of phytase gene 255
in genetically modified maize using loop-mediated isothermal amplification method. Food Chemistry, 256
156, 184-189.
257
ISO24276:2006. Foodstuffs
—
Methods of analysis for the detection of genetically modified organisms 258and derived products
—
General requirements and definitions.259
ISO21570:2005. Foodstuffs
—
Methods of analysis for the detection of genetically modified organisms 260and derived products
—
Quantitative nucleic acid based methods.261
ISO21571:2005. Foodstuffs
—
Methods of analysis for the detection of genetically modified organisms 262and derived products
—
Nucleic acid extraction.263
James, C. (2015). Global status of commercialized biotech/GM crops. ISAAA Brief, 51, 2015.
264
Kiddle, G., Hardinge, P., Buttigieg, N., Gandelman O., Pereira, C., McElgunn, C. J., Rizzoli, M., Jackson, 265
R., Appleton, N., Moore, C., Tisi, L. C., & Murray, J. A. H. (2012). GMO detection using a 266
bioluminescent real time reporter (BART) of loop mediated isothermal amplification (LAMP) suitable 267
for field use. BMC Biotechnology, 12:15. doi: 10.1186/1472-6750-12-15.
268
Kodama, T., Kasahara, M., Minegishi, Y., Futo, S., Sawada, C., Watai, M., Akiyama, H., Teshima, R., 269
Kurosawa, Y., Furui, S., Hino, A., & Kitta, K. (2011). Qualitative PCR method for Roundup Ready 270
soybean: interlaboratory study. Journal of AOAC International, 94, 224-231.
271
Kuribara, H., Shindo, Y., Matsuoka, T., Takubo, K., Futo, S., Aoki, N., Hirao, T., Akiyama, H., Goda, Y., 272
Toyoda, M., & Hino, A. (2002). Novel reference molecules for quantification of genetically modified 273
maize and soybean. Journal of AOAC International, 85, 1077-1089.
274
Mano, J., Shigemitsu, N., Futo, S., Akiyama, H., Teshima, R., Hino, A., Furui, S., & Kitta, K. (2009).
275
Simultaneous detection of recombinant DNA segments introduced into genetically modified crops with 276
multiplex ligase chain reaction coupled with multiplex polymerase chain reaction. Journal Agriculture 277
and Food Chemistry, 57, 26-37.
278
Mano, J., Furui, S., Takashima, K., Koiwa, T., Futo, S., Minegishi, Y., Akiyama, H., Teshima, R., 279
Kurashima, T., Takabatake, R., & Kitta, K. (2012a). Development and validation of event-specific 280
quantitative PCR method for genetically modified maize MIR604. Food Hygiene and Safety Sciencey, 281
53, 166-171.
282
Mano, J., Harada, M., Takabatake, R., Furui, S., Kitta, K., Nakamura, K., Akiyama, H., Teshima, R., 283
Noritake, H., Hatano, S., Futo, S., Minegishi, Y., & Iizuka, T. (2012b). Comprehensive GMO detection 284
using real-time PCR array: single-laboratory validation. Journal of AOAC International, 95, 508-516.
285
MHLW. (Ministry of Health, Labour and Welfare of Japan). (2016). List of products that have undergone 286
safety assessment and been announced in the Official Gazette (Apr 25, 2016) of the Department of 287
Food Safety, Ministry of Health, Labour, and Welfare;
288
http://www.mhlw.go.jp/english/topics/food/pdf/sec01-2.pdf (2016 May 11).
289
Notification 201 of November 16. (2012). Consumer Affairs Agency, Government of Japan.
290
Notomi, T., Okayama, H., Masubuchi, H., Yonekawa, T., Watanabe, K., Amino, N., & Hase, T. (2000) 291
Loop-mediated isothermal amplification of DNA. Nucleic Acids Res, 28, 12.
292
Oguchi, T., Onishi, M., Minegishi, Y., Kurosawa, Y., Kasahara, M., Akiyama, H., Teshima, R., Futo, S., 293
Furui, S., Hino, A., & Kitta, K. (2009). Development of quantitative duplex real-time PCR method for 294
screening analysis of genetically modified maize. Food Hygiene and Safety Science, 50, 117-125.
295
Randhawa, G. J., Singh, M., Morisset, D., Sood, P., & Zel, J. (2013). Loop-mediated isothermal 296
amplification: rapid visual and real-time methods for detection of genetically modified crops. Journal 297
Agriculture and Food Chemistry, 61, 11338-11346.
298
Safavieh, M., Kanakasabapathy, M. K, Tarlan, F., Ahmed, M. U., Zourob, M., Asghar, W., & Shafiee, H.
299
(2016). Emerging Loop-Mediated Isothermal Amplification-Based Microchip and Microdevice 300
Technologies for Nucleic Acid Detection. ACS Biomaterials Science & Engineering, 2, 278-294.
301
Takabatake, R., Koiwa, T., Kasahara, M., Takashima, K., Futo, S., Minegishi, Y., Akiyama, H., Teshima, 302
R., Oguchi, T., Mano, J., Furui, S., & Kitta, K. (2011). Interlaboratory validation of quantitative duplex 303
real-time PCR method for screening analysis of genetically modified maize. Food Hygiene and Safety 304
Science, 52, 265-269.
305
Takabatake, R., Onishi, M., Koiwa, T., Futo, S., Minegishi, Y., Akiyama, H., Teshima, R., Kurashima, T., 306
Mano, J., Furui, S., & Kitta, K. (2013a). Development and interlaboratory validation of quantitative 307
polymerase chain reaction method for screening analysis of genetically modified soybeans. Biological 308
and Pharmaceutical Bulletin, 36, 131-134.
309
Takabatake, R., Takashima, K., Kurashima, T., Mano, J., Furui, S., Kitta, K., Koiwa, T., Akiyama, H., 310
Teshima, R., Futo, S., & Minegishi, Y. (2013b). Interlaboratory study of qualitative PCR methods for 311
genetically modified maize events MON810, bt11, GA21, and CaMV P35S. Journal of AOAC 312
International, 96, 346-352.
313
Tomita, N., Mori, Y., Kanda, H., & Notomi, T. (2008). Loop-mediated isothermal amplification (LAMP) 314
of gene sequences and simple visual detection of products. Nature Protocols, 3, 877-882.
315
Wang, C., Li, R., Quan, S., Shen, P., Zhang, D., Shi, J., & Yang, L. (2015). GMO detection in food and 316
feed through screening by visual loop-mediated isothermal amplification assays. Analytical and 317
Bioanalytical Chemistry, 407, 4829-4834.
318
Zhang, M., Liu, Y., Chen, L., Quan, S., Jiang, S., Zhang, D., & Yang, L. (2013). One simple DNA 319
extraction device and its combination with modified visual loop-mediated isothermal amplification for 320
rapid on-field detection of genetically modified organisms. Analytical Chemistry. 85, 75-82.
321 322 323 324 325 326 327 328 329 330 331
Fig. 1. Representative results of the specificity tests for LAMP analyses from GM maize and GM soybean 332
events (A-H), and non GM crops (I) and (J), obtained with Genie II. The amplification profiles are shown 333
in (A), (C), (E), (G), (I), and (J), and annealing curves are shown in (B), (D), (F), and (H). The peaks in 334
the annealing curves indicate the annealing temperature of the LAMP products. For GM maize, Bt11, 335
Event176, MON810, T25, GA21, NK603, MON863, TC1507, DAS59122, MON88017, MIR604, 336
MON89034, MIR162, 3272, and MON87460 were used as templates, and for GM soybean, RRS, 337
MON89788, A2704-12, MON87701, MON87705, and MON87769 were used. For SSIIb and Le1, 338
non-GM maize, soybean, rice, wheat, barley, Lotus japonicus, alfalfa, buck wheat, sorghum, rye, and oat 339
were used as templates.
340 341
Fig. S1. Representative results of the specificity tests for the LAMP analyses from GM maize and GM 342
soybean events obtained with Genie II. The amplification profiles are shown in (A), (C), (E), (G), (I), (K) 343
and (M), and annealing curves are shown in (B), (D), (F), (H), (J), (L) and (N). The peaks in the annealing 344
curves indicate the annealing temperatures of the LAMP products. For GM maize, Bt11, Event176, 345
MON810, T25, GA21, NK603, MON863, TC1507, DAS59122, MON88017, MIR604, MON89034, 346
MIR162, 3272, and MON87460 were used as templates, and for GM soybean, RRS, MON89788, 347
A2704-12, MON87701, MON87705, MON87769 were used as templates.
348 349
Fig. S2. Representative results of the second derivatives of the amplification curves for LAMP analyses 350
from GM maize and GM soybean events. The amplification profiles of 14 repeated analyses of 0.5% of 351
Bt11 targeting P35S, RRS targeting P35S, MIR162 targeting pmi, and MON89788 targeting tE9 are 352
shown in panels (A)-(D), respectively.
353 354
0 3 6 9 12 15 18 21 24 27 30 33 55k
75k 65k 85k
MON87460
0 3 6 9 12 15 18 21 24 27 30 33
RRS
P35S Soybean
A2704-1235k 120k
50k 60k 70k 80k 90k 100k 110k
0 3 6 9 12 15 18 21 24 27 30 33
pmi Maize
45k 125k
55k 65k 75k 85k 95k 105k 115k
80 82 84 86 88 90 92 94 96 98
MIR604 MIR162 3272 T25MON810
P35S Soybean
pmi Maize
-5000 10000 0 20000 30000
80 82 84 86 88 90 92 94 96 98 -5000
10000 0 20000 30000 40000 50000 60000 75000 70000
80 82 84 86 88 90 92 94 96 98 -5000
10000 0 20000 30000 40000 50000 60000 75000 70000 40k
FluoresFluorescenceFluorescence -Der-Derivative-Derivative
Time (min) Temperature (℃)
Time (min) Temperature (℃)
Time (min) Temperature (℃)
Fig. 1
(C) (D)
(E) (F)
0 3 6 9 12 15 18 21 24 27 30 33
Soybean
20k 50k 70k 90k 110k
30k
MON87705
MON89788
Soybean
80 82 84 86 88 90 92 94 96 98 -5000
10000 0 20000 30000 40000 50000 60000
Fluorescence -Derivative
Time (min) Temperature (℃)
0 3 6 9 12 15 18 21 24 27 30 33
SSIIb
45k 95k
80k 90k
Fluorescence
Time (min)
60k 70k
50k
Maize
0 3 6 9 12 15 18 21 24 27 30 33
Le1
20k 110k 100k
Fluorescence
Time (min)
30k
Soybean 90k
80k 70k 60k 50k 40k
(I) (J)
P35S F3 5’-ATTGCGATAAAGGAAAGGCTATCG-3’
This study B3 5’-ACTTCCTTATATAGAGGAAGGGTC-3’
FIP 5’-GAAGACGTGGTTGGAACGTCTTCTTAGTGGTCCCAAAGATGGA-3’
BIP 5’-GCAAGTGGATTGATGTGATATCTCCTTGCGAAGGATAGTGGGA-3’
LoopF 5’-TTTCCACGATGCTCCTCG-3’
LoopB 5’-CGTAAGGGATGACGCACA-3’
EPSPS F3 5’-GAATATCCGATTCTCGCTGT-3’
This study B3 5’-AGCCTTCGTATCGGAGAG-3’
FIP 5’-TCATCGCAATCCACGCCATGAACGGTCTGGAAGAACTC-3’
BIP 5’-TCACCGCATCGCCATGAGGCCATCAGGTCCATGAAC-3’
LoopF 5’-TGAGCTTGAGGCCATTGGCGAC-3’
LoopB 5’-GATGCCACGATGATCGC-3’
PAT F3 5’-CGTTAACCATTACATTGAGACG-3’
This study B3 5’-TGCGCCTCCATAGACTTA-3’
FIP 5’-GCCACAACACCCTCAACCTCACAAGAGTGGATTGATGATCT-3’
BIP 5’-CCTGGAAGGCTAGGAACGCTTGATGCCTATGTGACACG-3’
LoopF 5’-GCAACCAACCAAGGGTATCTA-3’
LoopB 5’-ACGATTGGACAGTTGAGAGTAC-3’
pmi F3 5’-CAGTTCACGAGTGCAGAAT-3’
This study B3 5’-CGGCTTGTGGTTAGGATC-3’
FIP 5’-GAAAGGCAGTTCGCCAAAGCCGTGATGTGATTGAGAGTGATA-3’
BIP 5’-CAGCACAGCCACTCTCCATTTGGCAAAACCGATTTCAGA-3’
LoopF 5’-TCTCCGAGCAGAGTCGAT-3’
LoopB 5’-CAGGTTCATCCAAACAAACACA-3’
tE9 F3 5’-ACACCAGAATCCTACTGAGT-3’
This study B3 5’-GAATCTGACAAGGATTCTGGAA-3’
FIP 5’-CCATCCATTTCCATTTCACAGTTCGTGAGTATTATGGCATTGGGA-3’
BIP 5’-AAATGTGTCAAATCGTGGCCTCTAGCCTAGTGAATAAGCATAATGG-3’
LoopF 5’-CAAGCACAACAAATGGTACAAG-3’
LoopB 5’-TGACCGAAGTTAATATGAGGAG-3’
Cry1Ab/Cry1Ac F3
This study B3FIP
BIPLoopF LoopB
5’-TGATGGACATCTTGAACAGC-3’
5’-CATAGGCGAACTCTGTTCC-3’
5’-CGCTGAATCCAACTGGAGAGGTCTACACCGATGCTCACA-3’
5’-AACGCCGCTCCACAACAAGGAAGACAAGGTTCTGTAGAC-3’
5’-GTGTCCAGACCAGTAATACTCTC-3’
5’-TATCGTTGCTCAACTAGGTCAG-3’
BIP 5’-GCTGAGCACTTTCGTCAAGAATTAAGTGCCAAATGTTTGAACGATC-3’
LoopF 5’-CATCCTGTGGTCGTCGTAC-3’
LoopB 5’-CTCTAGAAGAAGCTTCGACGAA-3’
SSIIb F3 5’-CCGAAGCAAAGTCAGAGCG-3’
B3 5’-GCATCAGCCTTAGCATCCA-3’
FIP 5’-ATCAGCTTTGGGTCCGGACACGCAATGCAAAACGGAACGAG-3’
BIP 5’-AGAAATCGATGCCAGTGCGGTGGCGATGCCTATGCTTTCCA-3’
LoopF 5’-GCGCGGCGGTGCT-3’
LoopB 5’-AAGCCAGAGCCCGCAGG-3’
Le1 F3 5’-CCAGAATGTGGTTGTATCTCT-3’
B3 5’-TTGTCCCAAATGTGGATGG-3’
FIP 5’-TTCGGCACGAACTTGTTCCATTGGTACTGGTGCTACTGA-3’
BIP 5’-TGATCCTCCAAGGAGACGCTCCGTTTTCGTCAACCTTATTG-3’
LoopF 5’-TTTCCGCTGAGTTTGCCT-3’
LoopB 5’-TGACCTCCTCGGGAAAGT-3’
P35S-1 F3 5’-AGGAAGGGTCTTGCG-3’
Zhang et al.
B3 5’-ATAAAGGAAAGGCCATCG-3’
FIP 5’-GTCTTCAAAGCAAGTGGGGATAGTGGGATTGTGCG-3’
BIP 5’-TTCCACGATGCTCCTCGCCTCTGCCGACAGTGG-3’
LoopF 5’-ATTGATGTGATATCTCCACTGACGTAAGGGATGA-3’
LoopB 5’-TGGGTGGGGGTCCATCTTTGGGA-3’
P35S-2 F3 5’-CTCCTCGGATTCCATTGC-3’
Randhawa et al.
B3 5’-TCTACAGGACGGACCATG-3’
FIP 5’-ACGATGCTCCTCGTGGGTCATCGTTGAAGATGCCTCT-3’
BIP 5’-CGTTCCAACCACGTCTTCAAGTCTTGCGAAGGATAGTGG-3’
LoopF 5’-ATCTTTGGGACCACTGTCG-3’
LoopB 5’-TGATATCTCCACTGACGTAAGG-3’
P35S-3 F3 5’-CAAAGATGGACCCCCACC-3’
Wang et al.
B3 5’-CGGACCATGGAGATCTGCTA-3’
FIP 5’-TGCGTCATCCCTTACGTCAGTGAAGAAGACGTTCCAACCACG-3’
BIP 5’-TCCTTCGCAAGACCCTTCCTCTGTCAGCTTGTCAGCGTGT3’
LoopF 5’-GAGATATCATATCAATCCACTTGCTTTGAAGA-3’
LoopB 5’-ATATAAGGAAGTTCATTTCATTTGGAGAGG-3’
This study
This study
Bt11 Event176 MON810 T25 GA21 NK603 MON863 TC1507 DAS59122 MON88017 MIR604 MON89034 MIR162 3272 MON87460
P35S EPSPS
+ + + + + - + + + + + - - - +
RRS MON89788 A2704-12 MON87701 MON87705
+ - + - -
PAT pmi tE9 Cry1Ac
GM event GA21
MON87769 -
+ - + - - - + - + - - - - - - - - + -
- - - -
- - + -
- - + -
- - - - - + -
- - - -
- - - - - - - - - - + - + + - - - - - - -
- - - - - - - - - - - - - - - + -
- - + +
+ - - - - - - - - - - - - - - - - + -
- -
- - - - + -
- - - - - - - - - - - - - - -
GM maize
GM soybean
P35S
LOD GM event
Event176 Bt11 0.1%
MON810 0.5%
T25 0.3%
NK603 0.3%
MON863 0.3%
TC1507 0.3%
DAS59122 0.5%
MON88017 0.3% 0.3%
MON89034
MON87460 0.5%
0.5%
RRS A2704-12
0.05%
0.05%
EPSPS MON88017 NK603 0.3% 0.3%
RRS 0.1%
PAT Bt11 0.3%
T25 0.3%
TC1507
DAS59122 0.3%
0.3%
A2704-12 0.05%
pmi MIR604 0.3%
MIR162 0.3%
3272 0.5%
Time (min) Temperature ( ℃ )
18.56 ± 3.30 86.22 ± 0.035
19.17 ± 3.19 86.21 ± 0.099
18.09 ± 1.57 86.20 ± 0.048
16.43 ± 2.25 86.15 ± 0.059
18.24 ± 3.28 86.14 ± 0.057
20.21 ± 2.58 86.11 ± 0.082
16.51 ± 2.20 86.27 ± 0.080
17.14 ± 2.30 86.14 ± 0.054
21.50 ± 2.33 86.09 ± 0.085
17.22 ± 4.09 86.30 ± 0.077
20.13 ± 2.52 86.25 ± 0.064
18.23 ± 4.32 85.96 ± 0.064
17.13 ± 3.41 85.97 ± 0.063
21.28 ± 2.43 93.63 ± 0.158
21.40 ± 2.54 93.63 ± 0.095
21.12 ± 2.03 93.55 ± 0.075
12.31 ± 2.56 87.17 ± 0.047
13.21 ± 2.56 87.16 ± 0.050
14.15 ± 3.17 87.16 ± 0.046
11.09 ± 2.04 87.15 ± 0.070
12.59 ± 2.28 87.07 ± 0.097
16.32 ± 3.13 87.03 ± 0.046
16.43 ± 3.12 87.02 ± 0.084
13.36 ± 2.02 87.12 ± 0.040
Cry1Ab/
Cry1Ac Bt11 MON87701 0.3% 0.1%
GA21 GA21 0.1%
15.34 ± 3.49 87.00 ± 0.048
11.44 ± 1.24 86.89 ± 0.029
14.50 ± 3.37 90.73 ± 0.030
0.5% MON810 Positive/Total Positive rate
21/21 100%
19/21 90.5%
3/21 14.3%
19/21 90.5%
0.3% MON810 Positive/Total Positive rate
21/21 100%
18/21 85.7%
3/21 14.3%
11/21 52.4%
0.1% RRS Positive/Total Positive rate
21/21 100%
13/21 61.9%
4/21 19.0%
18/21 85.7%
0.05% RRS Positive/Total Positive rate
20/21 95.2%
13/21 61.9%
3/21 14.3%
10/21
47.6%
Target P35S
GM event
MON810 (40 mg) 0.5%
Time (min) Temperature ( ℃ ) 15.03 ± 2.09 86.18 ± 0.047 GM (%) Positive/Total Positive rate
21/21 100%
RRS (20 mg) 0.5% 21/21 100% 16.59 ± 1.19 86.22 ± 0.046
EPSPS MON88017 (40 mg) 0.5% 21/21 100% 17.57 ± 0.36 93.72 ± 0.048
RRS (20 mg) 0.5% 21/21 100% 24.08 ± 0.23 93.96 ± 0.884
PAT Bt11 (40 mg) 0.4% 21/21 100% 10.01 ± 0.34 87.23 ± 0.042
A2704-12 (20 mg) 0.5% 21/21 100% 11.34 ± 0.14 87.23 ± 0.033
pmi MIR604 (40 mg) 0.5% 21/21 100% 16.48 ± 3.45 87.00 ± 0.047
MIR604 (20 mg) 0.5% 15/21 71.4%
MON810 (20 mg) 0.5% 18/21 85.7%
tE9 MON89788 (20 mg) 0.5% 21/21 100% 24.21 ± 0.44 80.72 ± 0.049
Cry1Ab/
Cry1Ac
MON87701 (20 mg) 0.5% 21/21 100% 12.33 ± 0.48 87.03 ± 0.039
GA21 GA21 (40 mg) 0.5% 21/21 100% 13.57 ± 1.55 90.78 ± 0.032
Bt11 (40 mg) 0.4% 21/21 100% 10.18 ± 0.28 87.00 ± 0.036
0 3 6 9 12 15 18 21 24 27 30 33 40k
60k 50k
90k
EPSPS Maize
0 3 6 9 12 15 18 21 24 27 30 33
RRS
EPSPS Soybean
35k 105k
45k 55k 65k 75k 85k 95k
0 3 6 9 12 15 18 21 24 27 30 33
PAT Maize
30k 130k
50k 70k 90k 120k
80 82
EPSPS Maize
84 86 88 90 92 94 96 98
NK603 MON88017
EPSPS Soybean
PAT Maize
-2000 2000 0 4000
80 82 84 86 88 90 92 94 96 98 -20000
20000 40000 240000
80 82 84 86 88 90 92 94 96 98 -5000
10000 0 20000 80000
FluorescenceFluorescenceFluorescence -Derivative-Derivative-Derivative
Time (min) Temperature (℃)
Time (min) Temperature (℃)
Time (min) Temperature (℃)
Fig. S1
(A) (B)
(C) (D)
(E) (F)
60000 80000 100000 120000 140000 160000 180000 200000 220000 70k
80k
6000 100008000 12000 14000 16000 18000 200000
Bt11TC1507 DAS59122 T25
30000 40000 50000 60000 70000
0 3 6 9 12 15 18 21 24 27 30 33 45k
95k
80k 90k
Fluorescence
Time (min)
60k 70k
50k
(K) (L)
0 3 6 9 12 15 18 21 24 27 30 33
soybean
25k 40k
Fluorescence
Time (min)
A2704-12
50k 60k 70k 80k
90k
Soybean
80 82 84 86 88 90 92 94 96 98 -5000
10000 0 20000 30000 40000 50000
-Derivative
Temperature (℃)
0 3 6 9 12 15 18 21 24 27 30 33
Cry1Ab/Ac Maize
30k 130k
50k 70k 90k
120k
Cry1Ab/Ac
Maize
80 82 84 86 88 90 92 94 96 98 -5000
10000 0 90000
Fluorescence -Derivative
Time (min) Temperature (℃)
(I)
Bt11(J)
20000 30000 40000 50000 60000 70000 80000
Cry1Ab/Ac
Soybean
MON8770180 82 84 86 88 90 92 94 96 98 -5000
10000 0 20000 80000
-Derivative
Temperature (℃)
30000 40000 50000 60000
70000
Cry1Ab/Ac
Soybean
Maize
80 82 84 86 88 90 92 94 96 98 -5000
5000 0
-Derivative
Temperature (℃) 0 3 6 9 12 15 18 21 24 27 30 33
35k 55k 45k 65k 85k 75k
95k
Maize
GA21
Fluorescence
15000 10000 25000 20000 30000
Fig. S2
0 3 6 9 12 15 18 21 24 27 30 33
pmi MIR162
-0.005 0.06
0.01 0.02 0.03 0.04 0.05
Ratio
Time (min)
(C)
0 3 6 9 12 15 18 21 24 27 30 33 -0.004
0.00 0.01
R
Time (min)
0 3 6 9 12 15 18 21 24 27 30 33 -0.002
0.01
Rat 0.02
Time (min)
0.00
0 3 6 9 12 15 18 21 24 27 30 33 -0.01
0.11
0.01 0.03 0.05 0.07 0.09
Ratio
Time (min)
(D)
0.00
tE9 MON89788
Maize ①
MON810(0.5%)+
GA21(0.5%)
⑤
MON88017(0.5%) ②
Bt11(0.4%)+
GA21(0.2%)
③
MIR604(0.5%) ②
Bt11(0.4%)+
GA21(0.2%)
①
MON810(0.5%)+
GA21(0.5%) Soybean ⑥
RRS(0.5%)+
MON87701(0.5%)
④
RRS(0.5%)+
A2704-12(0.5%)+
MON89788(0.5)%
④
RRS(0.5%)+
A2704-12(0.5%)+
MON89788(0.5)%
④
RRS(0.5%)+
A2704-12(0.5%)+
MON89788(0.5)%
⑥
RRS(0.5%)+
MON87701(0.5%)