Acta Med. Nagasaki 38:257 - 264
A Study of the Pattern of Recurrence Usig Flow Cytometric DNA Analysis and PCNA/AgNOR Sequential Staining in Non-Small Cell Lung Cancer
Satoshi Matsuo
First Dapartment of Surgery, Nagasaki University School of Medicine, 7-1 Sakamoto 1-chome, Nagasaki-city, Nagasaki 852, Japan
Summary: Flow cytometric DNA analysis and PCNA/AgNOR sequential staining were performed to examine the pattern of recurrence in non-small cell lung cancer.
The DNA ploidy was aneuploidy in 80.6% and diploidy in 19.4%. The mean DNA index (DI) was 1.63 for the total population, 1.62 in non-recurrent cases, and 1.64 in recurrent cases. The differences were not statistically significant, but the distribution pattern of DIs was somewhat at odds between non-recurrent cases and recurrent cases.
In the analysis of recurrence in Stage I and II, the lung metastasises or the local recurrences were concentrated in the lower DI range, and the brain or the bone metastasises in the higher DI range. Thus, cases with DIs under 1.3 showed the lung metastasises or the local recurrences, and those over 1.9 were in the brain or the bone, but the cases with DI from 1.3 to 1.9 had all types of recurrences.
The AgNOR scores obtained by sequential staining with PCNA provided more accurate information on recurrences. The cases with any DI and lower AgNOR scores (under about 3.0) in PCNA-negative cells showed rare recurrences. In the DI range of 1.3 to 1.9, many cases with AgNOR scores from 3.0 to 4.1 in PCNA-negative cells had the lung metastasises or the local recurrences, and those with AgNOR scores over 4.1 had those in the brain or the bone.
The above information is considered valuable for the follow-up and postoperative management of Stage I and II non-small cell lung carcinoma.
Key Word: Non-small cell lung cancer, Recurrence, DNA index, PCNA and AgNOR sequential staining
Introduction
Non-small cell lung cancer (NSCLC), which is an increas- ing important cause of death in both men and women in Japan. It represents a mixed group of tumors varying in clinical behavior and in the response to different treatment modalities. The factor most predictive of the clinical out- come is the stage (TNM classification of UICCI') at diag- nosis. However, the patients may undergo absolute curative operation or relative curative operation, but, even if the diagnosis is Stage I, over 20 or 30% of them will die from relapses within five years after operation.') Great variabil- ities in outcome in each stage demand a search for some other prognostic variables that would help distinguish between patients with good prognosis from those with poor
prognosis.
The flow cytometric analysis of the nuclear DNA con- tents has been used to establish objective prognostic vari- ables in a wide variety of neoplasms.3-5' Regarding NSCLC, there are some reports that DNA ploidy has an important prognostic value."') We also reported that DNA ploidy was a useful prognostic variable predictive of the postoperative courses of Stage I and II cases, permitting further ramifi- cation of Stage I and II diseases.")
The scoring of interphase nucleolar organizer regions (NORs) using the argyroghil (AgNOR) technique") has been demonstrated to be of value in assessing the degree of malignancy in neoplasms.1 19) Cancer cells are charac- terized by higher AgNOR numbers in the interphase nucleus than in normal or benign tumor cells. And in terms of malignancy, high grade malignant cells have higher AgNOR numbers than the lower grade ones. Initially, the reason for increased AgNOR counts with increasing de- grees of malignancy was not fully understood but there is now a profusion of evidence showing that the AgNOR score in interphase nuclei represents the level of cell proliferation. The proliferating cell nuclear antigen (PCNA) has attracted attention as a marker of proliferating cells.
With anti-PCNA antibodies unlike Ki-67 and thymidine- or bromodeoxyuridine-labeling, the immunohistochemical cell-cycle can be analyzed in routinely processed formalin- fixed and paraffin-embedded tissues. The double staining method using monoclonal antibodies in combination with the. argyrophil technique"' has helped to overcome the problem associated with the heterogeneity of neoplasms by allowing differentiation of various cells before AgNORs counting. We applied this method to NSCLC using PCNA.
In this study, we performed a flow cytometric DNA analysis, especially for DNA index (DI), and PCNA and AgNOR sequential staining, and studied, in NSCLC, the correlation between these parameters and recurrence.
Materials and Methods Patients
The study population consisted of 320 patients who were diagnosed and treated for NSCLC at the First Department of Surgery, Nagasaki University School of Medicine during the period of 1982 to 1988. The morphological classi- fication used was that of the WHO`) study. Postsurgical histopathologic findings (TNM) and postsurgical TNM staging (pathologic stage) were based on the UICC classi- fication. The tumors, totaling 320, were determined to be squamous cell carcinoma in 145, adenocarcinoma in 158, large cell carcinoma in 12, and other carcinomas in 5. Of 320 patients, 163 were classified into Stage I, 27 into Stage II, 130 into Stage III, Stage IV cases were not included in this study.
DNA Flow Cytometry
At least 3 representative tumor blocks from each case, which included the least differentiated portion of the tumor, were used for flow cytometric analysis. As much as pos- sible, sections with no or minimal tumor necrosis were selected.
Tissues for flow cytometric analysis were processed by the method of Schutte et al."' as modified. Briefly, 2 or 3 sections, 50,um thick, were cut out from each formalin- fixed and paraffin-embedded block. The tissues were depa- raffinized in xylene and rehydrated in an ethanol series.
Each sample was taken to distilled water and incubated in a 0.25% solution of trypsin (DIFCO, 1:250, Detroit, Mich.) in citrate buffer (3mM trisodium citrate, 0. 1% v/v Nonidet P-40, 1.5mM spermine tertachloride, 0.5mM Tris. pH 7.6) at 37 °C for 18 hours on a shaking-water bath. The trypsin- digested sample was filtered through a 50,um nylonmesh and centrifuged. It was then stained with propidium iodide solution (final concentration 50,ug/ml, Sigma Chemical Co., St. Louis, MO) according to the method of Vindelgv et al."'
An average of 10,000 nuclei per sample were analyzed on a FACScan flow cytometer (Becton-Dickinson, FACS Division, San Jose, CA). The Non-neoplastic lung tissue included in each specimen served as an internal standard.
The generated flow cytometric data were classified into DNA diploidy and DNA aneuploidy. The DNA diploid tumor population was defined as having only one G0/G, peak. DNA aneuploidy was assumed when a GQ/G, peak was accompanied by S and G2M. The DNA content was expressed in DI. Accounting for intratumoral DNA hetero- geneity, the highest DI was regarded as the DNA content of each case. The half-peak coefficient of variation (CV) was calculated for DNA diploid Go/G, peaks in all cases, which averaged 5.4% (range, 1.3% to 9.9%). Histograms with CV exceeding 8% were considered as poor quality and were
not used.
PCNA and AgNOR Sequential Staining
Sequential staining of PCNA and AgNOR was performed according to the method of Yoshida," and a modification of the method of Smith et al."' In brief, formalin-fixed and paraffin-embedded tissue sections, 3,um thick, were taken from the same block just as for DNA analysis and allowed to adhere to glass slides at room temperature. The sections were then dewaxed in xylene, rehydrated in an ethanol series, and taken to distilled water.
The sections were incubated in. a 1:100 dilution of mouse monoclonal anti-PCNA antibody (PC 10, DAKO) in PBS (pH 7.6) for the use as primary antibody. PCNA was visualized using the labelled streptavidin biotin alikaline phoshatase method (DAKO LSAB Kit [AP], DAKO) and Fast red (DAKO).
After 10 minutes' washing in distilled deionized water, the standard AgNOR staining using an AgNORs staining colloid (1 volume of 2% gelatin in 1% formic acid and 2 volumes of 50% silver nitrate solution) was performed."-"' However, the incubation at room temperature was carried out for an extended period of 50 minutes for improved contrast in the dark room. The sections were immersed in 5% sodium thiosulfate solution for 30 or 60 seconds, washed in distilled water for 10 minutes, and mounted in aqueous mounting medium.
The nucleus was regarded as being PCNA-positive only when there was an unequivocal, intense red reaction prod- uct. More than 1,000 cells were examined under a x40 objective and the PCNA labelling index (PCNA LI) was determined. Then, AgNORs were counted in 100 each of random PCNA-positive, and PCNA-negative cells, under an X 100 oil immersion objective, said number having been achieved by the standard continuous mean technique.
Statistical Analysis
The association between different categories of DNA flow cytometric data was examined using Student's t-test. The differences between PCNA scores in different groups of specimens and between AgNOR counts in different cell groups were analyzed by the confidence interval procedure.
Results
Clinical and Histopathological Characteristics
Histograms that could be analyzed were obtained in 288 of the 320 cases included in this study. The clinical and histopathologic characteristics and survival rates of the excluded cases did not differ significantly from those of the whole population.
The patient population consisted of 225 men and 63 women. They were between 31 and 85 years of age (mean
± standard deviation, 64.0 ± 9.36 years). There were 138 squamous cell carcinomas (47.9%), 136 adenocarcinomas (47.2%), 9 large cell carcinomas (3.1%), and 5 other carcinomas (1.8%). TNM staging using postsurgical patho- logic criteria yielded the following groups: 145 tumors of Stage I; 24 of Stage II; and 120 of Stage III.
One-hundred-and-one (35.1%) of those 288 patients had recurrences. There were 30 (29.7%) in the lung metas- tasises, 21 (20.8%) in the local recurrences, 19 (18.8) in the brain, 13 (12.9%) in the bone, and 18 (17.8%) in others. No relationship was found between the site of recurrence and TNM Stage. However, histopathologically, more cases of metastasises in the brain were adenocarcinomas and more of the local recurrences were squamous cell carcinomas.
Flow Cytometric Analysis
Of the 288 tumors that were successfully analyzed, 232 (80.6%) were DNA aneuploid and 56 (19.4%) were DNA diploid. The CV for diploid G0/G, peaks for all cases ranged form 1.3 to 9.9 (median, 5.4). As indicated in Table 1, some statistically significant differences were found between the patients with diploid tumors and those with aneuploid tumors in clinical and histologic variables (stage and nodal status). In contrast, histological types were not associated with DNA ploidy.
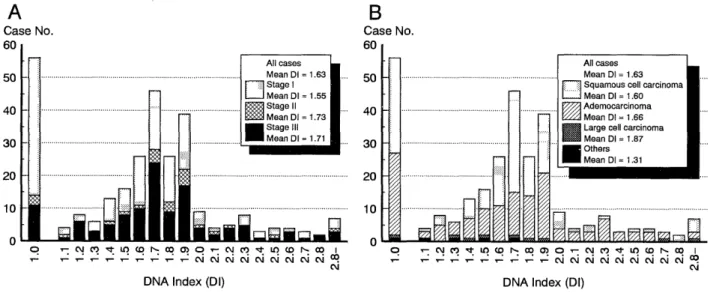
The histogram of DI distribution in all cases is shown in Fig. 1; the mean DI value was 1.63, or 1.55 in Stage I, 1.73 in Stage II, and 1.71 in Stage III. The difference was statistically significant between Stages I and 11, and be- tween Stages I and III (p < 0.01). In terms of histologic type, the mean DI values in squamous cell carcinoma, adenocarcinoma, large cell carcinoma, and others were 1.60, 1.66, 1.87, and 1.31, respectively. These differences
Table 1. Relationship of Clinicopathological Features with DNA Ploidy.
Diploidy Aneuploidy T
otal Mean DI
(%) (%)
Type of carcinoma N. S.
Squamous 29 (21.0) 109 (80.0) 138 1.60 Adeno 25 (18.4) 111 (81.6) 136 1.66 Large cell 1 (11.1) 8(88.9) 9 1.87
Others 1 (20.0) 4(80.0) 5 1.30
Stage p < 0.01
1 42 (30.0) 103 (70.0) 145 1.55
II 3(12.5) 21 (87.5) 24 1.73
1 III 11 ( 9.2) 108 (90.8) 119 1.71
T factor N. S.
1 25 (31.3) 55 (68.7) 80 1.59
2 23 (15.5) 125(84-5) 148 1.62
3 6(13.3) 39 (86.7) 45 1.73
4 2(13.3) 13 (86.7) 15 1.66
N factor p < 0.05
0 45 (26.6) 124 (73.4) 169 1.57
1 4(12.5) 28 (87.5) 32 1.72
2 7 ( 8.4) 76 (91.6) 83 1.68
3 0 4(100) 4 2.13
DI: DNA index N. S.: Not significant
were not statistically significant.
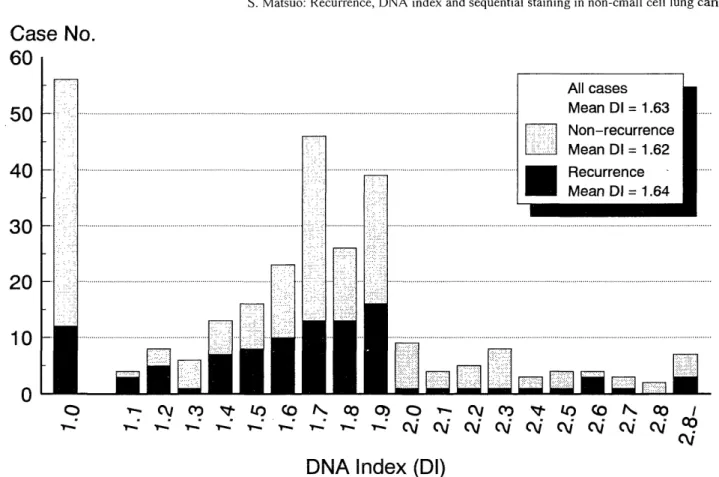
With regard to recurrence, the mean DI value was 1.64 in recurrent cases (RC), 1.62 in non-recurrent cases (NRC), and 1.63 in all cases. There were no statistically significant differences but the distribution patterns showed some dif- ferences. Thus, the pattern for all cases showed both DNA diploidy and DNA aneuploidy peaks, while only the DNA aneuploid peak was found in RC (Fig. 2).
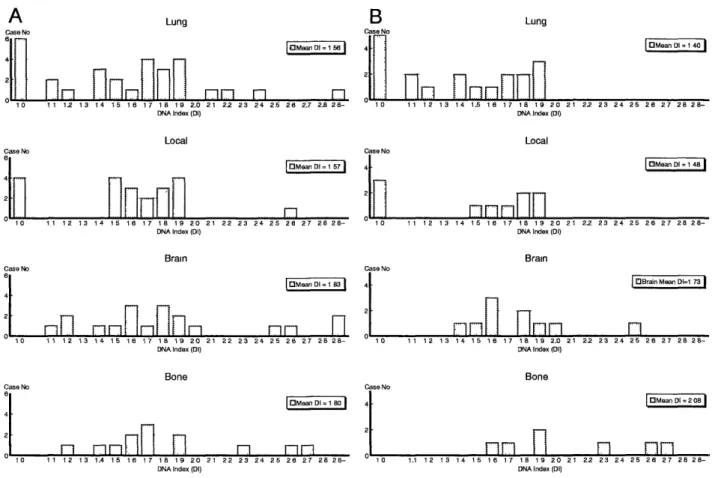
Recurrence site analysis was made from DI distributions for 4 types of recurrence, viz. the lung, the local, the brain and the bone. The mean DI values of recjirrence in the lung, the local, the brain and the bone were 1.56, 1.57, 1.83, 1.80, respectively (Fig. 3A). The difference between
Fig. 1. Distribution of DIs in NSCLC; (A) in Stage I, II, and III, and (B) in squamous cell, adeno-, large-cell, and other carcinomas.
Fig. 2. Distibution of DIs in recurrence and non-recurrence cases.
recurrences in the lung and the local and those in the brain and the bone was statistically significant (p < 0.05). The DIs of recurrences in the lung and the local were concen- trated in the lower DI range, while the DIs of recurrences in the brain and the bone were concentrated in the higher DI range with the exception of DNA diploidy (DI = 1.0). In Stages I and II, this tendency was more prominent. The mean DIs for the lung, the local, the brain and the bone were 1.40, 1.48, 1.73 and 2.08, respectively (p < 0.005, Fig. 3B).
The DI distribution pattern of RC was reconstructed according to 2 types of recurrence, i. e. intra-lung recur- rence (ILR, lung and local) and extra-lung recurrence (ELR, brain and bone) in Fig. 4. The cases of DI under 1.3 showed only ILRs, and those of DI over 2.0 invariably had ELRs. In the cases with DI from 1.3 to 2.0, all types of recurrences were found.
PCNA and AgNORs Sequential Staining Analysis
We used cases in Stages I and II (n = 55) for sequential staining in this study. A positive reaction to PCNA anti- body was reflected in an intense red coloration of the nucleus. The AgNORs showed up as black "dots" of varying size.
The mean AgNOR scores in staining AgNOR alone were different between Stage I/II and Stage III (4.58 versus 5.83,
p < 0.0005, data was not shown). However, no difference between NRC and RC in Stages I and II (Table 2). The mean PCNA LI showed no significant difference, either.
The difference in AgNOR score between PCNA-positive and-negative cells were statistically significant at p <
0.0001. The mean AgNOR score of PCNA-positive cells was 6.67 in NRC (n = 11) versus 7.52 in RC (n = 44), although this difference was not statistically significant. A statistically significant difference was found between NRC and ELR (6.67 versus 8.44, p < 0.001). The AgNOR score of PCNA-negative cells was 2.98 in NRC versus 3.96 in RC, 2.98 in NRC versus 3.67 in ILR, 2.98 in NRC versus 4.42 in ELR, and 3.67 in ILR versus 4.42 in ELR. These differences were statistically significant.
Correlation between DI and Sequential Staining
The correlation between DI and AgNOR score in PCNA- negative cells in Stages I and II are shown in a scatter diagram (Fig. 5). There was no correlation between DI and AgNOR score in any type of cell (AgNOR alone, PCNA-
positive cells, and PCNA-negative cells), or between DI and PCNA LI.
The cases with AgNOR scores under 3.0 were mostly non-recurrence cases except one, and all the cases with AgNOR scores over 3.0 and DI under 1.3 were ILR cases.
Most of the cases with AgNOR scores over 4.1 and DI over
Fig. 3. Distribution of DNA indices in recurrent cases. (A) Distribution of DIs of each recurrent type in all recurrent cases. (B) Distribution of DIs of each rerurrent type in Stage I and II recurrent cases. The DIs of the lung and the local are concentrated in the lower DI range, while the DIs of the brain and the bone in higher DI range with the exception of DNA diploidy (DI = 1.0).
Fig. 4. Distribution of DIs Stage I and II recurrent cases. The types of recurrence are recategorized into ILRs (lung and local) and ELRs (brain and bone). The cases with DI < 1.3 show IRLs only, and those with DI > 1.9 show ELRs only. In the case of 1.3 < DI < 1.9, all types of recurrences are found.
Table 2. Relationship of Recurrence with AgNOR Scores in PCNA-positive and -negative Cells in Stage I and II Non-Small Cell Lung Cancers.
Mean AgNOR score in PCNA LI Mean AgNOR score in Mean AgNOR score in
AgNOR staining only (%) PCNA positive cells PCNA negative cells
All cases (n = 55) 4.56 ± 1.08 60.0 7.42 ± 1.43 3.77 ± 0.77
Non-recurrence (n = 11) 4.94± 1.15 59.2 6.67 ± 0.96 2.98 ± 0.64*--]
Recurrence (n = 44) 4.49 ± 0.88 61.2 7.52 ± 1.53 * * * 3.96 ± 0.71 *
ILRs (n = 21) 4.10± 0.88 62.3 6.96 ± 1.62 3.67 ± 0.73
ELRs (n = 15) 5.03 ± 0.90 59.6 8.44 ± 0.97 4.42 ± 0.45
PCNA LI: PCNA labelling index
ILRs: intra-lung recurrences (lung and local) ELRs: extra-lung recurrences (brain and bone)
* p < 0.05, ** p < 0.005, *** p < 0.001, **** p < 0.0001
Fig. 5. Correlation between DI and AgNOR score in PCNA-negative cells in Stages I and II.
1.3 had ELRs, but some cases with AgNOR scores from 3.0 to 4.1 and DI from 1.3 to 1.9 did not show recurrences or had ELRs in spite of the prediction of ILR.
Discussion
Though a number of flow cytometric studies have so far been done on DNA ploidy in NSCLC, the significance of DNA ploidy as a prognostic variable has not been estab- lished. Some studies found no correlation between DNA ploidy and clinical outcome""' but many studies showed DNA aneuploidy to be highly predictive of an unfavorable outcome."' Our previous study (Tagawa et al.") indicated
that the DNA ploidy was a useful prognostic variable capable of predicting the postopeative courses of Stage I and II cases and allowing a further division of Stage I and II diseases into subgroups. Therefore, in this study, we performed DI analysis mainly in Stage I and II cases, leaving the study of correlation between DI and clinical outcome, especially recurrence, to be completed in future.
The finding of 80.6% DNA aneuploidy in this series falls within the reported range of 45% to 85%. NSCLC shows a high frequency of DNA aneuploidy but some DNA aneu- ploidy cases may meet with varying clinical outcomes.
Meanwile, DI reflects the nuclear DNA content of the case and as such is used as a marker instead of DNA diploidy or aneuploidy. However, there is the problem of DNA hetero-
geneity, which has been found in NSCLC79' as well as in other neploasms.3033, In the present study, we sampled at least 3 tumor blocks to detect more stemlines, and when DNA heterogeneity was found, the highest DI value was taken as the DI of the case.
The rationale is as follows. The DI distribution was not alike between RC and NRC, although the mean DI value was almost compatible, viz. 1.64 versus 1.62. The DNA diploid (DI = 1.0) cases in RC were less numerous than those in NRC, and lower DI cases in RC were more numerous than those in NRC. In RC. the mode of recur- rence was classified into 3 types according to DI in Stages I and II, and this mode classification suggested a new ap- proach to the postoperative management of NSCLC.
The AgNOR score is being increasingly used in the field of tumor histology for assessing the degree of malignancy and sometimes for the prognosis and treatment of cases, too. Ogura et al."' reported that the number of AgNOR is related to the growth rate in lung adenocarcinoma, but some studies rule out any relation between AgNOR score and clinicopathological finding s.3 ,35' Thus, the AgNOR score had not been established as an independent param- eter. Many investigators report that it is not recommendable to rely on any one histopathological marker of cell prolif- eration but one should use a plurality of markers in combi- nation for in improved accuracy of malignancy evaluation.
Kakeji et al.3b' showed that the combined use of AgNOR and Ki-67 had a greater predictive value for lymph node metastasis in gastric cancer.
The possibilities of sequential staining using AgNOR in combination with a monoclonal antibody was first sug- gested by Murray et al.") in 1989. In 1990, Janmohamed reported on the use of Ki-67 and AgNOR sequential stain- ing in non-Hodgikin's lymphomas .3') The sequential stain- ing method using PCNA and AgNOR was established by Yoshida,2) in colorectal carcinoma, Smith et al.,"' in non- Hodgikin's lymphoma, almost at the same time. However, while PCNA immunostaining is theoretically indicated for cells in the late G, to S phase, PCNA is relatively stable and remains in nuclei till the G2 and M phase, in formalin-fixed and paraffin-embedded tissues. Therefore, we considered it worthwhile to use PCNA immunostaining for identification of the proliferation phase of the cells. We found the both PCNA-positive and -negative carcinoma cells had higher AgNOR numbers than normal lung tissue cells (data not shown). It is of interest that carcinoma cells lacking PCNA may still give relatively higher AgNOR scores compared with resting normal lung tissue cells. The AgNOR scores in PCNA-negative cells may be reflecting their proliferative activity even in the non-proliferating phase.
The results of the current study, indicated that DI is not so useful for the discrimination of recurrence from non- recurrence, but in recurrent cases, DI can be instrumental for differentiating a mode of recurrence, for generally the lower DI cases had ILRs, the higher DI cases had ELRs,
and the intermediate DI cases develop all types of recur- rences, particularly in Stages I and II. This information seems more useful than the information on DNA ploidy alone.
The DI and PCNA/AgNOR sequential staining data provided a greater insight into recurrences. The cases with any DI and lower AgNOR scores (almost under 3.0) in PCNA-negative cells develop recurrences rarely. When DI ranges from 1.3 to 1.9, many cases with AgNOR scores in PCNA-negative cells between 3.0 and 4.1 have ILRs, and those with AgNOR scores over 4.1 experience ELRs.
Considering the poor prognosis of NSCLS due to re- lapses, which occur in Stage I cases, if the site of recur- rence could be forecast and a timely prophylactic chemotherapy or radiation therapy for such episodes be instituted, the follow-up and selection of pertinent thera- peutic approaches would be greatly facilitated, of course.
Acknowledgements
The author would like to thank Professor Masao Tomita for helpful suggestions and critical reading of the manuscript and Dr. Yutaka Tagawa for his help in designing the study.
This work was presented, in part, at the 93rd Japan Sur- gical Society Meeting, Sendai, in April 1993.
References
1) Hermanek, P. and Sobin, L. H.: TNM classification of malignant tumors. Fourth Editoin, UICC, Springer-Verlag, 69, 1987.
2) Thomas, P., Rubinstein, L. and Lung cancer study group: Cancer recurrence after rescetion. T1N0 non-small cell lung cancer. Ann.
Thorac. Surg. 49:242-247, 1990.
3) Hedly, D. W., Rugg, C. A. and Gelber, D.: Association of DNA index and S-phase fraction with prognosis of nodes positive early breast
cancer. Cancer Res. 47:4729-4735, 1987.
4) Schutte, B., Reynders, M. J., Wiggers, T., et al.: Retrospective anal- ysis of the prognostic significance of DNA content and proliferating
activity in large cell carcinoma. Cancer Res. 47:5495-5496, 1987.
5) Muhonen, T., Pyrhonen, S., Laasonen, A., et al.: Tumor growth rate and DNA flow cytometry parameters as prognostic factors in meta-
static melanoma. Br. J. Cancer 66:528-532, 1992.
6) Volm, M., Mattern, J., Sonka, J., et al.: DNA distribution in non- small-cell lung carcinomas and its ralationship to clinical behavior.
Cytometry 6:348-356, 1985.
7) Tirindelli-Danesi, D., Teodori, L., Mauro, F., et al.: Prognostic signif- icance of flow cytometry in Lung cancer. A 5-year study. Cancer
60:844-851, 1987.
8) Zimmerman, P. V., Hawson, G. A. T., Bint, M. H., et al.: Ploidy as a prognostic determinant in surgically treated lung cancer. Lancet
2:530-533, 1987.
9) Volm, M., Hahn, E. W., Mattern, J., et al.: Five-year follow-up study of independent clinical and flow cytometric prognostic factors for
survival of patients with non-small cell lung carcinoma. Cancer Res.
48:2923-2928, 1988.
10) Isobe, H., Miyamoto, H., Shimizu, T., et al.: Prognostic and thera- peutic significance of the flow cytometric nuclear DNA content in
non-small cell lung cancer. Cancer 65:1391-1395, 1990.
11) Sahin, A. A., Ro, J. Y., El-Naggar, A. K., et al.: Flow cytometric
analysis of the DNA content of non-small cell lung cancer. Ploidy as a significant prognostic indicator in squamous cell caracinoma of the lung. Cancer 65:530-537, 1990.
12) Tagawa, Y., Yasutake, T., Sawai, T., et al.: A Trial for Subgrouping
of Stage I + II Non-Small Cell Lung Cancer in Based on DNA Ploidy.
Acta Med. Nagasaki 37:90-93, 1992.
13) Ploton, D., Menager, M., Jeannesson, P., et al.: Improvement in the staining and in the visualization of the argyrophilic proteins of the
nucleolar organizer region at the optic level. Histochem. J. 18:5-14,
1986.
14) Crocker, J. and Nar, P.: Nucleolar organizer regions in lymphomas. J.
Pathol. 151:111-118, 1987.
15) Crocker, J. and Skilbeck. N. Q.: Nucleolar organizer region associated proteins in cutaneous melantic lesions: A quantitative study. J. Clin.
Pathol. 40:885-889, 1987.
16) Crocker, J. and McGovern, J.: Nucleolar organizer regions in normal, cirrhotic and carcinomatous livers. J. Clin. Pathol. 41:1044-1048,
1988.
17) Leong, A. and Giliham, P.: Silver staining of nucleolar organizer regions in malignant melanoma and melanoic nevi. Hum. Pathol.
20:257-262, 1989.
18) Smith, R. and Crocker, J.: Evaluation of nucleolar organizer region- associated proteins in breast malignancy. Histopathol. 12:113-121,
1988.
19) Ogura, S., Abe, S., Sukoh, N., et al.: Correlation between nucleolar organizer regoins visualized by silver staining and the growth rate in
lung adenocarcinoma. Cancer 70:63-68, 1992.
20) Murray, P. G., Blody, D. A. R., Crocker, J., et al.: Sequential demon- stration of antigens and AgNORs in frozen and paraffin sections. J.
Pathol. 159:169-172, 1989.
21) WHO: The World Health Organization histologic typing of lung tumors. Am. J. Clin. Pathol. 77:123-136, 1982.
22) Schutte, B., Reynorlders, M. M. J., Bosman, F. T., et a!.: Flow cytometric determination of DNA ploidy level in nuclei isolated from
paraffin-embedded tissue. Cytometry 6:26-30, 1985.
23) Vindelov, L. L., Christensen, I. J. and Nissen, N. I.: A detergent- trypsin method for the preparation of nuclei for flow cytometric DNA
analysis. Cytometry 3:323-327, 1983.
24) Yoshida, K.: A study of sequential demonstration of nucleolar orga- nizer regions and PCNA immunolabelling in colorectal carcinomas.
Acta Med. Nagasaki 38:15-20, 1993.
25) Smith, F. G., Murray, P. G. and Crocker, J.: Correlation between PCNA and AgNOR scores in non-Hodgkin's lymphomas using se-
quential staining technique. J. Clin. Pathol. 46:28-31, 1993.
26) Cibas, E. S., Melamed, M. R., Zaman, M. B., et al.: The effect of tumor size and tumor cell DNA content on the survival of patients
with Stage I adenocarcinoma of the lung. Cancer 63:1552-1556, 1989.
27) Carp, N. Z., Ellison, D. D., Brophy, P. F., et al.: DNA content in correlation with postsurgical stage in non-small cell lung cancer. Ann.
Thorac. Surg. 53:680-683, 1992.
28) Schmidt, R. A., Rusch, V. W. and Piantadosi, S.: A flow cytometric study of non-small cell lung cancer classified as T1NO. Cancer
69:78-85, 1992.
29) Teodori, L., Tirindelli-Danesi, D., Mauro, F., et al.: Non-small-cell
lung carcinoma: Tumor characterization on the basis of flow cytomet- rically determined cellular heterogeneity. Cytometry 4:174-183, 1983.
30) Ljungberg, B., Stenling, R. and Roos, G.; DNA content in renal cell carcinoma with reference to tumor heterogeneity. Cancer 56:503-508,
1985.
31) Kallioniemi, 0., -P.: Comparison of fresh and paraffin-embedded
tissue as starting material for DNA flow cytometry and evaluation of intraturnor heterogeneity. Cytometry 9:164-169, 1988.
32) Listinsky, C. M., Bonfiglio, T. A. and Leary, J.: Variable ploidy of ovarian clear cell carcinomas. Implications for adequacy of tissue
sampling. Analyt. Qaunt. Cytol. 10:21-27, 1988.
33) Beerman, H., Smit, V. T. H. B. M., Kluin. P. M., et al.: Flow cytometric analysis of DNA stemline heterogeneity in primary and
metastatic breast cancer. Cytometry 12:147-154, 1991.
34) Rater, Z., Surtees, P., Tildsley, G., et a!.: The prognostic value of argyrophil nucleolar organizer regions (AgNORs) in colorectal can- cer. Eur. J. Surg. Oncol. 18:37-40, 1992.
35) Sacks, N. P., Crocker, J. and Blarney, R. W.: Silver-stained nucleolar organizer region counts are of no prognostic value in primary breast
cancer. Eur. J. Surg. Oncol. 18:98-102, 1992.
36) Kakeji, Y. and Sugimachi, K.: Predictive value of Ki-67 and argyro- philic nucleolar organizer region staining for lymph node metastasis in
gastric. cancer. Cancer Res. 51:3503-3506, 1991.
37) Janmohamed, R. M. I., Murray, P. G., Crocker, J., et al.: Sequential demonstration of nucleolar organizer regions and Ki-67 immunolab-
elling in non-Hodgikin's lymphomas. Clin. Lab. Haemat. 12:395-399,
1990.