学 位 論 文
論 文 題 目
Normal developmen t of human brain wh it e matter from inf an cy to early adulthood: a diff us ion tensor imagin g study
( 乳 児 期 か ら 成 人 早 期 に お け る 脳 白 質 構 造 の 発 達 変 化 : 拡 散 テ ン ソ ル 画 像 に よ る 検 討 )
生 命 融 合 科 学 教 育 部 博 士 課 程 認 知 ・ 情 動 脳 科 学 専 攻
氏 名 宇多 聡
Abstract
Diffusion tensor imaging (DTI), which measures the magnitude of anisotropy of water diffusion in white matter, has recently been used to investigate neural tract fibers connecting brain regions.
DTI enables researchers to visualize and quantify parameters of neural tract fibers. In order to investigate the developmental change, sex, and hemispheric differences of neural tract fibers in normal white matter, we used DTI to examine 52 healthy humans ranging from two months to 25 years of age. We extracted the following tracts of interest (TOIs) using the region of interest (ROI) method: the corpus callosum (CC), cingulum hippocampus (CGH), inferior longitudinal fasciculus (ILF), and superior longitudinal fasciculus (SLF), and measured fractional anisotropy (FA), apparent diffusion coefficient (ADC), axial diffusivity (AD), and radial diffusivity (RD).
Approximate values and growth change rates of all DTI parameters at each age were calculated and analyzed using locally weighted scatterplot smoothing (LOESS). We found that for all TOIs, FA increased with age, whereas ADC, AD, and RD values decreased with age. The turning point of growth change rates was about 6 years. FA in the CC was greater than that in the SLF, ILF, and CGH. Moreover, FA, ADC, and AD of the splenium of the CC (sCC) were greater than in the genu of the CC (gCC), whereas RD of sCC was lower than gCC’s. FA of right hemisphere TOIs was significantly greater than that of the left hemisphere TOIs. In infants, growth change rates of both FA and RD were larger than those of AD. Our data shows that developmental patterns differ by TOIs and myelination along with the development of white matter can be mainly expressed as an increase in FA together with a decrease in RD. These findings clarify the long-term normal developmental characteristics of white matter microstructure from infancy to early adulthood.
Keywords: Diffusion tensor imaging, Neural tract fiber, Infant, Neurodevelopment, Fractional anisotropy, Radial diffusivity, myelination, corpus callosum, superior longitudinal fasciculus
Introduction
In humans, psychomotor function develops explosively during infancy. Previous brain imaging studies on developmental processes have frequently examined morphological development using magnetic resonance imaging (MRI). Using MRI data from humans aged 4 to 21 years, Giedd et al. [1] found that gray matter volume increases nonlinearly while white matter volume increases linearly. Subsequently, MRI data from 0 to 10 year-olds revealed a growth spurt period in which both white and gray matter volumes increase sharply for 2 years after birth [2]. After 2 years of age, white matter volume increases more than gray matter. By measuring the volumetric changes of the brain after birth and in 1 and 2 year-olds using MRI, the volume of whole gray matter was discovered to increase by 108% from birth to 1 year of age and by 19% from 1 to 2 years of age;
moreover, from 1 to 2 years of age, the frontal and temporal lobes increased more substantially than other areas of the brain [3]. Furthermore, Tanaka et al. [4] recently investigated the
developmental process of gray matter volume in the frontal and temporal lobes from 1 month to 25 years of age and found that there were two peaks: a significant volume increase at the growth spurt period for 2 years (first peak) and a volume decrease during 8.5 and 11.6 years (second peak). On the other hand, white matter volume in both regions kept increasing along with aging.
Recent studies have started to adopt diffusion tension imaging (DTI), in addition to MRI, to explore anisotropy of neural tract fibers (white matter) that connect different brain regions [5].
Water molecules exist abundantly around neural tract fibers in white matter of the cerebrum. By capturing the movements of these molecules, DTI can indicate the orientation of neural tract fibers [6,7]. DTI can quantitatively characterize the brain using a series of parameters that describe the diffusion in tissues [8]. With DTI, the white matter consisting of neural fibers such as the mature corpus callosum and pyramidal tracts results in larger fractional anisotropy (FA)
values. On the other hand, gray matter yields smaller FA values. DTI can be analyzed in six main methods: setting the region of interest (ROI) based on known brain anatomy of the retrieved image; using tract specific analysis (TSA) or tract of interest (TOI) to analyze the quantitative values of specific neural tract fibers visually extracted by diffusion tensor tractography (DTT);
using voxel-based morphometry (VBM) that calibrates an area with a template brain to image the statistical analysis of the whole brain; and using tract-based-spatial statistics (TBSS) to image the statistical analysis of nearly all of the white matter by creating a skeleton of white matter [9]. In the current study, we extracted TOIs using the ROI method.
In recent years, numerous DTI studies (see Yap et al. [10] for a review) have reported developmental brain processes. Hermoye et al. [11] used the ROI method to investigate the developmental characteristics of neural tract fibers in newborn infants until 54 months and found that there were three phases of FA of white matter tracts: radical change from birth to 1 year, gradual change from 1 to 2 years, and a stable phase after 2 years. With a population between 8 and 85 years, TBSS and locally weighted robust scatterplot smoothing (LOESS) for statistical analysis estimated the ages of maximal FA value of the whole brain as 29.1 years, minimal apparent diffusion coefficient (ADC) as 35.7 years, and minimal radial diffusivity (RD) as 31.1 years [12]. These results demonstrated a sharp developmental increase of FA and reduction of both ADC and RD before adulthood, followed by a period of relative stability in adulthood, and subsequently an accelerated decrease of FA and increase of both ADC and RD in senescence [12].
This study also investigated the relationship between brain volume and DTI parameters and showed that the estimated age of maximal FA value of the whole brain was 29.1 years-old, whereas the estimated age of maximal white matter volume was 50.1 years-old, resulting in a difference of 20 years, suggesting that white matter volume and FA value are independent indices
[12]. However, none of the previous DTI studies directly shown the developmental characteristics over a wide age range that included infancy.
Therefore, the purpose of this study was to quantify normal developmental characteristics of the brain white matter tract from infancy to early adulthood and to examine developmental differences including sex and laterality differences among various fibers [cingulum hippocampus (CGH), inferior longitudinal fasciculus (ILF), superior longitudinal fasciculus (SLF), and corpus callosum (CC)]. We selected the CC as a model commissural fiber, the ILF and SLF as model association fibers, and the CGH as a model limbic fiber. The spatial development of white matter in healthy children younger than 2 years progresses from the central to the peripheral white matter and the CC has the highest FA followed by the cortical-spinal tract, optic radiation, and posterior limb of internal capsule; the lowest FA is in the peripheral white matter area [13]. The age to reach 90% of maximum FA proceeded chronologically first in the ILF, splenium of corpus callosum (sCC), genu of corpus callosum (gCC) and lastly SLF[14]. Furthermore, ADC reached 110% of the minimum value in the sCC a year before it did in the gCC [14].
In terms of sex differences in DTI, findings have been inconsistent [14-19]. For instance, Lebel et al. [14] revealed only minor sex differences in developmental trajectories of both FA and ADC. For age-related FA changes between sexes, the time to reach 90% of maximum FA value of each TOI were smaller than the standard error of the measurement. Girls of 5–18 years displayed larger FAs than boys in the sCC but boys displayed larger FAs than girls in bilateral frontal white matter areas, the right arcuate fasciculus, and left parietal and occipito-parietal white matter [18]. On the other hand, boys displayed greater ADC on the bilateral corticospinal tract and the right frontal lobe. Regarding hemispheric difference, studyingthe anterior thalamic radiation, dorsal cingulum bundle, the parahippocampal cingulum bundle, the corticospinal tract,
the uncinate fasciculus, the ILF, and the SLF revealed that FA, ADC, and RD values were strongly correlated between hemispheres [12]. In addition, hemispheric differences were
observed in six of 15 TOIs, such that the FAs of the right ILF and SLF were greater than the left, and FA of the left sCC was greater than the right [20]. Again studying FA, the temporo-parietal part of the arcuate fasciculus showed a right asymmetrical trend in adults only, while the
fronto-temporal part of the arcuate fasciculus was symmetrical in both children and adults [21].
Based on previous developmental DTI studies [10], we hypothesized that FA of white matter in main fiber tracts would increase with age and ADC, AD, and RD would decrease with age and that changes would occur most dramatically during infancy. Second, we hypothesized that commissural fibers would develop initially, followed by limbic and then association fibers.
Third, we hypothesized that FA of the CC, as a commissural fiber, would be greater than other fibers. Furthermore, developmental changes of the CC would be different between the gCC (anterior CC) and the sCC (posterior CC). In addition, we also explored sex and laterality differences since there has been no consensus so far.
Materials and Methods Participants
The MRI and DTI data were collected between May 2009 and April 2010. Participants included 54 healthy and normal Japanese subjects (21 females and 33 males; age range, 2 months to 25 years; mean age ± SD = 105.8 ± 82.9 months). The child participants were the children of employees of the university hospital, the children of parents attending a community public lecture on nurturing, and children attending schools in the Kureha region of Toyama City. All the
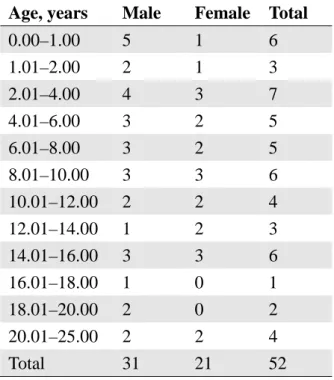
children were born full-term (gestational age ranged between 37–41 weeks). Participants older than 18 years old were students recruited from the University of Toyama. All the participants were screened with interviews and a health questionnaire, and showed no evidence of health issues or abnormal neurological development. All the participants had a body weight within the normal range and were right-handed. We fully explained the purpose and procedures of the study to the participants and obtained written informed consent from them (or from their parents if they were under 18 years old). In the data analysis, we used the images of 52 (21 females and 31 males) out of 54 participants because we discarded the two scanned images that had very large artifacts due to head movements. Table 1 shows distribution of the age and sex of the participants.
This study was reviewed and approved by the Research and Ethics Committees of the University of Toyama.
Imaging Acquisition
Data were acquired on a 1.5-Tesla Magnetom Vision scanner (Siemens Medical Systems, Inc., Erlangen, Germany), with actively shielded magnetic field gradients (maximum amplitude = 25 mT/m). Each DTI was acquired with echo planar imaging (EPI) sequence in the axial direction parallel to the AC-PC (anterior commissure-posterior commissure) line. The acquisition
parameters were as follows: echo time (TE) = 100 ms; repetition time (TR) = 4,000 ms; number of excitations = 4; b = 0 and 1000 s/mm2 along six noncollinear directions; acquisition matrix = 128 × 128, native voxel dimensions = 1.875 × 1.875 × 5 mm (reconstruction matrix = 256 × 256, voxel resolution = 0.9375 × 0.9375 × 5 mm); field of view (FOV) = 240 mm; 20 contiguous 5-mm slices without gap. Movement-related artifacts were minimized by keeping the
participants' heads still with foam cushions and an elastic forehead strap, and images with large
motion artifacts were removed from the analysis.
Data Processing
The DTI datasets were transferred to a Windows PC and processed using the analysis software Analyze11.0 (MAYO Foundation, Minnesota, US). First, the DICOM files of each DTI
acquisition were converted into a single multivolume analyze format by MRIcro [22] then corrected for eddy currents by FSL (Oxford Centre for Functional MRI of the Brain [FMRIB]).
FA maps were calculated for all subjects using Analyze11.0 with voxel dimensions = 0.9375 × 0.9375 × 0.9375 mm using 3D-spline interpolation. In the DTI color maps, red, green, and blue colors were assigned to right-left, anterior-posterior, and superior-inferior directions,
respectively.
DTI parameters
We used 4 typical DTI parameters: FA, ADC, axial diffusivity (AD), and RD. FA shows the magnitude of anisotropy ranging from 0.0 to 1.0. ADC is the magnitude of diffusion of water molecules in each voxel, and AD is considered to be the diffusion parallel with the orientation of neural tract fibers. RD is an index of the diffusion orthogonal to AD. ADC may also be
represented by (AD + 2 × RD)/3.
Fiber Tracking and Regions of Interest (ROI) Drawing
We used a well-established method for image quantification by manually placing a ROI on the anatomical structure and quantifying the structural size or pixel values. This approach is usually hypothesis-driven, that is, there is a pre-defined set of ROIs to capture a specific disease status
[23]. For 3D tract reconstruction, the fiber assignment by continuous tracking or the FACT method [24,25] was used with an angle stop threshold of 90 degrees and a fiber length threshold of 0.9375 mm. FA start threshold and FA stop threshold are the same value and are set for each subject's ROI. We visually checked the neural fiber tract displayed on the screen with a MRI Atlas of Human White Matter [26].
The CGH, ILF, and SLF in the left and the right hemispheres were traced in reference to Wakana et al. [27] and Analyze 11.0. The sCC and gCC were drawn using ROIs and Analyze11.0.
GCC and sCC ROIs at the center of the anterior and posterior CC had an in-plane size of 4 × 4 mm2 [28]. The body of the CC can easily be reconstructed, but it was challenging to define a specific protocol to reproducibly identify 2D slices for ROI drawing [27]. We defined the CC using a manual tracing manual on Analyze11.0 and referencing the MRI Atlas of Human White Matter [26]. From these neural fiber tracts, FA, ADC, AD, and RD value indices were calculated with Analyze11.0.
The protocol by Wakana et al. [27], known for its high reproducibility, provides a precise procedure to extract major white matter tracts. The sensitivity of the ROI method is high, and it does not require registration because all neural tract fibers were manually traced for each region in this study. Moreover, the ROI method allows for specific analysis of fibers. We set ROIs for each neural tract fiber and investigated the developmental characteristics and its differences for each ROI, sex, and hemisphere based on DTI parameters such as FA and ADC values calculated by imaging analysis software.
In order to examine inter-rater reliability, participants were divided into two groups, using 6 years as a cutoff between infants and adults. Inter-rater reliability was examined in a sample of 10 DTIs selected at random (five persons under 6 years old and five persons over 6 years, female
to male = 3:7). These were analyzed independently by five raters (S.U., C.T., M.K., K.M., and I.K.). Intra-class correlations of FA values ranged from 0.80 to 0.92 for the CGH, 0.80 to 0.94 for the ILF, 0.96 to 0.98 for the SLF, and 0.99 for the gCC, sCC, and CC. Intra-rater reliability was also examined in the same 10 DTIs analyzed by S.U., and the correlations for all the ROIs ranged from 0.80 to 0.99. S.U. then completed the analysis of the remaining scans.
Statistical Analysis
F tests in regression analyses of linear, quadratic, and cubic models were used to determine
whether age in months is related to FA, ADC, AD, and RD changes of the gCC, sCC, CC, left CGH, right CGH, left ILF, right ILF, left SLF and right SLF, with the sample divided into female and male groups. The R2 values were used to decide which linear or nonlinear model best
characterized the development of each region.
We calculated an approximate value of all data by using the LOESS. In addition, from the LOESS data, the differentiation rate (growth change rate) in each month was calculated and graphed: Growth change rate = (an approximate value of present month-an approximate value of past month)/(an approximate value present month) × 100. LOESS can compute and
smoothly plot the points with little effort and computer load so that the visual information on a scatterplot can be highly precise [27]. Robust locally weighted regression is a method for smoothing a scatterplot, (xi, yi), i = 1, …, n, in which the fitted value at xk is the value of a polynomial fit to the data using weighted least squares, where the weight for (xi, yi) is large if xi
is close to xk and small if it is not [28]. A robust fitting procedure is used that guards against deviant points distorting the smoothed points [29].
Maximum development was defined as the FA and ADC at the maximum values of LOESS
data, and the time to reach 90% of this maximum development was calculated for each TOI similar to Lebel et al. [14].
First, analyses of variance (ANOVAs) were performed to test the effects of age, sex and TOI for each DTI parameter (FA, ADC, AD, and RD). The factors were age group (infants, children, adolescents/adults) and sex (female, male) as the between-subject factors, and TOIs (CC, CGH, ILF, SLF) as the within-subject factors. To assess different stages of development, we defined three age groups: infants (age < 6 years) of 21 participants, children (6 years < age < 10 years) of 11 participants and adolescents/adults (age > 10 years) of 20 participants. These age ranges were based on growth change rate at 6 years old (turning point of growth change rate in this study) and findings of peak age (around 10 years old) in brain volume reported by our earlier MRI work [4,30]. Second, ANOVAs were performed to test the effects of hemisphere, sex, TOI (CGH, ILF, SLF), and age group. Third, ANOVAs were performed to test the effects of parts of CC (gCC, sCC), sex, and age group.
We defined statistical significance as p < 0.05 significant. To prevent a possible Type-I error due to multiple tests, Bonferroni corrections were applied for correlation analyses. Each effect size (η2 π) was also calculated.
Results
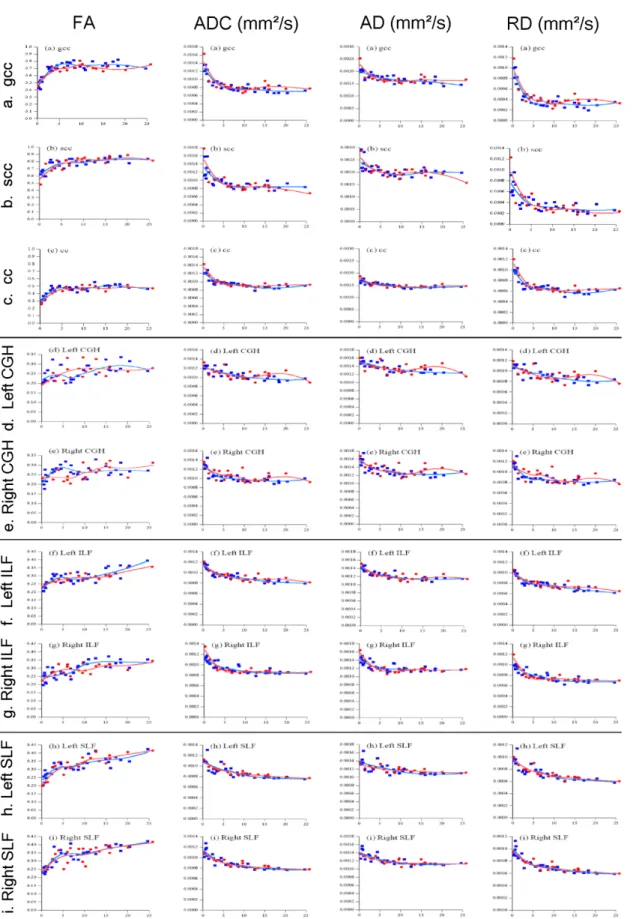
We examined the DTI parameters in association with age. Figure 2 shows the values of FA, ADC, AD, and RD for each TOI (i.e., neural tract fibers of white matter) and their estimated values (derived from the LOESS).
Estimated curves for DTI parameters of the CC, CGH, ILF, and SLF
Regression analyses revealed that age in months was significantly related to FA, ADC, AD, and RD changes in the gCC, sCC, CC, left CGH, right CGH, left ILF, right ILF, left SLF, and right SLF for linear, quadratic, and cubic models (all p values < 0.01). The R2 values were highest for the cubic model for every region of each DTI parameter. Table 2 shows the results of the cubic model for each TOI of DTI parameters.
Growth changes
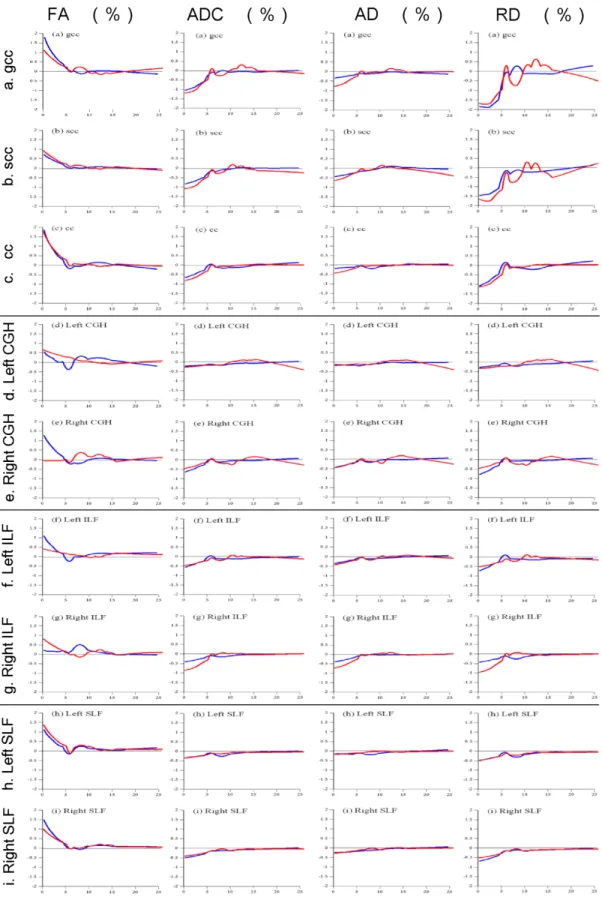
As shown in Figure 2, in each neural tract fiber in both males and females, FA increased between 0 and 6 years for each TOI, and subsequently all of them plateaued, except in the female right CGH. ADC, AD, and RD decreased between 0 and 6 years for each TOI, and subsequently all of them plateaued as well. Growth change rates are shown in Figure 3. Growth change rate of FA decreased between 0 and 6 years for each TOI except in the female right CGH, and the growth change rate was nearly zero after 6 years (range of the growth change rate range at 6 years:
-0.322% to 0.259%). Growth change rate of ADC, AD, and RD for each TOI increased as age increased from 0 to 6 years, and after 6 years, the growth change rate became almost zero (the growth change rate at 6 years: -0.237% to 0.302%). Between 0 and 6 years, the growth change rate (max: -1.832%) of RD for TOIs in both hemispheres was larger than AD (max: -0.771%) in both males and females. Pearson mutual correlation coefficients of each parameter (FA, ADC, AD, and RD) were significant (p < 0.01) as follows at absolute values: gCC: r = 0.709–0.984;
sCC: r = 0.614–0.971; CC: r = 0.712–0.991; CGH: r = 0.322–0.988; ILF: r = 0.435–0.988; and SLF: r = 0.537–0.988.
The ages to reach 90% of maximum FA were as follows: gCC: 3.2; CC: 3.6; sCC: 4.1;
CGH: 8.2; SLF: 16.1; and ILF: 16.6 years. The ages for ADC were as follows: CC: 4.4; gCC:
4.9; ILF: 5.3; CGH: 5.8; SLF: 8.6; and sCC: 18.3 years.
Comparisons of tracts (CC, CGH, ILF, and SLF) among age groups
ANOVAs were conducted to test the effects of age groups (infants, children, and
adolescents/adults) by sex and TOIs (CC, CGH, ILF, and SLF). Left and right values of the CGH, ILF, and SLF were summed and averaged. The results for FA revealed significant main effects of TOI [F(3,44) = 299.434, p < 0.001, η2 p = 0.953] and age [F(2,46) = 20.547, p < 0.001, η2 p = 0.472], although there was no significant main effect of sex [F(1,46) = 0.017, p = 0.895, η2 p<
0.001]. Post hoc multiple comparisons revealed significant differences for each TOI (p < 0.001 for all combinations, CC > SLF > ILF > CGH; Bonferroni corrected) and for ages (infants <
children, p = 0.018; infants < adolescence/adults, p < 0.001; children < adolescence/adults, p = 0.041; Bonferroni corrected).
There was no significant three-way interaction of TOI, age, and sex [F(6,90) = 0.918, p = 0.486, η2 p= 0.058]; however, there was a significant two-way interaction of TOI and age [F(6,90) = 3.795, p = 0.002, η2 p= 0.202]. As shown in Figure 4, post hoc comparisons with Bonferroni correction revealed that there were significant differences in the CC between infants and children (p = 0.023) and between infants and adolescents/adults (p < 0.001). There were significant differences in the CGH between infants and adolescents/adults (p < 0.001) and between children and adolescents/adults (p = 0.041). For the ILF, significant differences were found between infants and adolescents/adults (p < 0.001) and between children and adolescents/adults (p = 0.003). For the SLF, we found significant differences between infants and children, infants and
adolescents/adults, children and adolescents/adults (p = 0.010, p < 0.001, p = 0.013, respectively).
ADC showed significant main effects of TOI [F(3,44) = 102.588, p < 0.001, η2 p = 0.875]
and age [F(2,46) = 33.907, p < 0.001, η2 p = 0.596]; however, there was no main effect of sex [F(1,46) = 0.015, p = 0.902, η2 p < 0.001]. There was no significant three-way interaction of TOI, age, and sex [F(6,90) = 0.669, p = 0.675, η2 p= 0.043]; and there was no significant two-way interaction of TOI and age [F(6,90) = 1.142, p = 0.344, η2 p= 0.071].
AD showed significant main effects of TOI [F(3,44) = 659.223, p < 0.001, η2 p = 0.978]
and age [F(2,46) = 35.948, p < 0.001, η2 p = 0.610]; however, there was no main effect of sex [F(1,46) = 0.057, p = 0.813, η2 p = 0.001]. There was no significant three-way interaction of TOI, age, and sex [F(6,90) = 1.002, p = 0.429, η2 p= 0.063]; and there was no significant two-way interaction of TOI and age [F(6,90) = 0.417, p = 0.866, η2 p= 0.027].
RD showed significant main effects of TOI [F(3,44) = 167.888, p < 0.001, η2 p = 0.920]
and age [F(2,46) = 30.605, p < 0.001, η2 p = 0.571]; however, there was no main effect of sex [F(1,46) = 0.005, p = 0.944, η2 p = 0.001]. There was no significant three-way interaction of TOI, age, and sex [F(6,90) = 0.613, p = 0.719, η2 p= 0.039]; and there was no significant two-way interaction of TOI and age [F(6,90) = 1.723, p = 0.125, η2 p= 0.103].
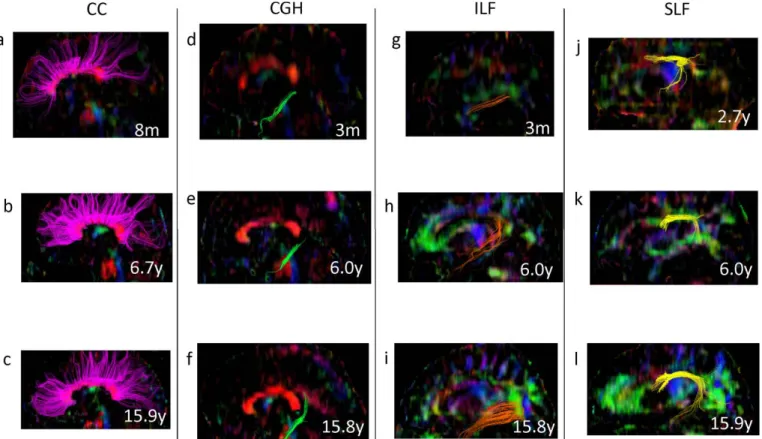
Figure 5 shows typical samples of each TOI extracted from DTI in each group using Volume One 1.72 software (http://www.volume-one.org/).
Comparisons of CC regions among age groups
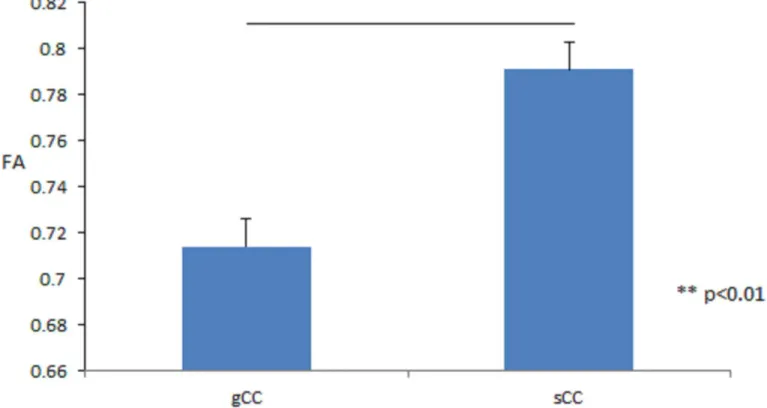
ANOVAs were conducted to test the effect of CC ROI (the gCC and sCC) in three age groups (infants, children, and adolescents/adults) by sex. The results for FA revealed significant main effects of CC ROI [F(1,46) = 72.323, p < 0.001, η2 p = 0.611, gCC < sCC], as shown in Figure 6, and age group [F(2,46) = 16.789, p < 0.001, η2 p = 0.422, infants < children ≈ adolescents/adults], although there was no significant main effect of sex [F(1,46) = 0.001, p = 0.978, η2 p < 0.001].
There were no significant interactions between CC ROI, age, and sex.
ADC showed significant main effects of CC ROI [F(1,46) = 19.990, p < 0.001, η2 p = 0.303, gCC < sCC] and age [F(2,46) = 16.183, p < 0.001, η2 p = 0.413, infants < children ≈
adolescents/adults]; however, there was no main effect of sex [F(1,46) = 0.071, p = 0.790, η2 p = 0.002]. There were no significant interactions between CC ROI, age, and sex.
AD also showed significant main effects of CC ROI [F(1,46) = 133.965, p < 0.001, η2 p = 0.744, gCC < sCC] and age [F(2,46) = 12.566, p < 0.001, η2 p = 0.353, infants < children ≈ adolescents/adults]; however, there was no main effect of sex [F(1,46) = 0.257, p = 0.615, η2 p = 0.006]. There were no significant interactions between CC ROI, age, and sex.
RD showed significant main effects of CC ROI [F(1,46) = 6.771, p = 0.012, η2 p = 0.128, sCC < gCC] and age [F(2,46) = 15.830, p < 0.001, η2 p = 0.408, infants < children ≈
adolescents/adults]; however, there was no main effect of sex [F(1,46) = 0.015, p = 0.902, η2 p <
0.001]. There were no significant interactions between CC ROI, age and sex.
Comparisons of hemisphere among age groups
ANOVAs were conducted to test the effects of hemisphere in the three age groups (infants, children, and adolescents/adults) by sex and left-right TOIs (CC, CGH, ILF, and SLF). The results for FA revealed significant main effects of hemisphere values [F(1,46) = 4.995, p = 0.030,
η2 p = 0.098]. The right FA value (0.302) was larger than the left FA value (0.296) (Fig. 7). There were no significant main effects of hemisphere in ADC, AD, and RD values.
Discussion
Using DTI, we investigated developmental changes of white matter fibers from 2 months to 25 years. The regression analyses showed all FA values of main neural tracts increased with age (anisotropy became larger), while ADC, AD, and RD values decreased with age (visualized diffusion magnitude became smaller). The estimated developmental trajectory models were best characterized as cubic for all four neural tracts (CC, SLF, ILF, and CGH) regardless of sex and hemisphere. These results are consistent with previous studies (see Yap et al. [10] for review), showing developmental changes of neural tract fibers in white matter. Increasing FA as well as decreasing ADC, AD, and RD may result from decreasing water quantity and myelination of fiber tracts [23], as well as thickening diameters of fiber tracts [31] concomitant with white matter development. Furthermore, we found that changes were greatest during infancy.
Together with previous findings that described an initial and sharp increase up to 2 years of age in FA, which is stable in adulthood and subsequently decreases with senescence along with an increase in ADC and RD [11,12], we propose that fiber tracts undergo intense development until 6 years of age.
We found that the growth change rate showed a positive value for FA and negative values for ADC, AD, and RD during infancy. At 6 years, the growth change rate of FA, ADC, AD, and RD became almost zero depending on the growth change rate curves. Therefore, we suggest a turning point of growth change rates of about 6 years as most axons of main neural tract fibers
would mature by 6 years. In infants, the growth change rate of not only FA but also RD was larger than AD. In addition to the growth change rate, since RD has twice the impact of AD on the calculation of ADC, the change of RD along with FA depends more on the development of white matter than on changes of AD. In terms of FA, three-dimensional ellipses that represents the trajectory of the movement of water molecules that are small at birth (small anisotropy) and behave like ball-shaped molecules keep their long axis (AD), whereas the other two short axes (RD) decrease along with development. Thus, this change results in larger anisotropy and observed magnitudes of diffusion become smaller. Seo et al. [33] reported the age-related
increases in FA were caused by decreases in RD, and there were no age effects in AD. Rose et al.
[34] asserted that myelination is best represented by RD as diffusion perpendicular to the axons becomes more restricted by myelin. These findings suggest that the myelination process in healthy individuals can be primarily expressed as the decrease in RD along with an increase in FA.
TOIs reached 90% of their maximum FA values in the following chronological order: the gCC, CC, sCC, CGH, SLF, and ILF. We found that FA of the CC was the highest, followed by the SLF, ILF, and lastly the CGH. The results suggest that white matter develops from
commissural fibers (CC) to limbic fibers (CGH) and finally to association fibers (SLF and ILF).
Furthermore, in the CC, FA, ADC, and AD were greater in the sCC than in the gCC, and RD of the sCC was less than the gCC. These findings suggest the CC develops in a rostral-to-caudal manner. White matter develops from central regions (the CC), followed by the corticospinal tract, posterior limb of internal capsule, and optic radiation to peripheral regions (posterior peripheral white matter and frontal peripheral white matter) [13]. Moreover, while FA of the CC increases sharply after birth, association fibers develop later [11], and FA increases to a greater extent
during infancy in central fibers (gCC, sCC and posterior limb of the internal capsule) compared to peripheral white matter fibers (superior frontal gyrus and superior parietal lobule) [32].
Although each study selected different TOIs, our present results from 2 months to 25 years are consistent with the following principles of developmental order of neural tracts and suggest that each TOI has a different developmental pattern. First, white matter follows a
central-to-peripheral direction of chronological maturation during infancy [32]. Second, gray matter volume decreases with maturation of the human brain in a back-to-front direction between 4 to 21 years [35]. Limbic fibers are well-developed in the early phase of development, while association fibers mature at a later stage [11]. Overall, during human brain maturation, myelination proceeds in a posterior-to-anterior direction [36].
Interestingly, we found no sex-related differences in any DTI parameter. Conversely, previous reports described larger FA values in males in 6 out of 12 fibers (body of the CC, SLF, uncinate fasciculus, corticospinal tract and cingulum), while FA was lower in the ILF;
nonetheless, the differences were not salient [16]. Moreover, sex differences in developmental trajectories of both FA and ADC were only minor [14]. On the other hand, Schmithorst et al. [18]
showed that girls of 5–18 years old displayed higher FA than boys in the sCC and boys displayed higher FA than girls in bilateral frontal white matter areas, in the right arcuate fasciculus, and in left parietal and occipito-parietal white matter. Thus, sex differences for DTI parameters are controversial, with studies following narrower age ranges reporting very mixed results [16] that may depend on the TOI [14-19]. To resolve these issues, we require greater spatial and angular resolution data for more reliable TOI analyses.
Regarding hemispheric differences, there were no significant left-right differences in AD, ADC, and RD. However, we found that FA of right hemisphere TOIs were significantly larger
than their respective left hemisphere TOIs. Hemispheric differences were observed in six of 15 TOIs [20], namely FA of the right ILF and SLF was greater than the left, and the left sCC was greater than the right [20]. In addition, the arcuate fasciculus shows a right-sided asymmetry in the temporo-parietal area in adults, while no asymmetry is seen in both children and adults in the fronto-temporal area [21]. Hemispheric specificity of DTI parameters have been inconsistent, nevertheless the present study suggests that FA of right-sided TOIs is greater than left-sided TOIs.
To resolve these issues, we require greater spatial and angular resolution data for more reliable TOI analyses.
There are several limitations of this study. Since we acquired DTI sections of 5 mm in thickness, neural fibers with large curvature such as the uncinate fasciculus and neural fibers without vertical elasticity like the cingulum were difficult to extract. With the development of DTI data extraction technology, future studies can examine the neural tract fibers that were not extracted here. The right CGH of females did not increase during infancy and this finding may be due to the small number of female participants of infancy. The TBSS constructs a skeleton and thus the FA map of each subject does not need to be accurately matched with the template brain and does not require spatial smoothing. However, it is not suited for the analysis of infant brains.
Future studies are expected to develop automated methodology to analyze whole brain including infant brains. Additional studies are needed to examine the relationship between FA and the white matter volume. In the future, it may be possible to quantitatively compare developmental disorders and psychiatric diseases. Data from infants have clinical implications in the diagnosis of disabilities such as cerebral palsy [11], and data from young adults with abnormalities in neural tract fibers may be useful for diagnosing autism spectrum disorder [37] and schizophrenia [38] in early adulthood.
In summary, the present cross-sectional research used DTI to examine normal human white matter development from 2 months to 25 years. Regardless of sex and hemisphere, the estimated developmental trajectory models were best characterized as cubic for all of 4 main neural tracts.
FA increased whereas ADC, AD, and RD decreased with age. Turning point of growth change rates was at about 6 years and the growth change rate of both FA and RD was larger than AD during infancy, so the myelination process of healthy individuals can be primarily expressed as both FA and RD. While we find differences in the progress of myelination of different tracts along with hemispheric difference, our results suggest no sex differences at a young age. These findings would be useful to understand the long-term normal developmental characteristics of white matter microstructure from infancy to early adulthood.
Acknowledgments
This study was supported by Grant-in-Aid for Scientific Research (B) 20330141 and
Grant-in-Aid for Scientific Research on Innovative Areas 26118707 from the Japan Society for the Promotion of Science (JSPS) and JSPS Asian Core Program. We thank Dr. Jun Miyata at Kyoto University, Takatoshi Hoshino and Professor Masaaki Tsuda at the University of Toyama, and Dr. Keigo Shimoji in Department of Radiology, Juntendo University (Comprehensive Brain Science Network) for their assistance with this work.
Author Contributions
Conceived and designed the experiments: SU MM. Performed the experiments: CT KN MM.
Analyzed the data: SU MK CT KM IK. Contributed reagents/materials/analysis tools: CT SU KN. Wrote the paper: SU MM. Supervised the overall research project: MM.
References
1. Giedd JN, Blumenthal J, Jeffries NO, Castellanos FX, Liu H, et al. (1999) Brain development during childhood and adolescence: a longitudinal MRI study. Nat Neurosci 2: 861-863.
2. Matsuzawa J, Matsui M, Konishi T, Noguchi K, Gur RC, et al. (2001) Age-related volumetric changes of brain gray and white matter in healthy infants and children. Cereb Cortex 11:
335-342.
3. Gilmore JH, Shi F, Woolson SL, Knickmeyer RC, Short SJ, et al. (2012) Longitudinal development of cortical and subcortical gray matter from birth to 2 years. Cereb Cortex 22:
2478-2485.
4. Tanaka C, Matsui M, Uematsu A, Noguchi K, Miyawaki T (2012) Developmental trajectories of the fronto-temporal lobes from infancy to early adulthood in healthy individuals. Dev
Neurosci 34: 477-487.
5. Filley CM (2009) Exploring white matter microstructure: new insights from diffusion tensor imaging. Neurology 73: 1718-1719.
6. Basser PJ, Mattiello J, LeBihan D (1994) Estimation of the effective self-diffusion tensor from the NMR spin echo. J Magn Reson B 103: 247-254.
7. Catani M, Howard RJ, Pajevic S, Jones DK (2002) Virtual in vivo interactive dissection of white matter fasciculi in the human brain. Neuroimage 17: 77-94.
8. Underhill HR, Yuan C, Yarnykh VL (2009) Direct quantitative comparison between
cross-relaxation imaging and diffusion tensor imaging of the human brain at 3.0 T. Neuroimage 47: 1568-1578.
9. Smith SM, Jenkinson M, Johansen-Berg H, Rueckert D, Nichols TE, et al. (2006) Tract-based spatial statistics: voxelwise analysis of multi-subject diffusion data. Neuroimage 31: 1487-1505.
10. Yap QJ, Teh I, Fusar-Poli P, Sum MY, Kuswanto C, et al. (2013) Tracking cerebral white matter changes across the lifespan: insights from diffusion tensor imaging studies. J Neural Transm 120: 1369-1395.
11. Hermoye L, Saint-Martin C, Cosnard G, Lee SK, Kim J, et al. (2006) Pediatric diffusion tensor imaging: normal database and observation of the white matter maturation in early childhood. Neuroimage 29: 493-504.
12. Westlye LT, Walhovd KB, Dale AM, Bjornerud A, Due-Tonnessen P, et al. (2010) Life-span changes of the human brain white matter: diffusion tensor imaging (DTI) and volumetry. Cereb Cortex 20: 2055-2068.
13. Gao W, Lin W, Chen Y, Gerig G, Smith JK, et al. (2009) Temporal and spatial development of axonal maturation and myelination of white matter in the developing brain. AJNR Am J Neuroradiol 30: 290-296.
14. Lebel C, Walker L, Leemans A, Phillips L, Beaulieu C (2008) Microstructural maturation of the human brain from childhood to adulthood. Neuroimage 40: 1044-1055.
15. Abe O, Aoki S, Hayashi N, Yamada H, Kunimatsu A, et al. (2002) Normal aging in the central nervous system: quantitative MR diffusion-tensor analysis. Neurobiol Aging 23: 433-441.
16. Lebel C, Gee M, Camicioli R, Wieler M, Martin W, et al. (2012) Diffusion tensor imaging of white matter tract evolution over the lifespan. Neuroimage 60: 340-352.
17. Ota M, Obata T, Akine Y, Ito H, Ikehira H, et al. (2006) Age-related degeneration of corpus callosum measured with diffusion tensor imaging. Neuroimage 31: 1445-1452.
18. Schmithorst VJ, Holland SK, Dardzinski BJ (2008) Developmental differences in white matter architecture between boys and girls. Hum Brain Mapp 29: 696-710.
19. Schneiderman JS, Buchsbaum MS, Haznedar MM, Hazlett EA, Brickman AM, et al. (2007) Diffusion tensor anisotropy in adolescents and adults. Neuropsychobiology 55: 96-111.
20. Park HJ, Westin CF, Kubicki M, Maier SE, Niznikiewicz M, et al. (2004) White matter hemisphere asymmetries in healthy subjects and in schizophrenia: a diffusion tensor MRI study.
Neuroimage 23: 213-223.
21. Hasan KM, Kamali A, Abid H, Kramer LA, Fletcher JM, et al. (2010) Quantification of the spatiotemporal microstructural organization of the human brain association, projection and commissural pathways across the lifespan using diffusion tensor tractography. Brain Struct Funct 214: 361-373.
22. Rorden C, Brett M (2000) Stereotaxic display of brain lesions. Behav Neurol 12: 191-200.
23. Yoshida S, Oishi K, Faria AV, Mori S (2013) Diffusion tensor imaging of normal brain development. Pediatr Radiol 43: 15-27.
24. Mori S, Crain BJ, Chacko VP, van Zijl PC (1999) Three-dimensional tracking of axonal projections in the brain by magnetic resonance imaging. Ann Neurol 45: 265-269.
25. Xue R, van Zijl PC, Crain BJ, Solaiyappan M, Mori S (1999) In vivo three-dimensional reconstruction of rat brain axonal projections by diffusion tensor imaging. Magn Reson Med 42:
1123-1127.
26. Mori S, Wakana S, Nagae-Poetscher LM, Zijl PCMv (2005) MRI Atlas of Human White Matter. Amsterdam: Elsevier.
27. Wakana S, Caprihan A, Panzenboeck MM, Fallon JH, Perry M, et al. (2007) Reproducibility of quantitative tractography methods applied to cerebral white matter. Neuroimage 36: 630-644.
28. Zhang Y, Schuff N, Jahng GH, Bayne W, Mori S, et al. (2007) Diffusion tensor imaging of cingulum fibers in mild cognitive impairment and Alzheimer disease. Neurology 68: 13-19.
29. Cleveland, W. S. (1979) Robust locally weighted regression and smoothing scatterplots. J.
Amer. Statist. Assoc. 74, 829–836.
30. Uematsu A, Matsui M, Tanaka C, Takahashi T, Noguchi K, et al. (2012) Developmental trajectories of amygdala and hippocampus from infancy to early adulthood in healthy individuals.
PLoS One 7: e46970.
31. Giorgio A, Watkins KE, Chadwick M, James S, Winmill L, et al. (2010) Longitudinal changes in grey and white matter during adolescence. Neuroimage 49: 94-103.
32. Provenzale JM, Liang L, DeLong D, White LE (2007) Diffusion tensor imaging assessment of brain white matter maturation during the first postnatal year. AJR Am J Roentgenol 189:
476-486.
33. Seo Y, Wang ZJ, Ball G, Rollins NK (2013) Diffusion tensor imaging metrics in neonates – a comparison of manual region-of-interest analysis vs. tract-based spatial statistics. Pediatr Radiol 43: 69-79.
34. Rose J, Vassar R, Cahill-Rowley K, Guzman XS, Stevenson DK, et al. (2014) Brain microstructural development at near-term age in very-low-birth-weight preterm infants: an atlas-based diffusion imaging study. Neuroimage 86: 244-256.
35. Gogtay N, Giedd JN, Lusk L, Hayashi KM, Greenstein D, et al. (2004) Dynamic mapping of human cortical development during childhood through early adulthood. Proc Natl Acad Sci USA 101: 8174-8179.
36. Yakovlev PI, Lecours AR (1967) The myelogenetic cycles of regional maturation of the brain.
In: Minkowski A, editor. Regional Development of the Brain in Early Life. Oxford: Blackwell Scientific Publications. pp. 3-70.
37. Travers BG, Adluru N, Ennis C, Tromp do PM, Destiche D, et al. (2012) Diffusion tensor imaging in autism spectrum disorder: a review. Autism Res 5: 289-313.
38. Fitzsimmons J, Kubicki M, Shenton ME (2013) Review of functional and anatomical brain connectivity findings in schizophrenia. Curr Opin Psychiatry 26: 172-187.
0.00–1.00 5 1 6
1.01–2.00 2 1 3
2.01–4.00 4 3 7
4.01–6.00 3 2 5
6.01–8.00 3 2 5
8.01–10.00 3 3 6
10.01–12.00 2 2 4
12.01–14.00 1 2 3
14.01–16.00 3 3 6
16.01–18.00 1 0 1
18.01–20.00 2 0 2
20.01–25.00 2 2 4
Total 31 21 52
Table 2. Results from nonlinear regression analyses with regional DTI parameters as dependent variables and age as an independent variable.
Parameter ROI F value sig
FA gCC 40.0 **
sCC 29.3 **
CC 33.1 **
left CGH 6.65 **
right CGH 4.23 *
left ILF 25.7 **
right ILF 19.3 **
left SLF 37.8 **
right SLF 29.7 **
ADC gCC 47.9 **
sCC 29.3 **
CC 61.3 **
left CGH 17.8 **
right CGH 19.8 **
left ILF 68.3 **
right ILF 47.3 **
left SLF 37.1 **
right SLF 66.2 **
Parameter ROI F value sig
AD gCC 24.2 **
sCC 16.8 **
CC 39.3 **
left CGH 14.6 **
right CGH 16.0 **
left ILF 43.6 **
right ILF 24.8 **
left SLF 15.7 **
right SLF 31.4 **
RD gCC 48.7 **
sCC 29.3 **
CC 53.4 **
left CGH 17.1 **
right CGH 19.5 **
left ILF 66.8 **
right ILF 53.9 **
left SLF 51.9 **
right SLF 73.2 **
NOTE: The R2 values were highest for the cubic model for every region of each DTI parameter. FA, ADC, AD, and RD values for each ROI were derived from the cubic model.
FA = fractional anisotropy, ADC = apparent diffusion coefficient, AD = axial diffusivity, RD = radial diffusivity. gCC = genu of the corpus callosum, sCC = splenium of the corpus callosum, CC = corpus callosum, CGH = cingulum hippocampus, ILF = inferior longitudinal fasciculus, SLF = superior longitudinal fasciculus. df = 3, 48. * p < 0.01, ** p < 0.001.
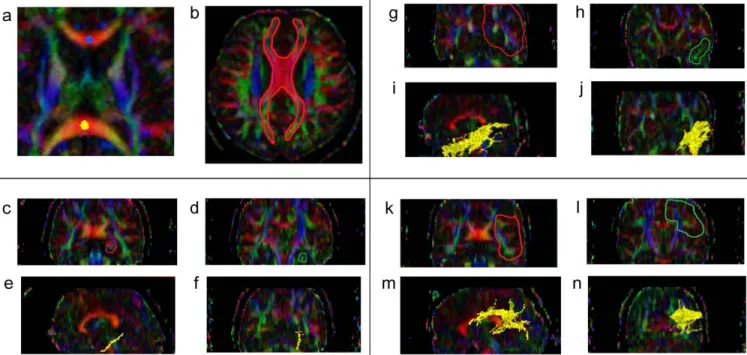
Figure 1. The location of the manually drawn ROIs indicated on the color maps. Blue dot indicates genu corpus callosum (gCC), yellow dot indicates splenium corpus callosum (sCC) (a). Red area denotes the location of the manually drawn corpus callosum (CC) (b). The slices ranging from red to green on coronal slices denote the TOI for the cingulum adjoining the hippocampus (CGH) (c and d). CGH is depicted on both sagittal and coronal slices (e and f). The slices ranging from red to green on the coronal slices indicate the TOI for the inferior longitudinal fasciculus (ILF) (g and h) and it is depicted in yellow (i and j). The slices ranging from red to green on coronal slices indicate the TOIs for the superior longitudinal fasciculus (SLF) (k and l) and it is depicted in yellow (m and n).
Figure 2. Scatter plots by year and sex of each TOI of FA, ADC, AD, and RD values (from left) with locally weighted scatter plot smoothness (LOESS). (a) gCC: genu corpus callosum, (b) sCC: splenium corpus callosum, (c) CC: corpus callosum, (d) Left CGH: left cingulum in the hippocampal part, (e) Right CGH: right cingulum adjoining hippocampus, (f) Left ILF: left inferior longitudinal fasciculus, (g) Right ILF: right inferior longitudinal fasciculus, (h) Left SLF: left superior longitudinal fasciculus, (i) Right SLF: right superior longitudinal fasciculus. Red dots (open lined circles) and lines denote the values of females and blue markers (filled squares) denote males.
Figure 3. The rates of each TOIs monthly growth change. (a) gCC: genu corpus callosum, (b) sCC:
splenium corpus callosum, (c) CC: corpus callosum, (d) Left CGH: left cingulum in the hippocampal part, (e) Right CGH: right cingulum in the hippocampal part, (f) Left ILF: left inferior longitudinal fasciculus, (g) Right ILF: right inferior longitudinal fasciculus, (h) Left SLF: left superior longitudinal fasciculus, (i) Right SLF: right superior longitudinal fasciculus. Positive values mean increasing parameter values, and negative values mean loss of parameter values. Gray curves (red in the online version) show females, and black curves (blue in the online version) show males.
Figure 4. Mean of fractional anisotropy (FA) by tracts of interest (TOIs). Vertical axis is FA value and horizontal axis is TOIs. CC: corpus callosum, CGH: cingulum adjoining the hippocampus, ILF: inferior longitudinal fasciculus, SLF: superior longitudinal fasciculus. Infants: age < 6 years, 21 participants;
children: 6 years < age < 10 years, 11 participants; adolescents/adults: age > 10 years, 20 participants.
ANOVAs were conducted to test the effects of age groups by TOIs.
Post hoc comparisons with Bonferroni correction:
Infant group: CC vs. CGH, p < 0.001; CC vs. ILF, p < 0.001; CC vs. SLF, p < 0.001;
CGH vs. ILF, p < 0.001; CGH vs. SLF, p < 0.001; ILF vs. SLF, p < 0.001
Children group: CC vs. CGH, p < 0.001; CC vs. ILF, p < 0.001; CC vs. SLF, p < 0.001;
CGH vs. ILF, p < 0.001; CGH vs. SLF, p < 0.001; ILF vs. SLF, p < 0.001 Adolescence/adults group: CC vs. CGH, p < 0.001; CC vs. ILF, p < 0.001;
CC vs. SLF, p < 0.001; CGH vs. ILF, p < 0.001; CGH vs. SLF, p < 0.001; ILF vs. SLF, p < 0.001 CC: infants vs. children, p =0.023; infants vs. adolescence/adults, p <0.001
CGH: infants vs. adolescence/adults, p <0.001; children vs. adolescence/adults, p =0.041 ILF: infants vs. adolescence/adults, p <0.001; children vs. adolescence/adults, p =0.003 SLF: infants vs. children, p =0.010; infants vs. adolescence/adults, p <0.001;
children vs. adolescents/adults, p =0.013
Figure 5. Sample tractography of the white matter tracts on sagittal slice at infants (age < 6 years), children (6 years < age < 10 years) and adolescents/adults (age > 10 years).
(a), (b), (c) : Pink color shows corpus callosum (CC).
(d), (e), (f) : Green color shows cingulum adjoining the hippocampus (CGH).
(g), (h), (i) : Brown color shows inferior longitudinal fasciculus (ILF).
(j), (k), (l) : Yellow color shows superior longitudinal fasciculus (SLF).
Figure 6. Mean of fractional anisotropy by genu corpus callosum (gCC) and splenium corpus callosum (sCC), respectively. Vertical axis is FA value and horizontal axis is TOIs.
Figure 7. Overall mean of fractional anisotropy (FA) by left and right side TOIs, respectively. Vertical axis is FA value and horizontal axis is TOIs.