JAIST Repository
https://dspace.jaist.ac.jp/
Title 類似性に基づく推論における多様性保存
Author(s) Dang, Tran Thai Citation
Issue Date 2019‑09
Type Thesis or Dissertation Text version ETD
URL http://hdl.handle.net/10119/16176 Rights
Description Supervisor:Dam Hieu Chi, 先端科学技術研究科, 博士
Diversity Preservation in Similarity-based Inference
Dang Tran Thai
Japan Advanced Institute of Science and Technology
Doctoral Dissertation
Diversity Preservation in Similarity-based Inference
Dang Tran Thai
Supervisor: Associate Professor Hieu Chi Dam
Graduate School of Advanced Science and Technology Japan Advanced Institute of Science and Technology
Knowledge Science
September 2019
Abstract
Similarity-based inference has been widely used for recognition. The principle behind the similarity-based inference is that similar objects will share common properties. In machine learning, similarity-based inference is employed through various methods such clustering, k-nearest neighbors, etc. In addition, similarity-based inference is useful for controlling confounding factors in statistical causality inference.
There are several issues in using similarity-based inference in practice. The principles of the inference are applicable if the representation of objects and similarity measure used for this representation are ideal. In case these factors are not ideal, there has the inconsistency of the similarity measured based on the objects’ representation with the similarity of objects’ target values. In addition, in analogy-based causality inference, similar causes play the role of reference factors for assessing the relation between the cause of interest with effects. Hence, the main issue here is how to choose good similar causes for accurately recognizing confounding factors.
This work aims to solve the issues mentioned above through verifying the proposed hypothesis that conservation of diversity in selecting models and data samples can help to effective solve these issues. As such, we enrich the knowledge about the diversity preservation in machine learning.
We demonstrate issues in similarity-based inference through specific studies. The first one regards to measure the similarity between materials for effectively predicting materials’ formation energies. The second one regards to control polypharmacy-induced confounding in assessing the cause of drug adverse reaction. Through these studies, we can evaluate the likelihood of our proposed hypothesis. In both studies, we focus on model interpretation and explanation based on model performance.
In the first study, we address the problem that most materials’ descriptors in vector space are not ideal for representing materials for predicting formation energy, which in- duces the roughness of the energy surface. Hence, the similarity of materials measured based on their presentation is not consistent with the similarity of their energies. In this situation, finding an appropriate similarity measure for these descriptors may help to im- prove the performance of similarity-based learning models in approximating the energy surface. We hypothesize that to effectively approximate the energy function, similarity measures need to preserve the distinction of two objects in comparison with the third one.
We propose a protocol for verifying this hypothesis that incorporates various methods for investigating the roughness of energy surface and similarity measures. In addition, we also proposed a method for estimating the loss of distinction of two objects in comparison with the third one when using similarity measures. The experimental results show the high likelihood of our proposed hypothesis. Furthermore, we establish general principles for effectively using similarity measures for mining materials data, which do not depend on any specific learning method.
In the second study, we concentrate on an important problem in post-marketing phar- maceutical surveillance that is drug-adverse reaction causality assessment. The main issue here is to deal with confounding factors induced by polypharmacy in the treatment. In this study, we employ reference sets constructed based on the analogy criterion – one of nine Bradford Hill criteria to control confounding factors. This criterion states that similar drugs may cause similar adverse events. We propose a novel model, called the
analogy-based active voting, for effectively assessing causal relations between drugs and adverse events. This model mimics the analogy criterion by a voting process of similar drugs. In this context, each drug is represented by a set of its associated adverse events extracted from electronic medical records. The diversity of these sets induce the con- flict in voting of similar drugs, which plays an importance role for eliminating non-causal drug-adverse reaction pairs. This case study demonstrates the importance of diversifying reference in analogy-based causality inference.
Keywords: Similarity-based inference, diversity preservation, similarity measure, confounding, analogy-based causality inference
Acknowledgements
I would like to express my gratitude to all those who gave me the possibility to complete this thesis. First all all, I would like to express my gratitude to my supervisor, Professor Dam Hieu Chi, Professor Ho Tu Bao for their supervision, advice, assistance during my master course and doctoral course. As my supervisor, they taught me not only knowledge about machine learning and data mining but also developing new idea, solving problems, and critical thinking. They also provided me kind encouragements and supports not only for my study but also for my life in Japan.
I wish to thank to my committee members: Professor Huynh Van Nam, Professor Hideomi Gokon, Professor Kenji Satou, and Professor Ho Tu Bao, for reading my thesis and providing me valuable feedback.
I would like to thank Professor Phung Quoc Dinh of Monash University for his guidance and support during my off-campus research in Australia.
I would like to acknowledge the 5D Scholarship Program of Japan Advanced Institute of Science and Technology (JAIST) for the financial supports during my study.
I would like to thank all members in Ho & Dam Laboratory of JAIST for their support during my research.
Finally, I would like to give a special thank to my family for their encouragements and supports during my study at JAIST.
Contents
1 Introduction 1
1.1 Context-dependent diversity . . . 1
1.1.1 Example . . . 1
1.1.2 Context-dependent similarity and difference evaluation . . . 1
1.1.3 Context-dependent diversity evaluation . . . 2
1.2 Diversity preservation in machine learning . . . 2
1.2.1 Importance of diversity preservation . . . 2
1.2.2 The need of measuring the diversity . . . 3
1.3 Problem and research objectives . . . 4
1.3.1 Similarity-based inference . . . 4
1.3.2 Objectives . . . 5
1.4 Contributions . . . 5
1.4.1 Measuring the similarity between materials for effectively predicting materials’ formation energies . . . 5
1.4.2 Controlling for confounding in assessing the cause of drug adverse reactions . . . 6
1.4.3 Dissertation structure . . . 7
2 Diversity Preservation in Machine Learning 8 2.1 Introduction . . . 8
2.2 Diversifying data in machine learning . . . 8
2.2.1 Increasing the number of dimensions in representation . . . 8
2.2.2 Active learning . . . 9
2.3 Diversifying models in machine learning . . . 11
2.4 Diversifying inference in machine learning . . . 11
2.5 Measuring the diversity . . . 11
3 Measuring Similarity: The Need of Preserving Objects Distinction in Reference-based Comparison 13 3.1 Introduction . . . 13
3.2 Overview of similarity measurement in materials data mining . . . 14
3.3 Roughness of target function subject to representation . . . 15
3.3.1 Similarity-based inference . . . 15
3.3.2 Problem Statement . . . 15
3.4 Hypothesis on the influence of preserving the instances distinction in their reference-based similarity evaluation on the performance of similarity-based
learning methods . . . 17
3.4.1 A comparison between the Manhattan distance and Euclidean dis- tance in terms of their ability of preserving instance distinction in the reference-based similarity evaluation . . . 17
3.4.2 The influence of preserving the instance distinction in their reference- based similarity evaluation on the performance of similarity-based learning models . . . 18
3.5 Protocol for validating the proposed hypothesis . . . 19
3.5.1 Material representation (descriptor) . . . 19
3.5.2 Similarity measures of interest . . . 22
3.5.3 Dependency among data representation (descriptor), similarity mea- sure, and learning method . . . 23
3.5.4 Protocol . . . 24
3.5.5 Evaluating the roughness of the target surface . . . 25
3.5.6 Evaluating the likelihood of globally and linearly approximating the target surface . . . 26
3.5.7 K-nearest neighbors regression . . . 27
3.5.8 Measuring the loss of instances distinction in their reference-based similarity evaluation when using similarity measures . . . 27
3.5.9 Kernel ridge regression . . . 29
3.6 Experiments and discussion . . . 31
3.6.1 Material dataset . . . 31
3.6.2 Evaluating the roughness of the energy surface subject to material representations . . . 32
3.6.3 Estimating DLoss . . . 33
3.6.4 K-nearest neighbors performance . . . 33
3.6.5 Combining derived features and make induction rule for effectively using dissimilarity measures for material datasets . . . 39
3.7 Learning the distance between materials . . . 40
3.7.1 Introduction to distance metric learning . . . 41
3.7.2 Neighborhood component analysis (NCA) . . . 41
3.7.3 Large margin nearest neighbors (LMNN) . . . 42
3.7.4 Model complexity investigation with the learned distance . . . 44
3.8 Chapter summary . . . 45
4 Reference Diversification in Analogy-based Causality Inference 46 4.1 Introduction . . . 46
4.2 Overview of pragmatic clinical trials . . . 46
4.3 Confounding caused by polypharmacy . . . 48
4.3.1 The importance of considering confounding for avoiding bias in medicine . . . 48
4.3.2 Definition of drug-ADR association . . . 48
4.3.3 Polypharmacy-induced confounding definition . . . 49
4.4 Previous studies on ADR causality assessment . . . 51
4.5 Objectives and ideas . . . 52
4.5.1 Objectives . . . 52
4.5.2 Ideas . . . 52
4.6 Electronic medical record Data . . . 53
4.7 Data preprocessing . . . 54
4.7.1 Text normalization . . . 54
4.7.2 Sentiment classification . . . 54
4.7.3 Term extraction . . . 55
4.8 Preliminaries . . . 55
4.8.1 Bradford Hill criteria . . . 56
4.8.2 Drug-ADR association measurement . . . 56
4.9 Analogy-based active voting . . . 59
4.9.1 Do similar drugs cause similar ADRs? . . . 59
4.9.2 Model intuition . . . 59
4.9.3 Establishing committee for voting . . . 61
4.9.4 Estimating voting rate of drug-ADR pairs . . . 61
4.9.5 Evaluating the committee diversity . . . 63
4.10 Results and discussion . . . 65
4.10.1 Data preparation and ground truth . . . 65
4.10.2 Evaluation metric . . . 66
4.10.3 Comparing the AAV with existing methods . . . 66
4.10.4 Association between the committee diversity and AAV performance 67 4.10.5 Detecting infrequently observed drug-ADR causal relations . . . 69
4.11 Chapter summary . . . 70
5 Conclusions and Future Work 71 5.1 Summary . . . 71
5.2 Contributions to knowledge science . . . 72
5.3 Future work . . . 72
Appendices 74
A Kernel ridge regression - dual form of ridge regression 75
List of Figures
2.1 Visualization of two distinct pointsAand B in 3D space, and project them to 2D space. . . 9 2.2 Histogram plots show the distribution of all pairwise distances between
randomly distributed points in d-dimensional space. . . 10 3.1 The illustration of abrupt changes in the target surface that is induced
by the use of inappropriate combination of representation and similarity measure. . . 16 3.2 The comparison between the Manhattan distance and Euclidean distance
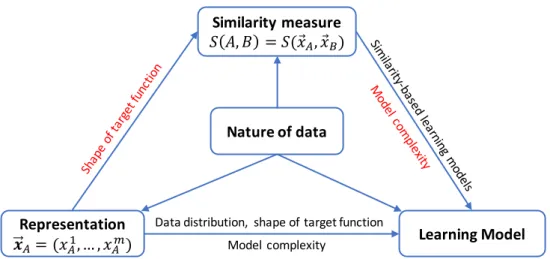
in terms of preserving the instances distinction when comparing these in- stances using a referenced instance. Area of the blue square indicates the set of instances that the Manhattan distance between these instances and O is smaller or equal than r. Area of the red circle indicates the set of instances that the Euclidean distance between them and O is smaller or equal than r. . . 18 3.3 Representing materials in the vector space. . . 20 3.4 Directed graph showing the dependence of material descriptor, similarity
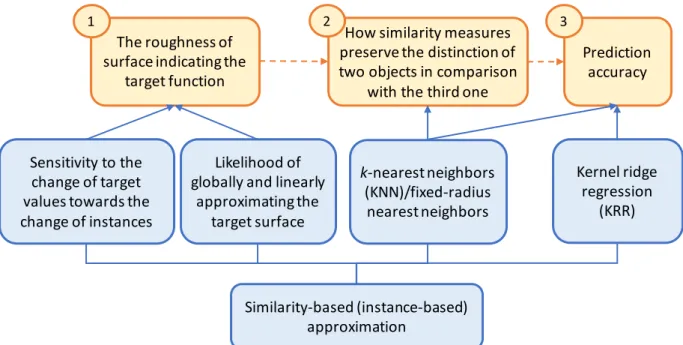
measure, and learning model on each other, and the dependence of them on the nature of material data. . . 23 3.5 Protocol for examining the correlation among: the roughness of target sur-
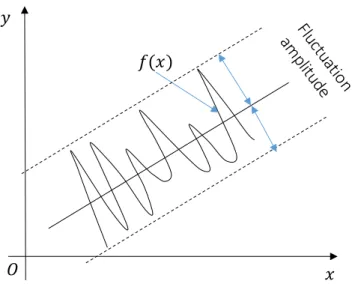
face indicating the material formation energies; the nature of dissimilarity measures as mentioned in the proposed criterion; and the formation energy prediction accuracy. . . 25 3.6 Illustration of the fluctuation amplitude off(x) values towards a hyperplane. 27 3.7 Illustration of the method used for estimating the loss of instances when
they are compared using a specific instance as a reference, which corre- sponds to the use of each similarity measure. . . 28 3.8 The dependency of KNN performance (MAE) on theDLoss of the 1-norm
(man), 2-norm (euc), 3-norm (min3), cosine (cos), B-C (bray), Canberra (can), and Chebyshev (che). The solid blue line indicates the tendency of this dependency. . . 35 3.9 The tendency (blue line) of the dependency of KRR performance (MAE) on
theDLossof similarity measures used in kernel functions,Klap, Krbf, Kmin3, Kcos, Kbray, Kcan, Kche. 37 3.10 Dependency of KRR performance (MAE) on the model degrees of freedom
df(λ). . . 37 3.11 Derived rules for appropriately using dissimilarity measures for predicting
formation energies. . . 40
3.12 Graphical description of target neighbors and imposters in the large margin nearest neighbors algorithm. . . 43 4.1 The diagram indicating the treatment progress which is extracted from
Tables 4.1 and 4.2. The red and blue lines indicate the period that Heparin and Rifaximin are being prescribed. . . 50 4.2 Data preprocessing pipeline. . . 54 4.3 An example illustrating that the difference of drugs, co-prescribed with
similar drugs, results in the diversity in voting for drug-ADR causality in committees. Note that three drugs x1, x2, x3 are similar: x1 ∼x2 ∼x3. . . 64 4.4 Comparing the proposed measures with existing (baseline) measures. . . . 68
List of Tables
1.1 Example of context-based diversity . . . 1 3.1 Estimation of the SensitivityT oChange(D), r . . . 32 3.2 Performance of ridge regression with the material datasets and representa-
tions of interest . . . 32 3.3 Estimation of DLoss corresponding to each dissimilarity measure of interest 34 3.4 The most likely dissimilarity measure for effectively performing KNN with
material datasets and representations . . . 35 3.5 Formation energy prediction performance using KRR with different ker-
nel functions and descriptors for the OQMD and QM7 datasets, and the corresponding model complexity (df(λ)). . . 38 3.6 The most likely kernel function for effectively performing KRR with mate-
rial datasets and representations . . . 39 3.7 Combining derived features from empirical experiments for validating the
effectiveness of the proposed criterion . . . 39 3.8 Formation energy prediction performance by using KNN for the original
and LMNN-based and NCA-based transformed data. . . 44 3.9 Formation energy prediction performance using KRR for the original and
LMNN-based and NCA-based transformed data. . . 45 4.1 An example of prescriptions in EMRs. . . 49 4.2 An example of clinical notes in EMRs. Terms indicating ADRs are italic. . 50 4.3 Contingency table of two random variables (x and y) . . . 57 4.4 Nifedipine and Nitroglycerin mechanisms of action . . . 60 4.5 Expertise-based committee establishment . . . 62 4.6 Precision (%) obtained by using the existing measures for ranking drug-
ADR associations. . . 66 4.7 Precision (%) obtained by using the proposed measure for ranking drug-
ADR associations . . . 67 4.8 Estimation of thedivi(C) anddivm(C) for committees C1, C2, C3, and C4
(the notation ↓ indicates the smaller value is better, and the notation ↑ indicates the larger value is better). The rank assigned for each committee is in the parentheses. . . 69 4.9 An example of recognizing uncommon causative drug-ADR associations by
the AAV model (considered at the top of 5% of ranked associations). . . . 70
Chapter 1 Introduction
1.1 Context-dependent diversity
1.1.1 Example
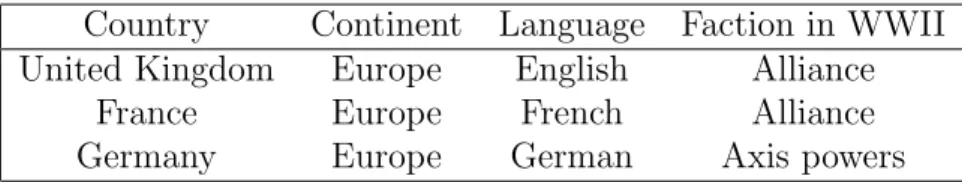
Before define the concept of context-based diversity, we shows a simple example, which provides a first glance at this concept. Given a collection of three countries C ={United Kingdom, France, Germany}which are described by the continent they locate, the main language used in these countries, and the faction they belong to in the World War II (WWII), as shown in Table 1.1.
Relying on this table, if countries are compared with each other based on their conti- nent, they are identical because all of them belong to the Europe. Meanwhile, when based on the faction in WWII, United Kingdom and France are different from Germany, so the collectionC is more diverse. When based on the language, countries in each possible pair are different, thus, the collection in this context is most diverse. Through this example, we see that the diversity of a collection can vary when this collection is considered in different contexts.
1.1.2 Context-dependent similarity and difference evaluation
The evaluation of similarity and evaluation of difference are complementary (the difference can be considered a linear function of similarity with slope of -1), and depend on a specific context [93]. For example, the United Kingdom and France are similar in terms of continent, while are different in terms of the main language.
The evaluation of similarity or difference is commonly carried out with two objects by measuring how alike these objects are. In terms of mathematics, similarity measures are
Table 1.1: Example of context-based diversity
Country Continent Language Faction in WWII United Kingdom Europe English Alliance
France Europe French Alliance
Germany Europe German Axis powers
real-valued functions that take representations of two objects as the function input, and then output a scalar. For example, distances between two points in the vector space such as the Euclidean, Manhattan, and cosine are used for measuring the similarity of these points. In fact, these distances are functions of two variables.
1.1.3 Context-dependent diversity evaluation
Differing from the similarity (or difference) evaluation, the evaluation of diversity is often conducted for a collection ofn objects with n ≥3. This evaluation is based on the set of pairwise difference of objects in this collection. In other words, the diversity evaluation is an aggregation of objects’ pairwise differences. For example, in context of the faction in WWII, the number of country pairs whose elements are different is 2, while the number of these pairs in context of language is 3. Hence, in context of language, the collection is more diverse than that in context of the faction in WWII.
As mentioned above, the evaluation of similarity and difference depends on a specific context. Therefore, the evaluation of diversity in a collection also depends on a given context.
1.2 Diversity preservation in machine learning
Essentially, machine learning models aim to represent a collection of real-world objects and the relation among them in specifict contexts based on the “no free lunch” theorem [100].
In fact, each model here corresponds to a context of these objects. Obviously, objects in the real-world are essentially diverse. In several situations, capturing the diversity of these objects can help machine learning models attain high performance. To reflect the diversity of real-world objects, diversification of data, model parameters, and model ensemble is necessary [36]. Therefore, the term of “diversity preservation” in terms of machine learning refers to: the selection of data samples that maximize information contained for training process; the selection of models whose parameters can reflect much information in the data; and the selection of model ensembles whose based models are diverse.
1.2.1 Importance of diversity preservation
Machine learning techniques have been widely applied to solve real-world problems that is expected to make incredible improvements for people lives, and to accelerate scientific dis- covery. There are numerous factors that can affects the performance of machine learning systems, in which the diversity of training data and learning process plays an important role. Indeed, the diversity property in data and learning models can make the fairness in assessing learning models, enlarge the searching space of hypotheses in these models, and enhance the effective information exploitation from data. In addition, the diversity of recommended items can help to minimize the risk induced by the user dissatisfaction in information retrieval and recommender systems.
In machine learning, the “no free lunch” theorem [100] states that there is no search and optimization algorithm is expected to perform better than any other algorithms. In other words, there has no a model which is the best for solving all problems. Hence,
the selection of appropriate models is an inevitable step in most of learning methods.
To perform the suitable selection, evaluating and comparing models play an important role. One of important criteria is to assess how a model is generalized for achieving better prediction performance. The evaluation on the generalization of models requires the use of different testing or validation data samples. Thus, diversifying the testing sets helps with the fairness in model assessment. For example, cross-validation, which is a well-known method for model assessment, generates one several pairs of training and validation sets for estimating the risk of the model in prediction [5].
In principle, a model is tuned for fitting with an available dataset, hence, to avoid the bias of such a model and overfitting as well as enhance the generalization of such a model for effectively predicting new instances, the learning process should be carried out with difference data samples. A well-known approach, which attempts to generate multi- ple learners and then incorporates these learners for improve prediction, is the ensemble learning. Several methods in the ensemble learning, e.g., bagging and adaBoost, have been widely used in many applications. These methods target to enlarge the searching space of hypotheses from the amount of available training dataset, and then aggregate these hypotheses for making the improvement in prediction [27, 106]. In ensemble learn- ing methods, diversifying classifiers is needful to be considered when building classifiers ensembles for real-life pattern recognition, which was proven in [57].
The diversity property helps machine learning techniques be able to adapt with real- world problems, furthermore, enhance their ability for solving these problems. In the area of recommendation system, the diversity of output has been taken into account in information retrieval and recommender systems for a long time. The reason is that in searching engines and recommender systems, diversifying results helps to minimize the risk of dissatisfaction of users [2]. In other words, diverse items that are recommended for users will help the users get more options for selection, and improve their satisfaction.
The importance of result diversification has been discussed in early work on information retrieval. This problem is stated that the relevance of retrieval documents depends on not only the individual relevance of each user, but also on how they are related to other users [19]. Ideally, we expect that recommended documents should be relevant to the common interest of most of users in the population [22]. Because of the importance of result diversification, numerous studies so far have attempted to develop diversity- based ranking methods for improving the quality of retrieved items. Besides the result diversification in recommendation systems, in [45], the author proved that the diversity and size of data are important factors for better performance of machine learning methods.
This proof was based on a comparison of performance in playing between the AlphaGo and AlphaGo Zero systems.
1.2.2 The need of measuring the diversity
As mentioned above, diversity preservation is known as the selection of data samples and learning models that maximizes the ability of reflecting the diversity of real-world objects.
Hence, defining and measuring the diversity in specific situations are needful because they are used for establishing criteria for selecting data samples and models.
In general, quantifying the diversity plays an important role for effectively constructing learning models that minimize the risk when performing with real-world data. The risk
can be caused by the limited labeled data for training as the motivation of active learning, additionally can be caused when the events happening the future are out of intended outcome of the model as the issue in recommendation system.
In recommendation systems, although the recommending models can be fitted with the historical information of customers’ interest, these models can be poor to suggest items for the customers in the future because the interest of customers may change over time, even the interest can be significantly different from that collected in the historical data. Hence, diversifying retrieval results is important for search engines and recommender systems as mentioned above. In these systems, the measure for ranking items needs to make the trade-off between the relevance level of items to a specific customer and the novelty level of these items to this customer.
In machine learning, data diversification is important that aims to provide informative samples for training machine learning models. Considering the diversity of instances in these samples aims to maximize the amount of information contained in these ones. Thus, measuring the diversity of samples, a.k.a. measuring the informativeness of samples, is needful to provide the basis for selecting informative training samples. In active learning, we aim to enrich existing labeled data for effectively training, while reduce the cost of labeling and time consuming. Thus, selecting informative samples for labeling plays an important role, which are based on evaluations on the diversity of samples [104, 91].
1.3 Problem and research objectives
In this study, we focus on the problem of diversity preservation in similarity-based in- ference. This problem is specified through two studies: (i) preserving the distinction of pairwise comparison in triplet of objects in measuring similarity for approximating rough- ness target function; (ii) diversifying the reference in analogy-based causality inference.
1.3.1 Similarity-based inference
Measuring the similarity is a fundamental process in analogy-based recognition. The principle behind the similarity-based inference is that similar objects will share common properties. In machine learning, similarity-based inference has been widely used through several well-known methods such as clustering, k-nearest neighbors methods, etc. By this methods, unknown target values of new instances are inferred by comparing these instances with existing ones based on similarity measures. In addition, the similarity- based inference can be used in causality inference that similar presume causes may result in similar effects.
There are several issues in similarity-based inference. In practice, the principle of similarity-based inference is applicable if the representation of objects and similarity mea- sures used for this representation are ideal. However, finding an ideal representation is so difficult and takes lots of time. In case the representation and similarity measure are not ideal, there will be an inconsistency of measuring objects similarity based on their rep- resentation with the similarity of their target values. In fact, this induces the roughness of target function. In analogy-based causality inference, the use of this principle can help for controlling confounding, in which similar causes play the role of reference for assessing
the relation between the cause of interest with effects. The main issue here is that how to choose good similar causes for accurately recognizing confounding factors.
1.3.2 Objectives
As mentioned in previous sections, we address two issues in similarity-based inference:
(i) the inconsistency of measuring objects similarity based on their representation with the similarity of their target values because of using non-ideal representation; (ii) how to design and select good similar causes for effectively controlling confounding in analogy- based causality inference. Our work aims to solve these issues. We hypothesize that conservation of the diversity in selecting models and data samples can help to effectively solve these issues.
Regarding (i), we hypothesize that the use of similarity measures that preserve the distinction of pairwise comparison in a triplet of objects can help similarity-based learn- ing models improve the performance in approximating rough target functions induced by the use of non-ideal representation. Regarding (ii), we hypothesize that diversifying the reference (similar causes) can help to improve the performance of similarity-based causality inference. In this work, we aim to verify and estimate the likelihood of proposed hypotheses.
Through solving these issues, we aim to enrich the knowledge about diversity preser- vation in machine learning by providing additional views in such a situation. To verify our proposed hypotheses, we address two main objectives as follows:
• Defining and measuring the concept of diversity in specific context when solving each issue. This helps for assessing similarity measures and collections of similar causes used for controlling confounding factors.
• Interpreting why preserving the diversity when selecting similarity measures and samples of reference factors (similar causes) can help to solve these issues.
1.4 Contributions
We demonstrate issues in similarity-based inference as mentioned above by specific studies.
For the first issue, we carry out a study on measuring the similarity between materials for effectively predicting materials’ formation energies. For the second one, we carry a study on controlling polypharmacy-induced confounding in assessing the cause of drug adverse reaction. Through investigations in these studies, we can verify and estimate the likelihood of proposed hypotheses on the role of diversity preservation.
1.4.1 Measuring the similarity between materials for effectively predicting materials’ formation energies
The main problem is this study is that most material descriptors (representations) of in- terest in the vector space are not ideal for representing materials for predicting formation energies, which induces the roughness of the energy surface. Hence, measuring the simi- larity of materials based on their presentation in vector space is not compatible with the
similarity of their formation energy. In other words, neighbors of materials in a vicinity, determined by similarity measures in the vector space, may have the energies that are extremely different from the energy of these materials.
We hypothesize that in this situation, finding an appropriate similarity measure for these descriptors may help to improve the performance of similarity-based learning mod- els in approximating the energy surface. We evaluate the appropriateness of similarity measures in fitting the rough energy surface though the use of these measures for local ap- proximation. Indeed the number of neighbors of each instance affects the approximation accuracy at this instance, which depends on the similarity measure used. Hence, relying on this, we hypothesize that to effectively approximate the energy function, similarity measures need to preserve the distinction of two objects in comparison with the third one.
Relying on the dependency among data presentation, similarity measure, and learning model, we propose a protocol for verify the proposed hypothesis, which includes two main steps: (1) examining the roughness of target function; and (2) evaluating appropriateness of similarity measures in fitting rough target function. The roughness of target function is quantitatively evaluated by estimating the roughness level based on function derivative, examining whether the target variable distribution is close to uniform, and examining whether the target function can be approximated by a linear function. For investigating similarity measures, we interpret empirical performance ofk−nearest neighbors and kernel ridge regression which use these measures.
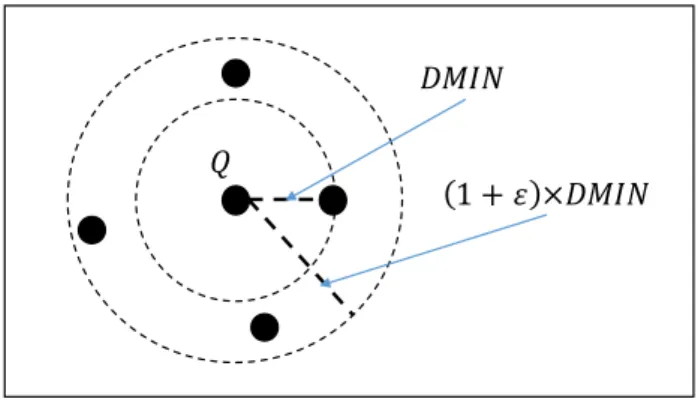
Inspired by the fixed-radius nearest neighbors regression, we propose a method for measuring the loss of distinction of two objects in comparison with the third one when using similarity measures. LetDM IN be the distance from each data point to its closest neighbors, we enlarge the neighboring region of this data point for determining other neighbors with a radius ofDM IN ×(1 +ε), εis a predefined scalar. This loss is defined as the average of the number of neighbors of each instance in a given dataset. This is used for evaluate similarity measures.
The experimental results show the high likelihood of our proposed hypothesis. That can help to explain why the Manhattan distance and Bray-Curtis dissimilarity provide better prediction performance with most of descriptors and material datasets. Further- more, we establish general principles for effectively using similarity measures for mining material data, which do not depend on any specific learning method.
1.4.2 Controlling for confounding in assessing the cause of drug adverse reactions
In this study, we concentrate on an essential problem in post-marketing pharmaceutical surveillance (i.e., pragmatic clinical trials) – assessing the causality between drugs and adverse drugs reactions (ADRs) observed during the treating process. The main diffi- culty is that the presence of co-morbidity in patients requires polypharmacy for treating, hence, we have to face with the problem of confounding factors in the statistical causal- ity inference. The polypharmacy-induced confounding makes most of existing methods poor in detecting actually causal drug-ADR pairs. Therefore, reducing bad impacts of confounding factors on the causality inference process motivates our work.
In our work, confounding factors are defined as non-causal drug-ADR pairs which frequently and coincidentally co-occur in treatment. To control confounding factors, we need additional references which are constructed based on the analogy criterion – one of nine Bradford Hill criteria. The analogy criterion states that similar drugs may causes similar ADRs, hence, a drug is believed more to cause an ADR if we found other drugs that are similar to the drug of interest and also have associations with the ADR. Therefore, in this context, we use similar drugs with their associated and ADRs (extracted from clinical narratives) as the reference for recognizing confounding factors.
We propose a novel semi-supervised model for inferring drug-ADR causality based on the analogy criterion, called the analogy-based active voting (AAV). This model represents this criterion as a voting process of similar drugs, in which similar drugs vote for a drug-ADR association to be causal if they also have the association with the ADR. The set of similar drugs is called the committee. We present each drug by two features:
the mechanism of actions and targets; and the list of its associated ADRs extracted from electronic medical records. The first feature is used to identify similar drugs for establishing committees. The second one is used for voting of these drugs.
For effectively controlling confounding factors, we hypothesize that it is needful to diversify committee according to the feature of its drugs. It aims to create a strict inspec- tion for distinguishing causal drug-ADR pairs from non-causal ones, and then can help to improve the causality inference performance. Similar to active learning, we need to select similar drugs that maximize the committee in terms of the second feature (list of associ- ated ADRs). Because the second feature of each drug is bag of associated ADRs denoted by Fxi where xi indicates a drug, we measure the diversity of committee by considering the intersection ofFxi, and using the Hamming distance for modeling the conflict in vot- ing of each drug in committee with the rest. By using the Hamming distance, sets Fxi is represented by one-hot vectors. The experimental results show that the use of diverse committee results in higher accuracy in detecting causal drug-ADR pairs. In other words, this shows the high likelihood of our proposed hypothesis.
1.4.3 Dissertation structure
The dissertation includes five chapters, in which Chapters 3 and 4 present the main content of our work. In Chapter 2, we make an overview of diversity preservation in machine learning via existing studies. In Chapter 3, we demonstrate the problem of inconsistency of similarity estimated based on object representation with the similarity of target values via the study on measuring materials similarity for predicting their formation energies. In Chapter 4, we discuss about the reference diversification in analogy-based causality inference through the study on controlling polypharmacy-induced confounding in assessing the cause of adverse drug reactions. Chapter 5 shows conclusions and future work.
Chapter 2
Diversity Preservation in Machine Learning
2.1 Introduction
As mentioned in previous chapter, diversity preservation in machine learning refers to the selection of data samples the maximize information contained for training process;
the selection of models whose parameters can capture the information in training data as much as possible; the selection of models ensembles in which the output of each based model is different from that of the others. In this chapter, we make an overview of data diversification, model diversification, inference diversification in machine learning, and methods for measuring the diversity. This inspires our work on investigating the diversity preservation in similarity-based inference.
2.2 Diversifying data in machine learning
2.2.1 Increasing the number of dimensions in representation
Data representation in terms of computer science refers to methods to structure data for storing, processing, and transmitting by the computer. Data representation is almost the first step in machine learning and data mining. There are various forms for representing data, in which the vector form are widely used. In this representation, each object is described by a number of attributes, each attribute corresponds to a dimension of vector.
Each attribute is considered an aspect for comparing data instances. For example, in healthcare data, a patient can be described by a vast amount of variables (or attributes), e.g., blood pressure, weight, cholesterol level, etc. Typically, data can be represented as a table or matrix whose columns represent dimensions. High-dimensional data simply means that the number of dimensions are staggeringly high.
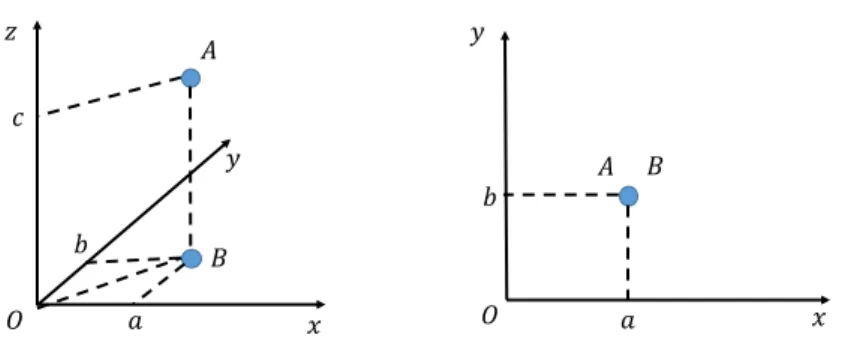
As the common sense, the concept of diversity refers to different things, hence, we can define the concept of data diversity as the distinctiveness of data instances. However, it is trivial to say that because instances are manifestly distinct, and duplicated instances are usually removed. What we would like to mention here is how the number of dimensions is associated with the distinct level of instances. For example, let A, B ∈ R3 be two
! "
#
$
% # %
$
&
' (
' ( )
!
"
Figure 2.1: Visualization of two distinct points A and B in 3D space, and project them to 2D space.
distinct 3-dimensional vectors, which are plotted in 3D space as shown in Figure 2.1. If we projectA and B to the planeOxy, these points stack up. In fact, higher the number of dimensions is, more distinct instances are.
We demonstrate how the distinctiveness of data instances is reflected in high-dimensional space through investigating the pairwise distance between such instances. In 2-dimensional space, the distance between two points is p
∆x2+ ∆y2. When the third dimension is added, this extends to p
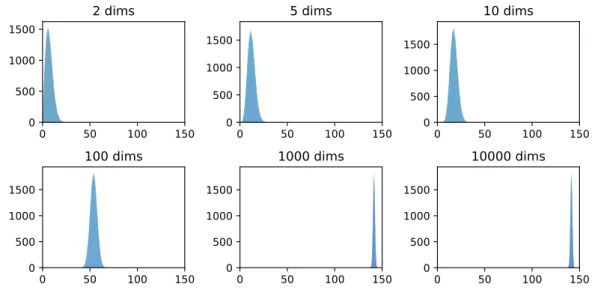
∆x2+ ∆y2+ ∆z2, which is probably larger. Hence, the pair- wise distances grow in high-dimensional space. To confirm that, we randomly generate a data sample with 10000 dimensions, and then we project such a sample to hyperplanes of 2, 5, 10, 100, and 1000 dimensions by using principal component analysis (PCA). The distributions of pairwise distances between data points in the original space and pro- jected spaces are shown in Figure 2.2. The figure shows that pairwise distances increase when increasing the number of dimensions. In addition, histograms also show that in the low-dimensional spaces (the number of dimensions is 2, 5, 10, 100) the range of pairwise distances is larger than that in the high-dimensional spaces (the number of dimensions is 1000, 10000). In context of k-nearest neighbors method, the narrowed range of pairwise distances between points in high-dimension space means that all points in the dataset are almost equidistant to the query point (the point needs to be predicted its label or target value). That means the distinction between close points and distant points to the query point is small, which is called “contrast loss” [63]. The contrast loss can hinder the clustering or other machine learning techniques for generalizing data into patterns. No generalization reflects the distinctiveness of data instances.
2.2.2 Active learning
Active learning is a semi-supervised method that helps to reduce the cost of labeling data by selecting informative samples for human to assign their labels. Samples are selected based on examining that they can enrich information contained in the current data that is known as enhancing the diversity of data. To this end, several criteria are used for selecting samples. The first one is uncertainty sampling that select samples which the current model θ is the most uncertain about. There are various ways to measure the uncertainty in predicting labels of new samples. If the model is characterized as a hyperplane, we can estimate the distance from new instance to this hyperplane. In addition, we can measure
0 50 100 150 0
500 1000
1500
2 dims
0 50 100 150
0 500 1000 1500
5 dims
0 50 100 150
0 500 1000 1500
10 dims
0 50 100 150
0 500 1000 1500
100 dims
0 50 100 150
0 500 1000 1500
1000 dims
0 50 100 150
0 500 1000 1500
10000 dims
Figure 2.2: Histogram plots show the distribution of all pairwise distances between ran- domly distributed points in d-dimensional space.
the uncertainty based on labels probabilities as follows:
• Least confident:
x∗LC = argmax
x 1−Pθ(ˆy|x) (2.1)
where ˆy is the most probable label for xunder the current model θ.
• Smallest margin:
x∗SM = argmin
x Pθ(y1|x)−Pθ(y2|x) (2.2) where y1, y2 are the two most probable labels for x under the current model
• Label entropy: choose example whose label entropy is maximum:
x∗LE = argmax
x −X
i
Pθ(yi|x)logPθ(yi|x) (2.3) where yi ranges over all possible labels.
Besides, samples can be selected based on query by committee (QBC). QBC uses a committee of modelsC ={θ1, ..., θn}. All models are trained by using the current labeled data, and then vote their predictions on the unlabeled data. Examples with maximum disagreement are chosen for labeling. The disagreement is measured by the vote entropy:
x∗V E = argmax
x −X
i
V(yi)
C logV(yi)
C (2.4)
whereyi ranges over all possible labels, V(yi): number of votes received to label yi.
2.3 Diversifying models in machine learning
In addition to diversify the data for learning by adding informative samples, we can also diversify models to enhance the representation ability of these models. Indeed, diversifying model includes diversifying parameters of an single model and diversifying an ensemble of models.
Diversifying parameters can enhance the representation ability of models because this helps to capture the information from the data as much as possible. Additionally, it makes the model complex and flexible. Obviously, increasing the flexibility of model is equivalent to enhancing the representation ability of this model. To enforce the diver- sity of parameters, we can utilize Bayesian method, posterior regularization method [33], diversity regularization by using distance-based measurement [17], angular-based mea- surement [108], etc.
For effectively solving real-world problems, ensembles of models are often used. Di- versifying based models in these ensembles can help to improve the performance. Indeed, this induces various representations of data. A well-known method that are commonly used for encouraging the diversity of ensembles is sample-based methods that attempt to generate different models by randomly dividing the training data into subsets.
2.4 Diversifying inference in machine learning
Diversifying data and models can help to improve the performance of machine learning models. Besides, there has several methods that focus on obtaining multiple choices in inference of machine learning models. By using machine learning models, the predicted labels of data instances often converge to sub-optimal results because of the limitation of data and representation ability of the models. Hence, it motivates the use of multiple choices in inference of machine learning models. Diversifying choices can minimize the risk in prediction of models. There are several methods for diversifying the choices in inference such as diversity-promoting multiple choice learning (D-MCL), submodular, M- Modes, and M-NMS [36].
2.5 Measuring the diversity
Quantifying the diversity in machine learning is important, however, it is not straight- forward, and depends on a specific domain. Measuring the diversity has attracted the interest of researchers for a long time such that many models have been proposed for at- tempting to measure such a property. Nevertheless, so far we have no a general measure method for this property.
As mentioned above, diversifying result in recommendation systems is important, which attracts many studies on this. Most studies attempted to propose quantitative models for ranking items that makes a tradeoff between the relevance (i.e., utility) and the diversity. Agrawal et al. [2] proposed an algorithm with an explicit objective of tradeoff between the relevance and the diversity. Additionally, they generalized several classical information retrieval metrics to explicitly account for the value of diversifica- tion. Carbonell et al. proposed a ranking method which combines query-relevance with
information-novelty for text retrieval and summarization [22]. The method is called the maximal marginal relevance. In [18], an algorithm, called optSelect, was proposed with a novel utility measure. This allows the diversification task to be accomplished effectively.
The diversity can be quantified by pairwise distance measures [105, 110]. Given ele- ments in a collection, the diversity in such a collection is defined as an aggregate function (e.g., sum) of pairwise distances between elements. In addition, coverage-based measures have been used for estimating the diversity [76, 102]. This measure relies on the existence of a predefined number of aspects, that is, topics, interpretations, or opinions. In [57], the authors pointed out the connection between the diversity in classifier ensembles and accuracy. Furthermore, they presented ten statistics that can measure the diversity of bi- nary classifier outputs, in which: averaged pairwise measures include the Q statistic, the correlation, the disagreement and the double fault; and non-pairwise measures include the entropy of votes, the difficulty index, the Kohavi-Wolpert variance, the interrater agreement, the generalized diversity, and the coincident failure diversity.
Chapter 3
Measuring Similarity: The Need of Preserving Objects Distinction in Reference-based Comparison
3.1 Introduction
In this chapter, we make an intensive discussion about an important problem in similarity- based learning (i.e., instance-based learning). The problem is that the use of inappropriate combination of representations and similarity measures can make objects with significant differences in their target values lost the distinction. This induces abrupt changes in the target surface (rough surface), which makes similarity-based learning methods become ineffective. To solve this problem, we focus on finding an appropriate similarity measure for a given previously designed representation. We found that it is needful to make a trade- off between the preservation of objects distinction when comparing them using a referenced object and the loss of this distinction. We quantify the loss of this distinction when using a similarity measure. To validate our statement, we employ a protocol that aims to point out the relation among: the roughness of target surface with a given representation; the loss of objects distinction as mentioned above; and the high predictive accuracy.
The problem mentioned above is demonstrated in our study on approximating the materials’ formation energy surface that is evaluated to be rough towards most existing material representations (e.g., orbital field matrix, Coulomb matrix, and smooth over- lap of atomic positions). We investigate several well-know dissimilarity measures (e.g., p−norm, chebyshev, cosine distances, Bray-Curtis and Canberra dissimilarities) where these measures are used in similarity-based learning models such as k−nearest neighbors regression and kernel ridge regression for predicting formation energies. The empirical experiments with several well-known material datasets and representations show the high potential of our finding as mentioned above. In addition, relying on this, we propose a policy for effectively designing similarity measures for material data.
Distance metric learning (DML) is a class of similarity measure learning methods that is useful for dealing with the problem of inconsistency of representation-based similarity measurement with the similarity of target values. Indeed, DML aims to learn an appro- priate Mahalanobis distance between object representations to maximize the consistency
with the similarity of their target values. By examining the model complexity of kernel ridge regression using the learned Manhalanobis distance, we found that the appropriate distance for represented materials makes the model complexity increase. This is consistent with and supports our investigations of selecting available similarity measures.
3.2 Overview of similarity measurement in materials data mining
A small change in the chemical composition or structure of materials can lead to a sig- nificant change in the properties of materials. For example, differences in the chirality of a honeycomb network of carbon atoms can lead to a distinctive difference in physical properties of nanotubes. In fact, the distinctiveness of materials, which makes the diver- sity of materials in the nature, is the main characteristic of the material data. Therefore, this characteristic needs to be represented in a metric that allows for a comparison of materials in a reliable, efficient, and useful way.
The main target of machine learning systems when mining material data is to deter- mine a likely functionf(x), which indicates the relation between the materials’ attributes and their physical/chemical properties. Typically, these systems includes two main com- ponents: (i) data representations which are also called descriptors; and (ii) operators including similarity measures between materials and learning methods (which map ma- terials’ attributes to physical properties). For efficient mining, these components are designed with the aim of reflecting domain knowledge and the nature of material data.
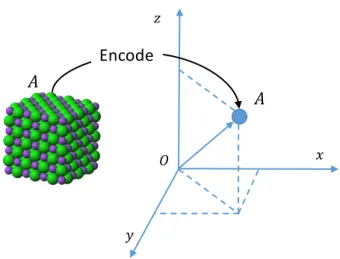
To render computational methods tractable for materials in datasets, the geometrical, topological, or electronic characteristics of the materials need to be represented in form of numerical variables. Descriptors commonly encode the information of a materialA by a vector~xA= (x1A, x2A, ..., xmA) whose number of dimensions, and values in each dimension depend on the information selected to describe the materials with a specific purpose for mining tasks. To represent material structures, several descriptors have been proposed.
Behleret al. utilized atom-distribution-based symmetry functions to represent the local chemical environment of atoms [12]. Rupp et al. proposed the Coulomb matrix (CM), which represents materials via the Coulomb repulsion between all possible nuclei in the material [88]. Bartok et al. proposed the smooth overlap of atomic positions (SOAP) that is effective to represent molecules [10, 26]. In addition, Isayev et al. used the band structure and density of states (DOS) fingerprint vectors as descriptors of materials to visualize material space [47]. Zhu et al. introduced another fingerprint representation for crystals and used this to define the configurational distance between crystalline struc- tures [109]. Pham et al. proposed a descriptor for encoding atomic orbital information, called the orbital field matrix (OFM) [59, 80].
Similarity measures aim to quantify how alike two materials are, which are math- ematically implemented as scalar valued functions that take two vectors representing materials A and B as input: S(A, B) = S(~xA, ~xB). The use of these measures is subjec- tive because they depend on a specific domain or application. Similarity measure is an important operator in many learning models. Conventionally, materials science studies begin by grouping similar materials in order to explore the patterns and rules in these
materials. Consequently, measuring material similarity is considered a key technique in material informatics [13]. The advantages and disadvantages of many similarity measures were addressed in [70] and the argument that similar structures lead to similar proper- ties was offered in [9, 99]. However, the validity of this argument was reconsidered by Maggiora et al., who showed that small chemical modifications can lead to significant changes in biological activity [69]. Because the nature of materials is fundamentally di- verse, Riniker et al. addressed the problem of partially losing the transparency among fingerprint types by using fuzzier similarity methods [86]. In addition, Maldonadoet al.
optimized measures of molecular similarity and diversity based on selecting and classifying descriptors [72]. Moreover, several methods have been proposed for comparing crystalline materials [58, 109].
Although similarity measures are disseminated in many studies in machine learning, to the best of our knowledge, most previous work rarely makes the discussion about properties of these measures, and why they perform well in specific contexts. It makes the explanation and interpretation of these measures poor, so this motivates our work to overcome such a limitation.
3.3 Roughness of target function subject to repre- sentation
3.3.1 Similarity-based inference
Similarity assessment is a fundamental operator in recognition. In machine learning, similarity-based inference has been widely used in various learning methods such as clus- tering, k−nearest neighbors methods, kernel methods. The principle of the similarity- based inference is that similar instances result in similar target values. Hence by this inference, unknown target values of new instances are inferred by finding neighbors (sim- ilar instances of the ones of interest) using various similarity measures. In practice, for similarity-based learning methods to effectively perform, representation and similarity measure need to reflect the nature of data. However, finding appropriate representation and similarity measure is not straightforward that requires intensively digging into the nature of data for understanding.
3.3.2 Problem Statement
Given a collection of objects O = {o1, ..., on}, and T = {T1, ..., Tn} is the set of target property corresponding to each object inO. Suppose that there has a functionf(o) with o∈O that maps each object to its target value: f :O→T.
To approximate the function f, we first encode objects in O in various forms, in which the vector form is widely adopted. Letr be a representation function that converts each object to its corresponding vector, r : O → V where V is the set of vectors. To preserve the identification of objects, two distinct objects oi, oj need to have different representations, vi 6=vj. The target properties in T are approximated by a model ˆf on vectors: Ti ≈fˆ(vi) wherevi ∈V. To find the function ˆf, ifTi andTj are different, vi and vj must be different:
!"
!#
$
%
&
'
(
)
$*, $,
$-
$.
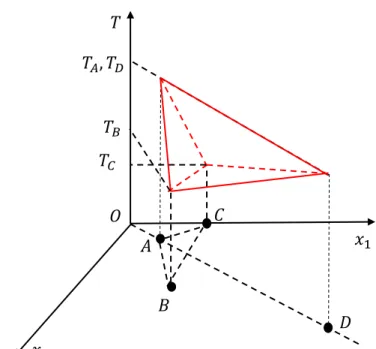
Figure 3.1: The illustration of abrupt changes in the target surface that is induced by the use of inappropriate combination of representation and similarity measure.
Ti 6=Tj ⇒vi 6=vj (3.1)
If we find two objectsoi andoj thatvi =vj and Ti 6=Tj, it is hard to find an appropriate function ˆf.
Inappropriately using the combination of representation and similarity mea- sure
As mentioned above, a small change in material structure can lead to significant change in material physical property. Suppose that the change between two objects oi and oj is defined by the Euclidean distance betweenvi and vj, denoted bydeuc(vi, vj). Let consider an example shown in Figure 3.1, when using inappropriate representation,deuc(A, B) and deuc(A, C) are small while |TA−TB| and TA −TC are significantly large. This makes estimating the TA based on TB and TC is imprecise. In general, inappropriately using representation method can make the surface indicating the target property become rough, and then makes similarity-based learning methods ineffective.
Suppose, with this representation, we use the cosine distance instead of Euclidean distance. Thus, we have dcos(A, D) = 0 and dcos(A, D) < dcos(A, B), dcos(A, C). In addition, TA = TD, so we can properly infer TA based on TD. That means the cosine distance is more appropriate than the Euclidean distance for this representation.
We address the problem that similarity-based learning methods become ineffective because of the inappropriate use of combination of representations and similarity measures that poorly distinguish materials with significant differences in physical property values.
There are two potential approaches for solving this problem: (i) finding an appropriate representation; (ii) finding an appropriate similarity measure for a given representation.
To find an appropriate representation of objects, it requires the prior knowledge about the nature of data. In fact, this knowledge is almost hidden, even though is out of our knowledge, hence, finding an appropriate representation is extremely difficult. In case of lacking prior knowledge, finding an appropriate similarity measure for a given representation is a potential solution. In this study, we concentrate on this approach.
Objectives
For selecting an appropriate similarity measure, simply, we can use the performance of existing similarity measures when they are used in instance-based learning methods. In fact, this criterion is just applicable for selecting available similarity measures, and is meaningless for interpreting and explaining the nature of data. Hence, we demand a more informative criterion that helps to gain insight into the nature of data. In addition, this criterion can be useful for designing new similarity measures.
3.4 Hypothesis on the influence of preserving the in- stances distinction in their reference-based simi- larity evaluation on the performance of similarity- based learning methods
As mentioned above, we attempt to explore an informative criterion for similarity measure selection, which is useful for gaining insight into the nature of data. In this section, we aim to clarify how similarity measures preserve the distinction of two instances when comparing them using a specific instance as a reference. In addition, we hypothesize the dependency of similarity-based model performance on this characteristic.
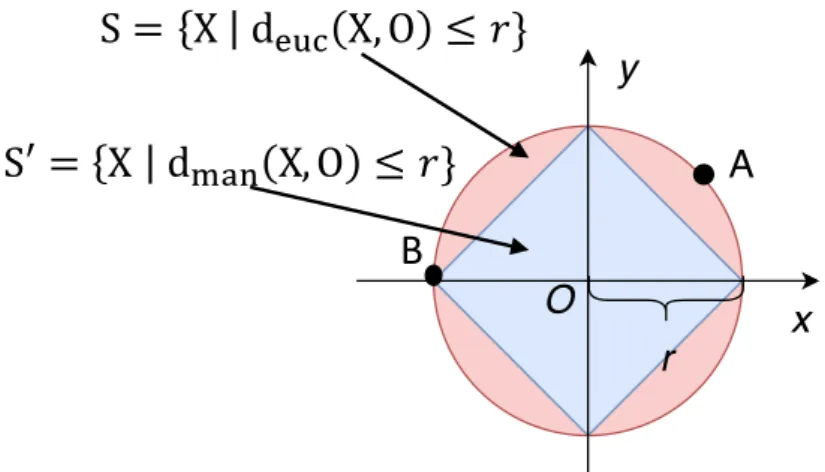
3.4.1 A comparison between the Manhattan distance and Eu- clidean distance in terms of their ability of preserving in- stance distinction in the reference-based similarity evalu- ation
We demonstrate the preservation of the distinction between two particular objects when these objects are compared using another object as a reference by considering the Man- hattan (1-norm) distance and Euclidean (2-norm) distance. As illustrated in Figure 3.2, let S = {X|deuc(X, O) ≤ r} be the set of points X whose Euclidean distances to O are smaller or equal than r; and S0 = {X|dman(X, O) ≤ r} be the set of points X whose Manhattan distances to O are smaller or equal than r. We compare two points A and B only based on their distance to O, thus, O is known as a referenced point for this comparison. By using the Euclidean distance, we see that A and B lost the distinction because of deuc(A, O) = deuc(B, O). Meanwhile, by using the Manhattan distance, we still preserve the distinction ofA and B because of dman(A, O) = dman(B, O). Hence, we conclude that the Manhattan distance preserves the distinction between A and B when comparing them based on their distance toO, but the Euclidean does not.
x y
O r
A
B
S = X$ $d
&'(X, O ≤ ,}
S′ = X$ $d
/01X, O ≤ ,}
Figure 3.2: The comparison between the Manhattan distance and Euclidean distance in terms of preserving the instances distinction when comparing these instances using a referenced instance. Area of the blue square indicates the set of instances that the Manhattan distance between these instances and O is smaller or equal than r. Area of the red circle indicates the set of instances that the Euclidean distance between them and O is smaller or equal than r.
3.4.2 The influence of preserving the instance distinction in their reference-based similarity evaluation on the perfor- mance of similarity-based learning models
Suppose that we need to estimate the target value at the instanceO that is denoted byyO. Ifr is small enough, S and S0 are the sets of O’s neighbors determined by the Euclidean and Manhattan distances, respectively. With neighbors in S (or in S0), the value of yO
can be estimated as the following:
ˆ yO= 1
|S| ×X
X∈S
yX
= 1
|S| × X
X+∈S+
yX+ + X
X−∈S−
yX−
! (3.2)
where S+ ⊂S is the set of neighbors in S whose target values are greater or equal than yO, yX+ = yO +σX+ with σX+ ≥ 0; S− ⊂ S is the set of neighbors whose target values are smaller than yO, yX− = yO −σX− with σX− > 0. Let σS+ = P
X+∈S+σX+, and σS− = −P
X−∈S−σX−. Actually, to precisely estimate yO, the ground truth is that the sum of σS+ and σS− approaches to 0, σS+ +σS− ≈ 0. Hence, if O is an extremum, this sum is significantly different from 0 because either S+ or S− is empty. Such situation is undesirable in which we cannot estimate yO correctly.
As mentioned above, the use of inappropriate descriptor can induce the roughness of the target surface. In other words, there has many abrupt changes of target values in the neighboring region of O. In fact, these changes can produce the previously mentioned undesirable situation in which the sum of σS+ and σS− is significantly different from 0, consequently, the estimation of yO is inaccurate. Therefore, we should determine neigh-
boring regions of O in which the changes of target values are as small as possible. If O is an extreme point, we expect that the number of neighbors used for estimating yO is also as small as possible.
Given the same value r, area of the neighboring region of O determined by the Eu- clidean distance is larger than that determined by the Manhattan distance, as shown in Figure 3.2. With the larger neighboring region, instances that have the small distance toO but significantly different target values to O and other neighbors of O have a high chance to be included in this region. By using the Manhattan distance that produces a smaller neighboring region, this chance can be lowered. Hence, we hypothesize that to improve the performance of similarity-based models for fitting rough target surface, it is needful to select similarity measures that preserve the distinction of two particu- lar instances when they are compared using a specific instance as a reference. However, the exceedingly preserving this distinction can lead to the overfitting problem because the number of neighbors used for inferring the target value at the instance of interest is extremely small. This induces the low prediction performance. Hence, the function indicating the dependency of the predictive performance on this distinction has an unique extreme point. At this point, the prediction accuracy attains the highest value.
3.5 Protocol for validating the proposed hypothesis
We demonstrate the proposed hypothesis mentioned in previous section through the study on selecting appropriate similarity measures used in instance-based learning methods for predicting materials’ formation energies. To validate this hypothesis, we need to point out the relation among: (i) the roughness of the target surface indicating the material formation energy given a representation of materials; (ii) the loss of instance distinction in reference-based similarity evaluation when using each similarity measure; and (iii) the high formation energy prediction accuracy. To this end, we employ a protocol, in which we attempt to quantify the loss mentioned in (ii), and to derive features indicating factors (i) and (iii). This protocol takes into account several well-known material representations, (dis)similarity measures, and similarity-based learning methods (e.g.,k−nearest neighbors regression, kernel ridge regression). In this section, firstly we introduce several well- known material representations and dissimilarity measures that are used for evaluating the similarity of objects. Next, we present about components in the proposed protocol in detail.
3.5.1 Material representation (descriptor)
Material descriptors aim to represent or encode real materials into mathematical forms for computation, in which, vector form is widely utilized, as shown in Figure 3.3. In this study, we investigate three well-known material descriptors: orbital field matrix; Coulomb matrix; and smooth overlap of atomic positions. To the best of our knowledge, these descriptors often help to improve the performance of machine learning models for predicting materials’ physical/chemical properties.