• 検索結果がありません。

Gene expression profile of side population cells in human oral cancer cell line SCC-4 Rie Nishiitsutsuji

N/A
N/A
Protected

Academic year: 2021

シェア "Gene expression profile of side population cells in human oral cancer cell line SCC-4 Rie Nishiitsutsuji"

Copied!
13
0
0

読み込み中.... (全文を見る)

全文

(1)

INTRODUCTION

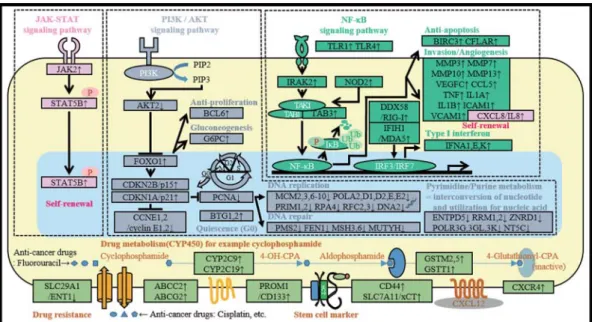
Cancer stem cells represent a small subset of cancer cells that self-renew, differentiate into multiple line- ages, and may generate and maintain the phenotypic heterogeneity of cancer cells.

1, 2

Evidence indicates that these cells give rise to tumor cells that are intrinsi- cally resistant to anti-cancer drugs

3−5

and oxidative stress.

6, 7

Moreover, they promote neoangiogenesis

8

and maintain a quiescent state by persisting in mi- croenvironments (niches).

9

Cancer stem cells are pre- sent in leukemias,

10, 11

breast cancers,

12

and colon can- cers.

13−16

A novel cancer therapy that targets cancer stem cells may serve as a potentiality radical cancer cure in the future. Cancer stem cells are identified and isolated according to their phenotypic properties as follows : cell-surface antigen expression,

3, 6, 7, 9−16

drug efflux (ABC transporter),

4, 5, 17, 18

sphere formation un- der specific conditions,

8, 19

proliferative potential, and

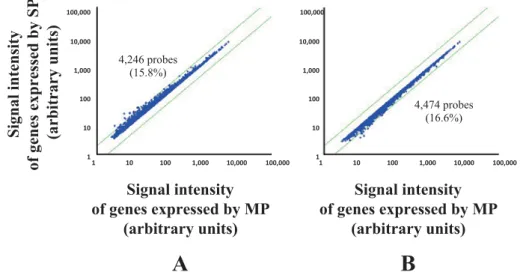
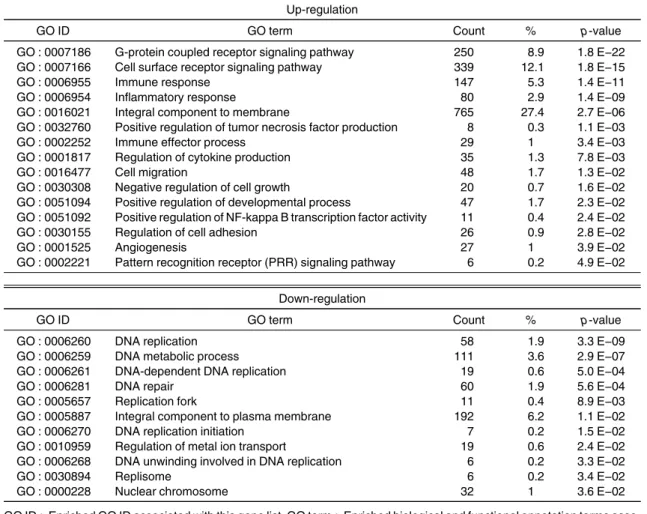
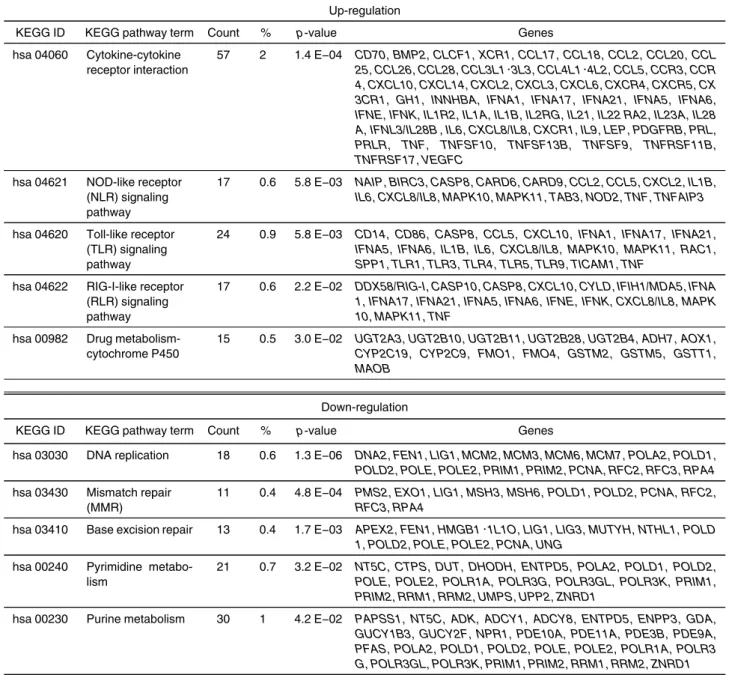
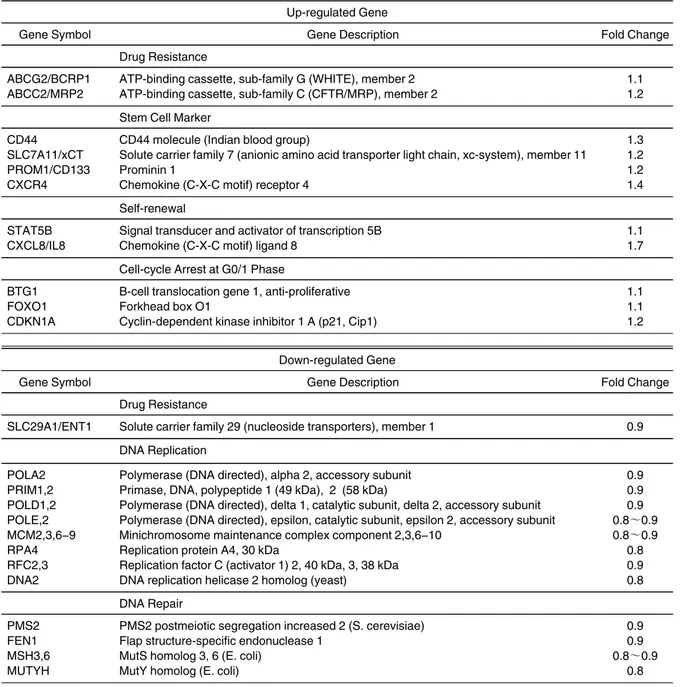
resistance to anti-cancer drugs and radiation. Using fluorescence-activated cell sorting (FACS), we iso- lated the cells that enhanced excretion of Hoechst 33342 in SCC-4. We performed comprehensive analysis to determine the gene expression profile of these cells.

MATERIALS AND METHODS Cell culture

The human oral squamous cell carcinoma cell line SCC-4 was purchased from DS Pharma Biomedical, Suita, Japan. Cells were cultured in Gibco DMEM/F12 (Thermo Fisher Scientific, Waltham, MA, USA) sup- plemented with 10% FBS (MP Biomedicals, Santa Ana, CA, USA), 100 units/mL of Gibco penicillin, 100 μ g/mL of Gibco streptomycin, 0.25 μ g/mL of Gibco Fungizone (Thermo Fisher Scientific), and 0.4 μ g/mL of hydrocortisone (MP Biomedicals) at 37° C in a hu- midified atmosphere containing 5% CO

2

.

Gene expression profile of side population cells in human oral cancer cell line SCC-4

Rie Nishiitsutsuji

1

, Tadashige Nozaki

2

and Kiyoshi Ohura

2

1

Graduate School of Dentistry (Department of Pharmacology),

2

Department of Pharmacology, Osaka Dental University, 8-1 Kuzuhahanazono-cho, Hirakata-shi, Osaka 573-1121, Japan

To define the properties of side population (SP) cells of the oral squamous cell carcinoma cell line SCC-4, we compared their gene expression profile with that of main population (MP) cells. SP cells accounted for approximately 1.5% of the cell population. The gene expression profile in SP cells versus MP cells revealed that 15.8% of genes were up-regulated by more than 10%, and 16.6% were down-regulated by more than 10%. Gene Ontology and KEGG pathway enrichment analyses were carried out on the DAVID online tool for 26,879 distinct probes (p <0.05). The terms involved in immune/inflammatory responses, cell migration and angiogenesis were detected as up-regulated genes. The terms related to DNA replica- tion, DNA metabolic process, mismatch repair and base excretion repair were detected as down-regulated genes. Moreover, mRNAs encoding the ABC transporters ABCG2/BCRP1 and ABCC2/MRP2, which mediate the excretion of anti-cancer drugs such as cisplatin and gefitinib, respectively, were expressed at higher levels. In contrast, the level of mRNA encod- ing the SLC transporter SLC29A1/ENT1, which mediates the uptake of anti-cancer drugs such as fluorouracil, was decreased. These results indicate that SCC-4 SP cells might be po- tentially resistant to anti-cancer drugs. (J Osaka Dent Univ 2015 ; 49 : 205−217)

Key words : Gene expression ; Oral cancer ; Side population ; Anti-cancer drug ; Drug re-

sistance

(2)

Isolation of SP cells

Hoechst 33342 dye has the capacity to incorporate into the A−T base sequence of DNA and to stain live cells that have high membrane permeability. When cells are stained with Hoechst 33342 and FACS analysis is performed using UV laser, the Hoechst 33342 is able to excite the cells at two-dimensional wavelengths, 450 nm and 675 nm fluorescence inten- sities. A total of 7×10

7

cells grown to 70% confluence were analyzed and separated using FACS. Hoechst 33342 was added to a final concentration of 5 μ M, and the cells were incubated for 45 min at 37° C with occa- sional agitation.

Reserpine was added to a final concentration of 5 μ M as an inhibitor of ABC transporters. Propidium io- dide was added to a final concentration of 1 μ g/mL to label nonviable cells, excluding the debris in the Hoechst-blue and Hoechst-red channels. In FACS analysis, SP cells have been identified as Hoechst low cells that exist in a darker fraction than the G0/G1 phase. MP cells have been identified as Hoechst high cells that are present in the diploid nuclear fraction.

Analysis and sorting were performed using a FACS Vantage SE (Becton, Dickinson and Company, Franklin Lakes, NJ, USA). SP and MP cells were sorted and harvested by ReproCELL, Yokohama, Ja- pan.

Microarray analysis

Total RNA was extracted from SP and MP cells using Invitrogen TRIzol Reagent (Thermo Fisher Scien- tific), according to the manufacturer’s instructions and purified using the RNeasy MinElute Cleanup Kit (Qiagen, Hilden, Germany). Gene expression pro- files of SP and MP cells were analyzed using the GeneChip

Human Gene 2.0 ST Array (Affymetrix, Santa Clara, CA, USA) containing 26,879 distinct probes. This procedure was performed at Kurabo In- dustries, Osaka, Japan. The Database for Annota- tion, Visualization and Integrated Discovery (DAVID) bioinformatics resource is made up of integrated bio- logical knowledge and analytic tools to phylogeneti- cally extract biological meaning from output gene lists.

20

In order to extract enrichment Gene Ontology (GO) terms and Kyoto Encyclopedia of Genes and

Genomes (KEGG) pathway terms by using statistical methods, GO and KEGG pathway enrichment analy- ses were performed on the DAVID v 6.7 online tool (http : //david.abcc.ncifcrf.gov/).

20

GO describes biological and functional annota- tions, such as biological processes, cellular compo- nents, and molecular functions. The KEGG pathways are graphical maps of cellular processes, such as me- tabolism, membrane transport, signal transduction, and the cell cycle.

21−23

The protocol for DAVID Func- tional Annotation Bioinformatics Microarray Analysis was used to make gene lists.

20

The protocol provides the researcher a detailed account of characteristics that create a good gene list. The good gene list meets seven requirements in the protocol.

20

The list of genes was uploaded using UniGene IDs.

Each up- or down-regulated genetic feature was re- vealed from the enriched GO and KEGG pathway terms in the DAVID database by specifying a statisti- cally significant threshold of p <0.05. The p-value was tested by the modified Fisher’s exact test. To con- firm the signaling pathways that were enriched in the SP cells, the up/down expressed groups of probes were classified as either yellow or green using the KEGG Mapper Search & Color Pathway analysis on the KEGG online tool (http : //www.genome.jp/kegg

/).

21−23

The list of genes was uploaded in accordance

with Entrez Gene IDs that were converted from Uni- Gene IDs.

Semi-quantitative RT-PCR analysis

The cDNAs were synthesized from total RNA using Invitrogen SuperScript VILO (Thermo Fisher Scien- tific) according to the manufacturer’s instructions.

PCR amplification of first-strand cDNAs was con- ducted using KOD FX Neo (Toyobo, Osaka, Japan).

The primer sets for RT-PCR were as follows : ABCC

2/MRP2, 5’-AGT GAT CAC CAT CGC CCA CA-3’ and

5’-GTT CAC ATT CTC AAT GCC AGC TTC-3’ ;

ABCG2/BCRP1, 5’-AGC TGC AAG GAA AGA TCC

AA-3’ and 5’-TCC AGA CAC ACC ACG GAT AA-3’ ;

SLC29A1/ENT1, 5’-GCC ACT CTA TCA AAG CCA

TCC TG-3’ and 5’-CCT GCG ATG CTG GAC TTG

AC-3’ ; Ribosomal protein S18 (RPS18), 5’-TTT

GCG AGT ACT CAA CAC CAA CAT C-3’ and 5’-GAG

(3)

CAT ATC TTC GGC CCA CAC-3’. RPS18 served as an internal control to normalize the semi-quantitative data. The products were electrophoresed through 15% (w/v) polyacrylamide gels (e-PAGEL ; ATTO, Tokyo, Japan) and stained with ethidium bromide.

The intensities of the amplicons were estimated using ImageJ software (http : //imagej.nih.gov/ij/). The ex- pression levels are presented as the ratio of values of

SP cells compared with those of MP cells.

RESULTS

SP cells existed in SCC-4

SP and MP cells accounted for 1.48% and 35.4% of the SCC-4 cell population, respectively (Fig. 1 A). Af- ter adding reserpine, the SP cell fraction decreased to 0.150%, while the MP cell fraction remained about the

Fig. 1 FACS analysis of SCC-4 cells stained with Hoechst 33342. Hoechst blue and red fluorescence intensities are plotted on the X- and Y-axes, respectively. Reserpine was used as an ABC transporter inhibitor that suppresses excretion of Hoechst 33342. (A) In the absence of 5 μ M reserpine, the side population (SP) cell populations were identified as 1.48% Hoechst negative cells and the main population (MP) cell populations were identified as 35.4% Hoechst positive cells. (B) In the presence of 5 μ M reserpine of ABC transporter inhibitor, the SP cell fraction decreased to 0.150%, confirming that it was an SP phenotype.

Fig. 2 Scatter-plot analysis. The levels of genes expressed by MP and SP cells are plotted on the X- and Y-axes, respectively.

The green lines indicate a 2-fold change in expression level. Genes with more than a 10% difference in the expression by the SP

cells were extracted for further analysis. Overall, 15.8% of the genes were up-regulated (Fig. 2 A) and 16.6% were down-regulated

(Fig. 2 B) in the SP cells compared with the MP cells.

(4)

same at 33.7% (Fig. 1 B).

Gene expression profile of SCC-4 SP cells

Among the entire 26,879 distinct probes, microarray analysis detected 4,246 (15.8%) of the probes that were differentially up-regulated and 4,474 (16.6%) of the probes that were down-regulated in SP versus MP cells (Figs. 2 A and 2 B).

Features of functional annotations in SP cells Using DAVID’s Functional Annotation Tool, significant GO terms were extracted from the genes that were up- or down-regulated (p <0.05) (Table 1). There were 242 and 88 significantly enriched GO terms in the up- and down-regulated groups, respectively. The representative GO terms and the corresponding gene

symbols were as follows. Up-regulation : Immune re- sponse (147 genes)/inflammatory response (80 genes)−CXCR4, IL1B, IL6, CXCL8/IL8 and TNF ; Integral component to membrane (765 genes)−

ABCC2/MRP2, ABCG2/BCRP1, CD44, PROM1/CD 133 and SLC7A11/xCT ; Negative regulation of cell growth (20 genes)−BCL6, BTG1, CDKN2AIP, TP53 TG5 and CDKN1A/p21 ; Positive regulation of NF- kappa B (NF- κ B) transcription factor activity (11 genes)/pattern recognition receptor (PRR) signaling pathway (6 genes)−IRAK2, NOD2, TLR3, TLR4 and TICAM1 ; Angiogenesis (27 genes)−SOX18, ANGPT1, ECSCR, PROK1 and VEGFC. Down- regulation : DNA replication (58 genes)−LIG1, MCM 2,3,6-10, POLD1,2, RFC2,3 and RPA4 ; DNA meta- bolic process (111 genes)−CDC 45, CHEK1, CDC25

Table 1 Features of functional annotations in SP cells

Up-regulation

GO ID GO term Count % p-value

GO : 0007186 GO : 0007166 GO : 0006955 GO : 0006954 GO : 0016021 GO : 0032760 GO : 0002252 GO : 0001817 GO : 0016477 GO : 0030308 GO : 0051094 GO : 0051092 GO : 0030155 GO : 0001525 GO : 0002221

G-protein coupled receptor signaling pathway Cell surface receptor signaling pathway Immune response

Inflammatory response

Integral component to membrane

Positive regulation of tumor necrosis factor production Immune effector process

Regulation of cytokine production Cell migration

Negative regulation of cell growth

Positive regulation of developmental process

Positive regulation of NF-kappa B transcription factor activity Regulation of cell adhesion

Angiogenesis

Pattern recognition receptor (PRR) signaling pathway

250 339 147 80 765 8 29 35 48 20 47 11 26 27 6

8.9 12.1 5.3 2.9 27.4 0.3 1 1.3 1.7 0.7 1.7 0.4 0.9 1 0.2

1.8 E−22 1.8 E−15 1.4 E−11 1.4 E−09 2.7 E−06 1.1 E−03 3.4 E−03 7.8 E−03 1.3 E−02 1.6 E−02 2.3 E−02 2.4 E−02 2.8 E−02 3.9 E−02 4.9 E−02

Down-regulation

GO ID GO term Count % p-value

GO : 0006260 GO : 0006259 GO : 0006261 GO : 0006281 GO : 0005657 GO : 0005887 GO : 0006270 GO : 0010959 GO : 0006268 GO : 0030894 GO : 0000228

DNA replication DNA metabolic process DNA-dependent DNA replication DNA repair

Replication fork

Integral component to plasma membrane DNA replication initiation

Regulation of metal ion transport

DNA unwinding involved in DNA replication Replisome

Nuclear chromosome

58 111 19 60 11 192 7 19 6 6 32

1.9 3.6 0.6 1.9 0.4 6.2 0.2 0.6 0.2 0.2 1

3.3 E−09

2.9 E−07

5.0 E−04

5.6 E−04

8.9 E−03

1.1 E−02

1.5 E−02

2.4 E−02

3.3 E−02

3.4 E−02

3.6 E−02

GO ID : Enriched GO ID associated with this gene list, GO term : Enriched biological and functional annotation terms asso-

ciated with this gene list, Count : Number of genes in the GO term, % : Term-involved genes/total genes in this gene list,

p-value : Threshold of a modified Fisher exact p-value for gene-enrichment analysis (p<0.05).

(5)

A, PMS1 and RAD51 ; DNA repair (60 genes)−DNA 2, FEN1, MSH3,6, MUTYH and PCNA ; Integral component to plasma membrane (192 genes)−SLC 29A1/ENT1 ; Regulation of metal ion transport (19 genes)−AKT2.

Features of frequent pathways in SP cells

Using the Functional Annotation Tool of DAVID, 23

and 10 significant KEGG pathway terms were ex- tracted from the up- and down-regulated groups of the gene lists, respectively (p <0.05) (Table 2). The rep- resentative KEGG pathway terms and the corre- sponding gene symbols were as follows. Up- regulation : Cytokine-cytokine receptor interaction (57 genes)−CXCR4, IL1B, IL6, CXCL8/IL8 and CXCR1 ; NOD-like receptor (NLR) signaling pathway

Table 2 Features of frequent pathways in SP cells

Up-regulation

KEGG ID KEGG pathway term Count % p-value Genes

hsa 04060 Cytokine-cytokine receptor interaction

57 2 1.4 E−04 CD70, BMP2, CLCF1, XCR1, CCL17, CCL18, CCL2, CCL20, CCL 25, CCL26, CCL28, CCL3L13L3, CCL4L14L2, CCL5, CCR3, CCR 4, CXCL10, CXCL14, CXCL2, CXCL3, CXCL6, CXCR4, CXCR5, CX 3CR1, GH1, INNHBA, IFNA1, IFNA17, IFNA21, IFNA5, IFNA6, IFNE, IFNK, IL1R2, IL1A, IL1B, IL2RG, IL21, IL22 RA2, IL23A, IL28 A, IFNL3/IL28B , IL6, CXCL8/IL8, CXCR1, IL9, LEP, PDGFRB, PRL, PRLR, TNF, TNFSF10, TNFSF13B, TNFSF9, TNFRSF11B, TNFRSF17, VEGFC

hsa 04621 NOD-like receptor (NLR) signaling pathway

17 0.6 5.8 E−03 NAIP, BIRC3, CASP8, CARD6, CARD9, CCL2, CCL5, CXCL2, IL1B, IL6, CXCL8/IL8, MAPK10, MAPK11, TAB3, NOD2, TNF, TNFAIP3

hsa 04620 Toll-like receptor (TLR) signaling pathway

24 0.9 5.8 E−03 CD14, CD86, CASP8, CCL5, CXCL10, IFNA1, IFNA17, IFNA21, IFNA5, IFNA6, IL1B, IL6, CXCL8/IL8, MAPK10, MAPK11, RAC1, SPP1, TLR1, TLR3, TLR4, TLR5, TLR9, TICAM1, TNF

hsa 04622 RIG-I-like receptor (RLR) signaling pathway

17 0.6 2.2 E−02 DDX58/RIG-I, CASP10, CASP8, CXCL10, CYLD, IFIH1/MDA5, IFNA 1, IFNA17, IFNA21, IFNA5, IFNA6, IFNE, IFNK, CXCL8/IL8, MAPK 10, MAPK11, TNF

hsa 00982 Drug metabolism- cytochrome P450

15 0.5 3.0 E−02 UGT2A3, UGT2B10, UGT2B11, UGT2B28, UGT2B4, ADH7, AOX1, CYP2C19, CYP2C9, FMO1, FMO4, GSTM2, GSTM5, GSTT1, MAOB

Down-regulation

KEGG ID KEGG pathway term Count % p-value Genes

hsa 03030 DNA replication 18 0.6 1.3 E−06 DNA2, FEN1, LIG1, MCM2, MCM3, MCM6, MCM7, POLA2, POLD1, POLD2, POLE, POLE2, PRIM1, PRIM2, PCNA, RFC2, RFC3, RPA4 hsa 03430 Mismatch repair

(MMR)

11 0.4 4.8 E−04 PMS2, EXO1, LIG1, MSH3, MSH6, POLD1, POLD2, PCNA, RFC2, RFC3, RPA4

hsa 03410 Base excision repair 13 0.4 1.7 E−03 APEX2, FEN1, HMGB11L1O, LIG1, LIG3, MUTYH, NTHL1, POLD 1, POLD2, POLE, POLE2, PCNA, UNG

hsa 00240 Pyrimidine metabo- lism

21 0.7 3.2 E−02 NT5C, CTPS, DUT, DHODH, ENTPD5, POLA2, POLD1, POLD2, POLE, POLE2, POLR1A, POLR3G, POLR3GL, POLR3K, PRIM1, PRIM2, RRM1, RRM2, UMPS, UPP2, ZNRD1

hsa 00230 Purine metabolism 30 1 4.2 E−02 PAPSS1, NT5C, ADK, ADCY1, ADCY8, ENTPD5, ENPP3, GDA,

GUCY1B3, GUCY2F, NPR1, PDE10A, PDE11A, PDE3B, PDE9A,

PFAS, POLA2, POLD1, POLD2, POLE, POLE2, POLR1A, POLR3

G, POLR3GL, POLR3K, PRIM1, PRIM2, RRM1, RRM2, ZNRD1

KEGG pathway ID : Enriched KEGG pathway ID associated with this gene list, KEGG pathway term : Enriched KEGG pathway term asso-

ciated with this gene list, Count : Number of genes in the KEGG pathway term, % : Term-involved genes/total genes in this gene list, p-

value : Threshold of a modified Fisher exact p-value for gene-enrichment analysis (p<0.05), Genes : Genes involved in the term.

(6)

(17 genes)−CARD9, CCL5, TAB3, NOD2 and TNF ; Toll-like receptor (TLR) signaling pathway (24 genes)−CD14, RAC1, TLR1, TLR4 and TICAM1 ; RIG-I-like receptor (RLR) signaling pathway (17 genes)−DDX58/RIG-I, IFIH 1/MDA 5, IFNA 1, IFNE and IFNK ; Drug metabolism−cytochrome P450 (15 genes)−CYP2C19, CYP2C9, GSTM2, GSTM5 and GSTT1. Down-regulation : DNA replication (18 genes)−MCM2,3,6,7, POLD1,2, PRIM1,2, RFC2,3 and RPA4 ; Mismatch repair (MMR) (11 genes)−

PMS2, LIG1, MSH3,6, POLD1,2 and PCNA ; Base excision repair (13 genes)−APEX2, FEN1, MUTYH, POLE, E2 and UNG ; Pyrimidine metabolism (21 genes)−CTPS, DUT, ENTPD5, POLA2 and RRM 1,2 ; Purine metabolism (30 genes)−NT5C, ADK, ADCY1,8, GUCY1B3,2F and PDE3B,9A,10A,11A.

Lists of representative genes differentially ex- pressed in SP cells

Representative genes with differences in expression

Table 3 Lists of representative genes differentially expressed in SP cells Up-regulated Gene

Gene Symbol Gene Description Fold Change

Drug Resistance ABCG2/BCRP1

ABCC2/MRP2

ATP-binding cassette, sub-family G (WHITE), member 2 ATP-binding cassette, sub-family C (CFTR/MRP), member 2

1.1 1.2 Stem Cell Marker

CD44 SLC7A11/xCT PROM1/CD133 CXCR4

CD44 molecule (Indian blood group)

Solute carrier family 7 (anionic amino acid transporter light chain, xc-system), member 11 Prominin 1

Chemokine (C-X-C motif) receptor 4

1.3 1.2 1.2 1.4 Self-renewal

STAT5B CXCL8/IL8

Signal transducer and activator of transcription 5B Chemokine (C-X-C motif) ligand 8

1.1 1.7 Cell-cycle Arrest at G0/1 Phase

BTG1 FOXO1 CDKN1A

B-cell translocation gene 1, anti-proliferative Forkhead box O1

Cyclin-dependent kinase inhibitor 1 A (p21, Cip1)

1.1 1.1 1.2

Down-regulated Gene

Gene Symbol Gene Description Fold Change

Drug Resistance

SLC29A1/ENT1 Solute carrier family 29 (nucleoside transporters), member 1 0.9 DNA Replication

POLA2 PRIM1,2 POLD1,2 POLE,2 MCM2,3,6−9 RPA4 RFC2,3 DNA2

Polymerase (DNA directed), alpha 2, accessory subunit Primase, DNA, polypeptide 1 (49 kDa), 2 (58 kDa)

Polymerase (DNA directed), delta 1, catalytic subunit, delta 2, accessory subunit Polymerase (DNA directed), epsilon, catalytic subunit, epsilon 2, accessory subunit Minichromosome maintenance complex component 2,3,6−10

Replication protein A4, 30 kDa

Replication factor C (activator 1) 2, 40 kDa, 3, 38 kDa DNA replication helicase 2 homolog (yeast)

0.9 0.9 0.9 0.8〜0.9 0.8〜0.9

0.8 0.9 0.8 DNA Repair

PMS2 FEN1 MSH3,6 MUTYH

PMS2 postmeiotic segregation increased 2 (S. cerevisiae) Flap structure-specific endonuclease 1

MutS homolog 3, 6 (E. coli) MutY homolog (E. coli)

0.9 0.9 0.8〜0.9

0.8

(7)

between SP cells versus MP cells on the basis of re- sults from GO and KEGG pathway enrichment analy- ses are presented in Table 3. ABCC2/MRP2 and ABCG2/BCRP1 were up-regulated and SLC29A1/

ENT1 was down-regulated (Table 3). Using signifi- cantly enriched KEGG pathway maps from DAVID analysis as reference, up-regulated genes were clas- sified as drug resistance, stem cell marker, self- renewal or cell-cycle arrest at G0/1 phase. The down-regulated genes were classified as drug resis- tance, DNA replication or DNA repair.

Close-up specific pathways identified using KEGG Mapper Search & Color Pathway analysis NF- κ B signaling pathway (Fig. 3 A), DNA replication pathway (Fig. 3 B), MMR pathway (Fig. 3 C), and ABC transporter pathway (Fig. 3 D) were extracted by KEGG Mapper Search & Color Pathway analysis. In particular, inflammatory cytokines such as IL1B and TNF, transmembrane receptors such as CD14 and TLR4, and intracellular receptors such as DDX58/

RIG-I were enhanced in the canonical (classical) NF- κ B signaling pathway and these signals were ter- minated to enhancement of genes encoding survival, activation of non-canonical pathway, cytokines as positive feedback, and inflammation (Fig. 3 A). There were no up-regulated genes except for one gene in the DNA replication pathway (Fig. 3 B). Seven genes were markedly decreased in the 12 genes encoding the DNA polymerase family ( α , δ , and ε ). The MMR pathway also had no up-regulated genes (Fig. 3 C).

Moreover, 10 genes, including the PMS2, MSH3 and MSH6 genes, were down-regulated among the 22 genes in this pathway. The ABC transporter pathway was shown for an overview of the ABC transporter genes (Fig. 3 D). The ABCA2/ABC2, ABCC2/MRP2 and ABCG2/BCRP1 genes were up-regulated.

Prospects of activated signaling pathways asso- ciated with anti-cancer drug resistance in SP cells The results of GO and KEGG pathway enrichment analyses and KEGG Mapper Search & Color Pathway analysis predicted the specific biological functions and activated pathways in SP cells (Fig. 4). The NF- κ B signals through PRR (TLR, NLR and RLR) path-

ways induce cancer progression relating to anti- apoptosis, invasion and angiogenesis. The STAT5 and CXCL8/IL8 signals contribute to self-renewal of stem cells. The FOXO1 and BTG1 signals contribute to cell-cycle arrest at the G0/1 phase. In SP cells, these signals were enhanced. DNA replication and pyrimidine/purine metabolism were suppressed. The mismatch repair system may be decreased in SP cells, suggesting that the depression of mismatch re- pair may induce insensitivity to cisplatin. SLC29A1/

ENT1, which is involved in the uptake of fluorouracil, was also suppressed.

These drug metabolic enzymatic signals may con- tribute to suppression of cyclophosphamide activity.

Moreover, ABCC2/MRP2 and ABCG2/BCRP1, which are involved in export of anti-cancer drugs, were up- regulated.

Expression of genes encoding transporter pro- teins associated with anti-cancer drug resistance The expression of genes encoding proteins that con- fer drug resistance was determined using RT-PCR analysis. ABCC2/MRP2 and ABCG2/BCRP1 were up-regulated ; however, the expression of SLC29A1/

ENT1 was down-regulated in SP cells (Fig. 5). Data analyzed using ImageJ are shown in the graph. The values were normalized to that of an internal control (RPS18 ).

DISCUSSION

The population of SP cells present in human cancer cell lines varies markedly (0.2%−10%).

5, 17

In the pre- sent study, the SP and MP cell populations in SCC-4 were 1.48% and 35.4%, respectively (Fig. 1 A). In the presence of the ABC transporter inhibitor reserpine, the ratio of the SP cell fraction decreased to 0.150%

and that of the MP cell fraction was almost unchanged (Fig. 1 B), suggesting that SP cells with a strong ability to excrete Hoechst 33342 existed in the SCC-4.

4, 5, 17, 18

Because the uptake of Hoechst 33342 mediated by

ABCG2/BCRP1 is inhibited by reserpine, expression

of ABCG2/BCRP1 is an important determinant of the

SP phenotype.

18

Although it is shown that only 44

probes were differentially expressed by 2-fold in SP

cells, the expression of ABCG2/BCRP1 was in-

(8)

Fig. 3 Pathways identified using KEGG Mapper Search & Color Pathway analysis. The pathways extracted using this analysis

were (A) the NF- κ B signaling pathway, (B) the DNA replication pathway, (C) the MMR pathway, and (D) the ABC transporter path-

way. Genes that were up-regulated by more than 10% are displayed in yellow and those down-regulated by more than 10% are

shown in green. Abbreviations (Fig. 3 A) CD14 : CD14 molecule ; DDX58/RIG-I : DEAD (Asp-Glu-Ala-Asp) box polypeptide 58

/Retinoic acid-inducible gene 1 ; IL1B : Interleukin 1, beta ; TLR4 : Toll-like receptor 4 ; and TNF : Tumor necrosis factor ;

(Fig. 3 B) DNA polymerase α complex : Polymerase (DNA directed), alpha (POLA) 1〜2 and Primase, DNA, polypeptide

(PRIM) 1〜2 ; DNA polymerase δ complex : Polymerase (DNA directed), delta (POLD) 1〜4 ; and DNA polymerase ε com-

plex : Polymerase (DNA directed), epsilon (POLE) 1〜4 ;

(9)

(Fig. 3 C) PMS2 : Postmeiotic segregation increased 2 ; MSH3 : MutS homolog 3 ; and MSH6 : MutS homolog 6 ; (Fig. 3 D)

ABCA2/ABC2 : ATP-binding cassette, sub-family A (ABC1), member 2/ATP-binding cassette 2 ; ABCC2/MRP2 : ATP-binding

cassette, sub-family C (CFTR/MRP), member 2/Multidrug resistance-associated protein 2 ; and ABCG2/BCRP1 : ATP-binding

cassette, sub-family G (WHITE), member 2/ Breast cancer resistance protein 1.

(10)

creased by more than 10% in SP compared with MP cells. For this reason, we defined a change of greater than 10% as the critical threshold. While 15.8% of the up-regulated genes showed this critical degree of dif- ferential expression (Fig. 2 A), 16.6% of the down-

regulated genes did (Fig. 2 B).

The significant enrichment GO terms revealed by DAVID analysis represented by differentially ex- pressed genes are presented in Table 1 (p <0.05).

Among the up-regulated genes, the associated GO terms include immune and inflammatory responses, positive regulation of NF- κ B transcription factor activ- ity, and PRR signaling pathway. The GO terms are re- lated to cell migration, negative regulation of cell growth, and angiogenesis. GO terms related to DNA replication, DNA metabolic processes, and DNA re- pair were the most highly enriched with genes that were down-regulated.

The significant enrichment KEGG pathway terms revealed by DAVID analysis are presented in Table 2 (p <0.05). Enriched KEGG terms are related to the cytokine−cytokine receptor interaction pathway, the NLR signaling pathway, the TLR signaling pathway, the RLR signaling pathway, and the drug metabolism -cytochrome P450-pathway in the up-regulated genes. NLR, TLR, and RLR signaling pathways de-

Fig. 5 The expression of genes associated with anti-cancer drug resistance. The electrophoresis bands represent the expres- sion levels of each gene by RT-PCR. ABCC2/MRP2 and ABCG 2/BCRP1 were up-regulated, while SLC29A1/ENT1 was down- regulated in the SP cells. Data analyzed using ImageJ are shown in the graph. The relative level is presented as the fold changes in SP versus MP cells. The values were corrected by an internal control (RPS18).

Fig. 4 Proposal of signaling pathways activated in SP cells. The activation of signaling pathways based on the comparative gene

expression profile in SP cells are shown here. The NF- κ B signals through the PRR (TLR, NLR and RLR) pathways induce cancer

progression related to anti-apoptosis, invasion and angiogenesis. The STAT5 and CXCL8/IL8 signals contribute to self-renewal

of stem cells. The FOXO1 and BTG1 signals contribute to cell-cycle arrest at the G0/1 phase. These signals were enhanced in the

SP cells. DNA replication and pyrimidine/purine metabolism were suppressed. The mismatch repair system may be decreased in

SP cells, suggesting that the depression of mismatch repair may induce insensitivity to cisplatin. SLC29A1/ENT1 involved in the

uptake of fluorouracil was also suppressed. These drug metabolic enzymatic signals may contribute to suppression of cyclophos-

phamide activity. ABCC2/MRP2 and ABCG2/BCRP1, which are involved in the excretion of anti-cancer drugs, were up-

regulated. This shows the identities and functions of the pathways related to drug-resistance.

(11)

rived from KEGG pathway analysis correlate with PI3 K-AKT, NF- κ B, JAK-STAT, and MAPK-signaling pathways. KEGG terms related to DNA replication, MMR, base excision repair, pyrimidine metabolism, and purine metabolism (synthesis of nucleotides) were enriched for genes that were down-regulated.

Representative genes associated with sufficient en- richment GO terms as well as KEGG pathway terms revealed by DAVID analyses are shown in Table 3.

Although DAVID analyses are advantageous for identifying specific GO and KEGG pathway terms, which include genes that are significantly enriched (p

<0.05), they do not distinguish between an increase or decrease in gene expression. To compensate for this, KEGG Mapper Search & Color Pathway analysis was performed by classifying changes of gene ex- pression according to the numerical size of the genes. From specific GO and KEGG pathway terms associated with SP cells, the representative examples implicate the following pathways : the NF- κ B signal- ing pathway (Fig. 3 A), the DNA replication pathway (Fig. 3 B), the MMR pathway (Fig. 3 C), and the ABC transporter pathway (Fig. 3 D). The NF- κ B signals that mediated CD14, DDX58/RIG-I, IL1B, TLR4 and TNF were especially enhanced downstream in the canoni- cal (classical) NF- κ B signaling pathway (Fig. 3 A). The DNA replication and MMR pathways did not include all the up-regulated genes except POLD4 (Figs. 3 B and 3 C). Seven of the 12 genes encoding the main DNA polymerase family ( α , δ and ε ) for human DNA replication were decreased in the DNA replication pathway. Ten of the entire 22 genes including PMS2, MSH3 and MSH6, were suppressed in the MMR path- way. Although the ABC transporter pathway was not extracted by KEGG pathway enrichment analysis, the results in Fig. 3 D showed that the ABCA2/ABC2, ABCC2/MRP2 and ABCG2/BCRP1 genes were up- regulated in 11 ABC transporter genes (ABCA2/ABC 2, ABCB1/MDR1, ABCC1〜6/MRP1〜6, ABCC10/

MRP7, ABCC11/MRP8 and ABCG2/BCRP1) associ- ated with export of anti-cancer drugs.

Accordingly, the prediction of activated pathway maps based on the profile in this study is also shown in Fig. 4. Inflammation induces activation of NF- κ B and its downstream target genes that encode IL-6 and

CXCL8/IL-8, which mediate angiogenesis, tumor growth and metastasis.

24

IL-6 and CXCL8/IL-8, in turn, function as positive feedback regulators by acti- vating the NF- κ B/STAT3 pathways to stimulate fur- ther cytokine production.

24

Moreover, IL-6 and CXCL 8/IL-8 regulate the self-renewal of breast cancer stem cells.

25, 26

SP cells expressed higher levels of IL-6 and CXCL8/IL-8 mRNAs compared with MP cells, sug- gesting that they may mediate inflammation and self- renewal.

AKT inhibition and FOXO activation maintain leuke- mia stem cell homeostasis.

27

CDKN1A/P21 maintains the quiescence of stem cells and contributes to long- term remodeling of bone marrow.

28

Consistent with these findings, we found that transcription of AKT2 decreased and those of FOXO1, CDKN1A/P21 and CDKN2B/P15 increased in SP cells. Moreover, the expression of genes related to the DNA replication pathway mediated by CDKN1A/P21 and PCNA, such as MCM2, 3, 6−10 ; POLD1 ; and POLD2 was de- creased, suggesting that the SP cells of SCC-4 might not exist at the S phase.

29

BTG1 is expressed at high levels during G0/G1 and is down-regulated during the transition to G1.

30

In the present study, the high level of BTG1 expression sug- gests that SP cells may arrest in G0/G1. The expres- sion levels of FOXO1 and CDKN1A/P21 are consis- tent with this possibility. Cell-cycle arrest impedes therapy using conventional anti-cancer drugs that in- hibit dividing cells. In particular, it is known that MMR inactive cells developed high resistance to multi-anti- cancer agents such as monovalent alkylating agents, 6-thioguanine and 6-mercaptopurine,

31, 32

or cisplatin.

33

These findings indicate that SP cells may be relatively insensitive to these drugs.

Taken together, the profiles obtained in this study

indicate that SP cells may have multi-resistance for

anti-cancer drugs. The SP phenotype is determined

by the expression of the ABC transporter genes such

as ABCG2/BCRP1.

18

The ABC transporters are clas-

sified as “excretion type” and SLC transporters as “up-

take type.” RT-PCR analysis (Fig. 5) detected up-

regulation of the expression of ABCG2/BCRP1 and

ABCC2/MPR2 in SP cells by 1.8- and 1.1-fold, re-

spectively. On the other hands, the expression of SLC

(12)

29A1/ENT1 was down-regulated by 0.9-fold.

ABCC2/MRP2 and ABCG2/BCRP1 involved in ex- port of anti-cancer drugs, such as cisplatin and gefit- inib respectively, were up-regulated.

34

The drugs VX 710 (biricodar) and GF120918 (elacridar) were devel- oped to overcome resistance to chemotherapeutic drugs by targeting ABC transporters.

35

Moreover, SLC 29A1/ENT1 involved in uptake of anti-cancer drugs such as the nucleoside derivative fluorouracil was also suppressed.

36

The drug sulfasalazine is adminis- tered as an SLC transporter inhibitor to prevent cyste- ine uptake by the xCT subunit of system xc (−), result- ing in suppression of CD44 function.

7, 37

The differen- tial expression of genes related to these transporters demonstrated here suggests that they might mediate excretion or uptake of the anti-cancer drugs in SP cells of SCC-4.

The pattern of gene expression of SP cells isolated from cultures of the SCC-4 might be similar to that of stem cells that show the self-renewal and cell-cycle arrest in G0/G1. Furthermore, these data predict that SP cells are resistant to anti-cancer drugs. We pro- pose that a promising pharmacological approach for the treatment targeting the cancer stem-like cells is to develop specific inhibitors of the drug resistance as- sociated pathway. Based on this study, we need fur- ther research focused on the sensitivity of SP cells to drugs used for oral cancer therapy.

This study was supported, in part, by grants from Osaka Den- tal University Research Funds (15−01). The study was per- formed, in part, at the Institute of Dental Research, Osaka Dental University.

REFERENCES

1. Clarke MF, Dick JE, Dirks PB, Eaves CJ, Jamieson CH, Jones DL, Visvader J, Weissman IL, Wahl GM. Cancer stem cells−

perspectives on current status and future directions : AACR Workshop on cancer stem cells. Cancer Res 2006 ; 66 : 9939

−9344.

2. Garvalov BK, Acker T. Cancer stem cells : a new framework for the design of tumor therapies. J Mol Med (Berl) 2011 ; 89 : 95−107.

3. Hermann PC, Huber SL, Herrler T, Aicher T, Ellwart JW, Guba M, Bruns CJ, Heeschen C. Distinct populations of cancer stem cells determine tumor growth and metastatic activity in human pancreatic cancer. Cell Stem Cell 2007 ; 1 : 313−323.

4. Hirschmann-Jax C, Foster AE, Wulf GG, Nuchtern JG, Jax TW, Gobel U, Goodell MA, Brenner MK. A distinct “side popu- lation” of cells with high drug efflux capacity in human tumor

cells. Proc Natl Acad Sci USA 2004 ; 101 : 14228−14233.

5. Haraguchi N, Utsunomiya T, Inoue H, Tanaka F, Mimori K, Barnard GF, Mori M. Characterization of a side population of cancer cells from human gastrointestinal system. Stem Cells 2006 ; 24 : 506−513.

6. Diehn M, Cho RW, Lobo NA, Kalisky T, Dorie MJ, Kulp AN, Qian D, Lam JS, Ailles LE, Wong M, Joshua B, Kaplan MJ, Wapnir I, Dirbas FM, Somlo G, Garberoglio C, Paz B, Shen J, Lau SK, Quake SR, Brown JM, Weissman IL, Clarke MF. As- sociation of reactive oxygen species levels and radioresis- tance in cancer stem cells. Nature 2009 ; 458 : 780−783.

7. Ishimoto T, Nagano O, Yae T, Tamada M, Motohara T, Oshima H, Oshima M, Ikeda T, Asaba R, Yagi H, Masuko T, Shimizu T, Ishikawa T, Kai K, Takahashi E, Imamura Y, Baba Y, Oh- mura M, Suematsu M, Baba H, Saya H. CD44 variant regu- lates redox status in cancer cells by stabilizing the xCT subunit of system xc(−) and thereby promotes tumor growth. Cancer Cell 2011 ; 19 : 387−400.

8. Oka N, Soeda A, Inagaki A, Onodera M, Maruyama H, Hara A, Kunisada T, Mori H, Iwama T. VEGF promotes tumorigene- sis and angiogenesis of human glioblastoma stem cells. Bio- chem Biophys Res Commun 2007 ; 360 : 553−559.

9. Ishikawa F, Yoshida S, Saito Y, Hijikata A, Kitamura H, Tanaka S, Nakamura R, Tanaka T, Tomiyama H, Saito N, Fukata M, Miyamoto T, Lyons B, Ohshima K, Uchida N, Taniguchi S, Ohara O, Akashi K, Harada M, Shultz LD. Chemotherapy- resistant human AML stem cells home to and engraft within the bone-marrow endosteal region. Nat Biotechnol 2007 ; 25 : 1315−1321.

10. Lapidot T, Sirard C, Vormoor J, Murdoch B, Hoang T, Caceres-Cortes J, Minden M, Paterson B, Caligiuri MA, Dick JE. A cell initiating human acute myeloid leukaemia after trans- plantation into SCID mice. Nature 1994 ; 367 : 645−648.

11. Bonnet D, Dick JE. Human acute myeloid leukemia is organ- ized as a hierarchy that originates from a primitive hematopoie- tic cell. Nat Med 1997 ; 3 : 730−737.

12. Al-Hajj M, Wicha MS, Benito-Hernandez A, Morrison SJ, Clarke MF. Prospective identification of tumorigenic breast cancer cells. Proc Natl Acad Sci USA 2003 ; 100 : 3983−

3988.

13. O’Brien CA, Pollett A, Gallinger S, Dick JE. A human colon cancer cell capable of initiating tumor growth in immunodefi- cient mice. Nature 2007 ; 445 : 106−110.

14. Rich-Vitiani L, Lombardi DG, Pilozzi E, Biffoni M, Todaro M, Peschle C, De Maria R. Identification and expansion of human colon-cancer-initiating cells. Nature 2007 ; 445 : 111−115.

15. Dalerba P, Dylla SJ, Park IK, Liu R, Wang X, Cho RW, Hoey T, Gurney A, Huang EH, Simeone DM, Shelton AA, Parmiani G, Castelli C, Clarke MF. Phenotypic characterization of hu- man colorectal cancer stem cells. Proc Natl Acad Sci USA 2007 ; 104 : 10158−10163.

16. Shmelkov SV, Butler JM, Hooper AT, Hormigo A, Kushner J, Milde T, St Clair R, Baljevic M, White I, Jin DK, Chadburn A, Murphy AJ, Valenzuela DM, Gale NW, Thurston G, Yancopou- los GD, D’Angelica M, Kemeny N, Lyden D, Rafii S. CD133 ex- pression is not restricted to stem cells, and both CD133+ and CD133− metastatic colon cancer cells initiate tumors. J Clin Invest 2008 ; 118 : 2111−2120.

17. Zhang P, Zhang Y, Mao L, Zhang Z, Chen W. Side population in oral squamous cell carcinoma possesses tumor stem cell phenotypes. Cancer Lett 2009 ; 277 : 227−234.

18. Zhou S, Schuetz JD, Bunting KD, Colapietro AM, Sampath J,

Morris JJ, Lagutina I, Grosveld GC, Osawa M, Nakauchi H,

(13)

Sorrentino BP. The ABC transporter Bcrp 1/ABCG2 is ex- pressed in a wide variety of stem cells and is a molecular deter- minant of the side-population phenotype. Nat Med 2001 ; 7 : 1028−1034.

19. Ponti D, Costa A, Zaffaroni N, Pratesi G, Petrangolini G, Co- radini D, Pilotti S, Pierotti MA, Daidone MG. Isolation and in vi- tro propagation of tumorigenic breast cancer cells with stem/

progenitor cell properties. Cancer Res 2005 ; 65 : 5506−

5511.

20. Huang da W, Sherman BT, Lempicki RA. Systematic and inte- grative analysis of large gene lists using DAVID bioinformatics resources. Nat Protoc 2009 ; 4 : 44−57.

21. Kanehisa M, Goto S. KEGG : Kyoto encyclopedia of genes and genomes. Nucleic Acids Res 2000 ; 28 : 27−30.

22. Kanehisa M, Goto S, Hattori M, Aoki-Kinoshita KF, Itoh M, Kawashima T, Katayama T, Araki M, Hirakawa M. From genomics to chemical genomics : new developments in KEGG. Nucleic Acids Res 2006 ; 34(Database issue) : D354

−D357.

23. Kanehisa M, Goto S, Sato Y, Furumichi M, Tanabe M. KEGG for integration and interpretation of large-scale molecular data sets. Nucleic Acids Res 2012 ; 40(Database issue) : D109−

D114.

24. Korkaya H, Liu S, Wicha MS. Regulation of cancer stem cells by cytokine networks : attacking cancer’s inflammatory roots.

Clin Cancer Res 2011 ; 17 : 6125−6129.

25. Sansone P, Storci G, Tavolari S, Guarnieri T, Giovannini C, Taffurelli M, Ceccarelli C, Santini D, Paterini P, Marcu KB, Chieco P, Bonafè M. IL-6 triggers malignant features in mam- mospheres from human ductal breast carcinoma and normal mammary gland. J Clin Invest 2007 ; 117 : 3988−4002.

26. Ginestier C, Liu S, Diebel ME, Korkaya H, Luo M, Brown M, Wicinski J, Cabaud O, Charafe-Jauffret E, Birnbaum D, Guan JL, Dontu G, Wicha MS. CXCR1 blockade selectively targets human breast cancer stem cells in vitro and in xenografts. J Clin Invest 2010 ; 120 : 485−497.

27. Naka K, Hoshii T, Muraguchi T, Tadokoro Y, Ooshio T, Kondo Y, Nakao S, Motoyama N, Hirao A. TGF-beta-FOXO signalling

maintains leukaemia-initiating cells in chronic myeloid leukae- mia. Nature 2010 ; 463 : 676−680.

28. Cheng T, Rodrigues N, Shen H, Yang Y, Dombkowski D, Sykes M, Scadden DT. Hematopoietic stem cell quiescence maintained by p21 cip1/waf1. Science 2000 ; 287 : 1804−

1808.

29. Blow JJ, Dutta A. Preventing re-replication of chromosomal DNA. Nat Rev Mol Cell Biol 2005 ; 6 : 476−486.

30. Rouault JP, Rimokh R, Tessa C, Paranhos G, Ffrench M, Duret L, Garoccio M, Germain D, Samarut J, Magaud JP. BTG 1, a member of a new family of antiproliferative genes. EMBO J 1992 ; 11 : 1663−1670.

31. Branch P, Aquilina G, Bignami M, Karran P. Defective mis- match binding and a mutator phenotype in cells tolerant to DNA damage. Nature 1993 ; 362 : 652−654.

32. Swann PF, Waters TR, Moulton DC, Xu YZ, Zheng Q, Edwards M, Mace R. Role of postreplicative DNA mismatch repair in the cytotoxic action of thioguanine. Science 1996 ; 273 : 1109−

1111.

33. Fink D, Nebel S, Aebi S, Zheng H, Cenni B, Nehmé A, Christen RD, Howell SB. The role of DNA mismatch repair in platinum drug resistance. Cancer Res 1996 ; 56 : 4881−4886.

34. Haimeur A, Conseil G, Deeley RG, Cole SP. The MRP-related and BCRP/ABCG2 multidrug resistance proteins : biology, substrate specificity and regulation. Curr Drug Metab 2004 ; 5 : 21−53.

35. Matsson P, Pedersen JM, Norinder U, Bergström CA, Arturs- son P. Identification of novel specific and general inhibitors of the three major human ATP-binding cassette transporters P- gp, BCRP and MRP2 among registered drugs. Pharm Res 2009 ; 26 : 1816−1831.

36. Mangravite LM, Badagnani I, Giacomini KM. Nucleoside trans- porters in the disposition and targeting of nucleoside analogs in the kidney. Eur J Pharmacol 2003 ; 479 : 269−281.

37. Gout PW, Buckley AR, Simms CR, Bruchovsky N. Sul-

fasalazine, a potent suppressor of lymphoma growth by inhibi-

tion of the x(c)− cystine transporter : a new action for an old

drug. Leukemia 2001 ; 15 : 1633−1640.

Fig. 2 Scatter-plot analysis. The levels of genes expressed by MP and SP cells are plotted on the X- and Y-axes, respectively.
Table 1 Features of functional annotations in SP cells
Table 2 Features of frequent pathways in SP cells
Table 3 Lists of representative genes differentially expressed in SP cells Up-regulated Gene
+3

参照

関連したドキュメント

We observed that gemcitabine induced senescence phenotypes characterized by enhanced senescence-associated β-galactosidase (SA β-Gal) staining and increased expression

PD-L1 expression was upregulated in macrophages and dendritic cells (DCs) in high-grade invasive human OSCC tissues or co-cultured with mesenchymal-phenotype OSCC cells in

reported that gemcitabine-mediated apoptosis is caspase- dependent in pancreatic cancers; Jones et al [14] showed that gemcitabine-induced apoptosis is achieved through the

Gemcitabine induced CXCL8 mRNA expression (data not shown) and CXCL8 protein expression in pancreatic cancer cells in xenografted tumor tissues (Figure 4A).. We

NELL1 (a) and NELL2 (b) mRNA expression levels in renal cell carcinoma cell lines OS-RC-2, VMRC-RCW, and TUHR14TKB and control HEK293T cells were analyzed using quantitative

Consistent with this, the knockdown of ASC expression by RNA interference in human monocytic/macrophagic cell lines results in reduced NF-κB activation as well as diminished IL-8

induced CXCL8 mRNA expression (data not shown) and CXCL8 protein expression in pancreatic cancer cells in xenografted tumor tissues (Fig.. We next administered anti-CXCL8 antibody

Accordingly, our results showed that kahweol acetate and cafestol inhibited the proliferation and migration of both ACHN and Caki-1 cells, with their synergistic effects apparent