CHUGOKUGAKUENJ.2006
Vol. 5, pp. 13-16
Copyright© 2006 by Chugokugakuen
Original Artide
CHUGOKUGAKUJEN
Jowmlalll
http://www.cjc.ac.jp/
Quantitative Determination of Ascorbic Acid in Vegetables by High-Performance Liquid Chromatography
Yoshihiro Shimada * and Sanae Ko
Department of Human Nutrition, Faculty of Contemporary Life Science, Chugokugakuen University, Okayama 701-0197, Japan
A simple high-performance liquid chromatographic procedure was to determine levels of ascorbic acid and dehydroascorbic acid in vegetables that composed of reduction of dehydroascorbic acid to ascorbic acid by DL-homocysteine and the use of tetra-n-butylammonium bromide as an ion-pairing regent in the mobile phase. This method was used to determine the ascorbic acid, dehydroascorbic acid and total ascorbic acid content in 15 fresh vegetables. Sweet peppers and broccoli contained more than 80 mg/l00g of TAA, while Chinese chives, tomatoes, Japanese radishes and carrots con- tained less than 20 mg/l00g of T AA of edible portion. Many vegetables contained an inside level from 33 to 58mg/l00g. There is a difference in the content ratio of AA and DRAA according to veg- etables.
Key Words:
ascorbic acid, dehydroascorbic acid, vegetables, high-performance liquid chromatographyIntroduction
Ascorbic acid (AA) and dehydroascorbic acid (DHAA) are equally biologically active forms of vitamin C in humans and guinea pigs (lJ. Therefore, AA and DHAA levels should be determined to know the total amount of vitamin C in vegetables.
Until recently AA had been determined by the dye- titration method using 2, 6-dichlorophenolindophenol.
Total ascorbic acid (TAA) comprising the sum of AA and DHAA was determined by the colorimetric method, using 2, 6-dichlorophenolindophenol by oxidizing AA to DHAA and using 2, 4-dinitrophenylhydrazine (DNPH) by subsequent formation osazone (2J. However, these methods are time-consuming and may overestimate AA and DHAA owing to the presence of oxidizable
·Corresponding author.
Yoshihiro Shimada, PhD.
Department of Human Nutrition, Faculty of Contemporary Life Science, Chugokugakuen University, 83,Niwase, Okayama701-0197,Japan Tel&FAX; +1 86-293-0247
compounds other than vitamin C in samples. In addition, it is difficult to visually determine the titration endpoint.
Recently, several high-performance liquid chromatographic (HPLC) methods have been developed for analysis of AA and DHAA. These methods adopt various column materials, mobile phases and ultraviolet (UV) or electrochemical detectors (3-6J. AA was well separated from other compounds in orange juice by use of an ion-pairing reagent in the mobile phase (7, 8J. Determination of TAA by HPLC requires a rapid method of converting that is necessary for detection of DHAA. Hughes (9J described a rapid and complete reduction of DAA to AA by DL-homocysteine.
In this study we report a relatively simple HPLC procedure composed of reduction of DHAA to AA by DL-homocysteine and use tetra-n-butylammonium bromide as an ion-pairing reagent in the mobile phase. This method was used to determine AA, DHAA and TAA contents in 15 fresh vegetables of which the ratio of AA and DHAA were analyzed.
14 Shimadaet al. CHUGOKUGAKUENJ. Vol. 5
Results and Discussion
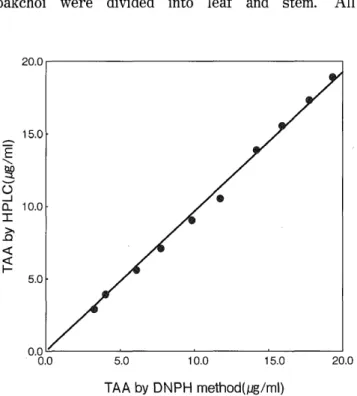
A comparison was made of the concentrations of T AA found in various vegetables by DNPH method and those by our HPLC method (Fig. 1). The relationship between the values obtained by the two methods was described by a regression line y
=
0.9997x - 0.3657, r=
0.998 (p< 0.001), where x represents the values obtained by DNPH method and y represents those obtained by our HPLC method.Determination of TAA by HPLC requires a rapid conversion of DHAA to AA, since DHAA does not absorb UV rays which are necessary for detection.
Hughes (9) described a simple and convenient procedure for the reduction of DHAA to AA with DL-homocysteine. This reduction of DHAA to AA has been applied to the analysis of TAA by HPLC [10, 11J. In the present assay, use of this reducing reagent also produced excellent agreement between the colorimetric method using DNPH and our HPLC method as shown by correlation coefficient (r
=
0.998).The retention time of AA was delayed by the increase in the amount of tetra-n-butylammonium bromide as an ion-pairing reagent in the mobile phase. The use of tetra-n-butylammonium bromide in the conditions of this study gave complete separation vegetables were then chopped into small sections with a kitchen knife.
Ten g of these small sections were homogenized with 10ml of 10% metaphosphoric acid and sea sand in a mortar. The slurry obtained was transferred to a centrifuge tube with 20ml of 5 % metaphosphoric acid and centrifuged for 20min at 3000rpm. The supernatant was diluted 20 fold with distilled water.
5. AA assay
Ten ml of diluted supernatant was diluted with 0.13 ml of 2.5 M K2HP04to give a final pH of 7.0. A 20- pI aliquot of this solution was injected into the HPLC system.
6. TAA assay
T AA was assayed by adding 0.015g of homocysteine to 5ml of neutralized sample for AA assay. After 30 min at 25°C, 20- pI aliquot of this solution was injected into the HPLC system. The concentration of DHAA was calculated by subtracting the amount of AA from that of T AA.
20.0 15.0
10.0 5.0
TAA by DNPHmethod(llg/ml) 5.0
E
...()~
...J ll. 10.0 I
S
<t:
~
15.0
2 0 . 0 , - - - ,
Materials and Methods
Fig. 1 Correlation between quantities of TAA (total ascorbic acid) estimated by DNPH method and by HPLC.
1. Reagents
L (+) -ascorbic acid, tetra-n-butylammonium bromide and other chemicals were obtained from the Wako Pure Chemical Ind., Ltd., Osaka Japan.
DL-homocysteine was obtained from Sigma- Aldrich Inc., St. Louis, USA. All the reagents used were of reagent grade.
2. Samples
Fresh vegetables were obtained from local supermarkets, and analyzed on the day of purchase.
3. High-perfonnance liquid chromatography Separation of AA was achieved with a Yanaco Ir5000 Liquid chromatographic apparatus equipped with a Rheodyne Model 7125 injector. Column effluents were monitored at 265nm with a Yanaco M-515 variable-wavelength detector. Peak areas were determined using an SIC Chromatocorder 12.
A Shodex RSpak DE-613 column (150mm X 6mm inside diameter) was used. The mobile phase was composed of 8mM phosphate buffer, pH 6.8, containing 3mM tetra-n-butylammonium bromide. The flow rate was 1.0ml/min.
4. Preparation of sample
Samples of tahtsai, spinach, chingentsai and pakchoi were divided into leaf and stem. All
2006 Quantitative Determination of Ascorbic Acid in Vegetables 15 Table 1 Contents of ascorbic acid, dehydroascorbic acid and
total ascorbic acid in fresh vegetables
Table 3 The content ratios of ascorbic acid and dehydroascor- bic acid
AA: ascorbic acid, OHAA: dehydroascorbic acid, TAA: total ascorbic acid
AA: ascorbic acid, DHAA: dehydroascorbic acid, TAA: total ascorbic acid
Tabl 4 The content ratios of ascorbic acid and dehydroascorbic acid in leaf and stem for spinach, chingentsuai, tahtsuai and pakuchoi
Spinach Chingentsuai Tahtsuai Pakuchoi Sweet pepper
Brocoli Tahtsuai Pumpkin Pakuchoi
Malabar nightshade Garlic
Cabbage Spinach Asparagus bean Chingentsuai Chinese chive Tomato Japanese radish C,arrot
77.2 22.8 100.0 72.2 27.8 100.0 78.0 22.0 100.0 100.0 100.0 100.0 100.0 100.0 100.0 100.0 100.0 100.0 100:0 100.0 100.0 100.0 100.0 100.0 TAA(%)
76.5 23.5 100.0 80.5 19.5 100.0 81.7 18.3 100.0 8.1 10.1 19.5 34.0 22.8 16.0 16.3 9.5 6.5 26.3 17.5 32.3 12.7 5.4 45.2 OHAA (%)
84.2 15.8 100.0 82.5 17.5 100.0 80.6 19.4 100.0 91.9 89.9 80.5 66.0 77.2 84.0 83.7 90.5 93.5 73.7 82.5 67.7 87.3 94.6 54.8 AA(%)
93.5 6.5 100.0 85.0 15.0 100.0 57.1 42.9 100.0 Leaf
AA(%) OHAA (%) TAA(%) Stem
AA(%) OHAA (%) TAA(%) Edible portion AA(%) OHAA (%) TAA(%) Edible portion (mg/100g)
AA OHAA TAA
Sweet pepper 78.54 ± 19.64 6.94 ± 1.18 85.48 ± 17.95 Brocoli 73.85 ± 15.51 8.26 ±2.64 82.11 ± 18.06 Tahtsuai 46.83 ± 10.41 11.37 ±5.64 58.20 ± 13.05 Pumpkin 36.92 ± 5.54 18.99 ± 5.32 55.91 ± 10.06 Pakuchoi 40.82 ± 16.06 12.05 ± 8.52 52.86 ±23.37 Malabar nightshade 43.58 ± 30.95 8.31 ± 2.79 51.89 ± 33.13 Garlic 39.65 ± 11.90 7.74 ± 2.01 47.38 ± 14.69 Cabbage 34.29 ± 5.83 3.60 ± 0.97 37.89 ± 7.20 Spinach 32.97 ± 8.24 2.29 ± 0.64 35.25 ± 8.81 Asparagus bean 24.57 ± 2.65 8.76 ± 4.39 33.33 ± 6.56 Chingentsuai 27.28 ± 6.17 5.80 ± 1.36 33.07 ± 6.16 Chinese chive 12.35 ± 2.58 5.90 ± 0.87 18.24 ± 1.71 Tomato 14.68 ± 4.99 2.13 ± 0.51 16.81 ± 5.38 Japanese radish 12.31 ± 2.83 0.70 ± 0.11 13.01 ± 2.99 Carrot 4.04 ± 0.89 3.34 ± 0.50 7.38 ± 1.77
Spinach Chingentsuai Tahtsuai Pakuchoi
Leaf
AA (mg/100g) 47.66 ±10.49 63.47 ±22.17 88.41 ±15.83 65.00 ±26.67 DHAA(mg/100g) 8.40 ± 5.96 15.27 ± 3.16 19.93 ± 4.50 18.29 ± 11.06 TAA (mg/100g) 56.06 ±12.89 78.74 ±23.66 108.21 ±18.83 83.28 ±36.56 Stem
AA (mg/100g) 4.96 ± 0.89 19.14 ± 3.02 28.65 ± 6.71 21.00 ± 8.15 DHAA(mg/100g) 3.72 ± 0.89 3.6 ± 0.89 8.79 ± 2.34 8.08 ± 5.79 TAA (mg/100g) 8.68 ± 1.48 22.74 ± 2.42 37.44 ± 8.5 29.08 ±13.02 Edible portion
AA (mg/100g) 32.97 ± 8.24 27.28 ± 6.17 46.83 ±10.41 40.82 ±16.06 DHAA(mg/100g) 2.29 ± 0.64 5.80 ± 1.36 11.37 ± 5.64 12.05 ± 8.52 TAA (mg/100g 35.25 ± 8.81 33.07 ± 6.16 58.20 ±13.05 52.86 ±23.37 AA: ascorbic acid, DHAA: dehydroascorbic acid, TAA: total ascorbic acid Values are the mean±SD.
AA: ascorbic acid, OHAA: dehydroascorbic acid, TAA: total ascorbic acid
Values are the mean ± SO.
Table 2 Vitamin C contents of leaf, stem and edible portion of spinach, chingentsuai, tahtsuai and pakuchoi
of AA peak in the chromatograph, and the separation was not interfered with by the peak of DL-homocysteine added to the sample.
Results of the analysis of 15 fresh vegetables available in local supermarkets are shown in Table 1.
It indicates that sweet pepper and broccoli contained more than 80mg of T AA per 100g of edible portion, while Chinese chives, tomatoes, Japanese radishes and carrots contained less than 20mg of TAA per
100g of edible portion. Many vegetables contained an inside level from 33 to 58mg/l00g. Vitamin C levels in vegetables are known to vary considerably according to species, variety and growing conditions.
Vitamin C contents of leaf, stem and edible portion were shown for spinach, chingentsuai, tahtsuai and pakuchoi in Table 2. More vitamin C is included in leaf than in stem in all of these vegetables. The content ratios of AA. and DHAA of
16 Shimada et al. CHUGOKUGAKUENJ. Vol. 5
15 fresh vegetables are shown in Table 3. It was proven that high content rations of AA were found in sweet peppers, broccoli, cabbages, spinach and Japanese radishes, while low content rations of AA were found in pumpkins, Chinese chives and carrots.
The content ratios of AA and DHAA in the leaf and stem of spinach, chingentsuai, tahtsuai and pakuchoi are shown in Table 4. The higher content ratio of DHAA was observed in the stem portion.
These data indicate that there is a difference in the content ratio of AA and DHAA according to vegetables. This is related to the ascorbic acid oxidase. In vegetables cooked without heating, AA was oxidized rapidly to DHAA by ascorbic acid oxidase, however, no significant change occurred in T AA content during the process of cooking, as DHAA showed the same physiological efficiency as AA.
References
1. Sabry JM, Fisher KH and Dodds ML: Human utilization of dehy- droascorbic acid. J. Nutr (1956) 64, 457-466.
2. Roe JH, Mills MB, Oesterling MJ and Damron CM: The determi- nation of diketo-I-gulonic acid, dehydro-I-ascorbic acid, and I-ascorbic acid in the same tissue extract by the 2, 4-dinitrophenyl- hydrazine method. J. BioI. Chem. (1948) 174, 201-208.
3. Wimalasiri P and Wills RBH: Simultaneous analysis of ascorbic acid and dehydroascorbic acid in fruit and vegetables by high-per-
formance liquid chromatography. J. Chromatogr. (1983) 256, 368-371.
4. Augustin J, Beck C and Marousek GI: Quantitative determination of ascorbic acid in potatoes and potato products by high perfor- mance liquid chromatography. J. Food Sci. (1981) 46, 312-316.
5. Pachla LA and Kissinger PT: Determination of ascorbic acid in foodstuffs, pharmaceuticals, and body fluids by liquid chromatog- raphy with electrochemical detection. Anal. Chem. (1976) 48, 364-367.
6. Rose RC and Nahrwold DL : Quantitative analysis of ascorbic acid and dehydroascobic acid by high-performance liquid chromatogra- phy. Anal. Biochem. (1981) 114, 140-145.
7. Sood SP, Sartori LE, Wittmer DP and Haney WG: High-pressure liquid chromatographic determination of ascorbic acid in selected foods and multivitamin products. Anal. Chem. (1976) 48, 796-798.
8. Keating RW and Haddad PR : Simultaneous determination of ascorbic acid and dehydroascorbic acid by reversed-phase ion-pair high-performance liquid chromatography with pre-column derivatisation. J. Chromatogr (1982) 245, 249-255.
9. Hughes RE: The use of homocysteine in the estimation of dehy- droascorbic acid. Biochem. J. (1956) 64, 203-208.
10. Dennison DB, Brawley TG and Hunter GLK: Rapid high-perfor- mance liquid chromatographic determination of ascorbic acid and combined ascorbic acid, dehydroascorbic acid in beverages. J.
Agric. Food Chem. (1981) 29, 927-929.
11. Behrens WA and Mad re R : A highly sensitive high-performance liquid chromatography method for the estimation of ascorbic and dehydroascorbic acid in tissues, biological fluids, and foods.
Anal. Biochem. (1987) 165, 102-107.
Accepted March 31, 2006.