A Study on the Glassfiber Reinforcement Effect of F. R. P. E and on the Behavior of it's
welded part
journal or
publication title
福井大学工学部研究報告
volume 22
number 1
page range 85‑95
year 1974‑03
URL http://hdl.handle.net/10098/4647
MEMOIRS OF THE F ACVLTY OF ENGINEERING FUK VI UNIVERSITY
VOL. 22 No.1 1974
A Study on the Glassfiber Reinforcement Effect of F. R. P. E and on the Behavior of it's welded part
85
Hiroshi KIMURA·, Takuzi YAMAGUCHI., Masakazu TSUBOKAWA*, Haruo SHIBANO*
(Received Aug. 22, 1973)
In this paper we describe an experimental study on glassfiber reinforcement effect in plastic composite material of F. R. P. E and on ultrasonic weldability of F. R. P. E by batch method.
Judging generally the results of experiment, relationship of lap length of glassfiber and tensile strength can be given in straight line, and so is relationship of glasscontent and tensile strength so long as glasscontent is less than 30%. Relationship of clearance and tensile strength on the other hand something like what is expressed by a curve of second degree, and clearance is desired to be as small as possible. No fiber reinforcement effect is expected unless lap length and clearance of glassfiber are within effective range.
Failure in the course of tension occurs first at the tip of fiber and propagates to the side of tip. Transmission of stress by the effect of glassfiber reinforcement can be observed in photo-elastic phenomenon.
In order to judge whether the welding is good or not, ratio of weld thickness serves as an effectual critertion.
Welding joint efficiency of F. R. P. E was approximately 80%.
Introduction
TakiIig FRPE as an example of reinforcement of engineering plastics, this article seeks for an effect of glass fiber reinforcement in the construction of glass fiber reinforcement material, or, in other words, in the relationship between basic dispersion and arrangement of glass fiber against matrix. Furthermore, ultrasonic welding of FRPE 1 )""'3): by batch method has b~en experimented, and behavior of weld under load is sought for. Basic assumption is that fibers acting as reinforcement material carry the load, while matrix works to transmit the stress from one fiber to another. When the fibers are dispersed uniformly in matrix and basic uni-directional composite material is subjected to tension in the direction of fibers, law of mixt~re holds true on the assumption that fibers and matrix do not slip each other but receive the same strain.4)
a c = af Vf + am Vm = af Vf + am (1 - Vf ) ... (1)
*
Dep. of Textile Eng.86
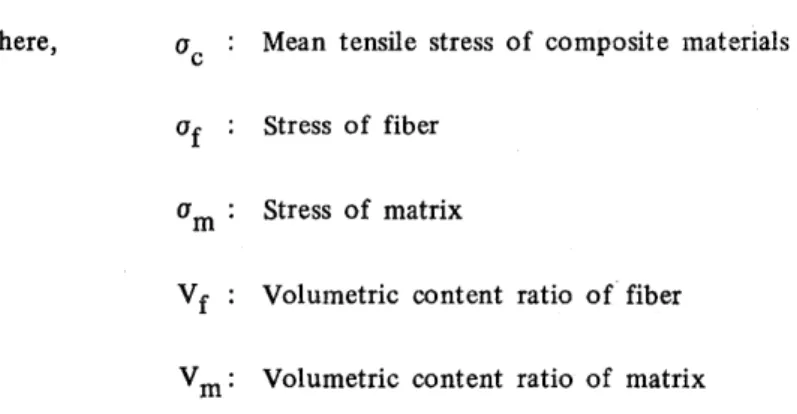
Where, Mean tensile stress of composite materials
Of Stress of fiber
am: Stress of matrix
V f Volumetric content ratio of fiber
V m: Volumetric content ratio of matrix
Tensile' stress-strain curve of composite material consisting of brittle-fracturing reinforcement such as glass fiber or boron fiber and ductite-fracturing matrix such as polyethylene, polyester or epoxy resin, is generally as shown in Fig. 1. When fiber (f) and matrix (m) are within elastic
o'fu
o
Fig. 1
~l n __
I
I
I
£my Emu
Stress-strain curve for composite material (T. Hayashi, etc.)
region ~
D,
law of mixture with respect to elastic modulus is gillen in:Ec == Ef. Vf + EmVm (0 ~ e ~ e my)
(2)
When fiber and matrix are in the region (n) after yielding point, law of mixture with respect to elastic modulus is given in:
In this region
II,
same stress is transmitted to matrix as transmitted to fiber. But, since the fiber has extremely high modulus compared with matrix, elongation of matrix is much greater than that of fiber under the same tensile force. In consequence, difference in elongation of fiber and of matrix and shearing strain are considered to be accumulated and become greater and greater toward the ends of fibers. This condition is ascertained in the form of stress distribution by means of photo-elastic experiment based upon photo-elasti9 effect of matrix. s )"'6) Furthermore, the relationship among fiber length, clearance between fibers, lap length of fiber, and reinforcement effect of glass fiber is sought for by mechanical test, as well as in correlation with photo-elastic experiment. Behavior of weld of FRPE is examined on the other hand by mechanical test and photo-elastic experiment.2 Experimental Method
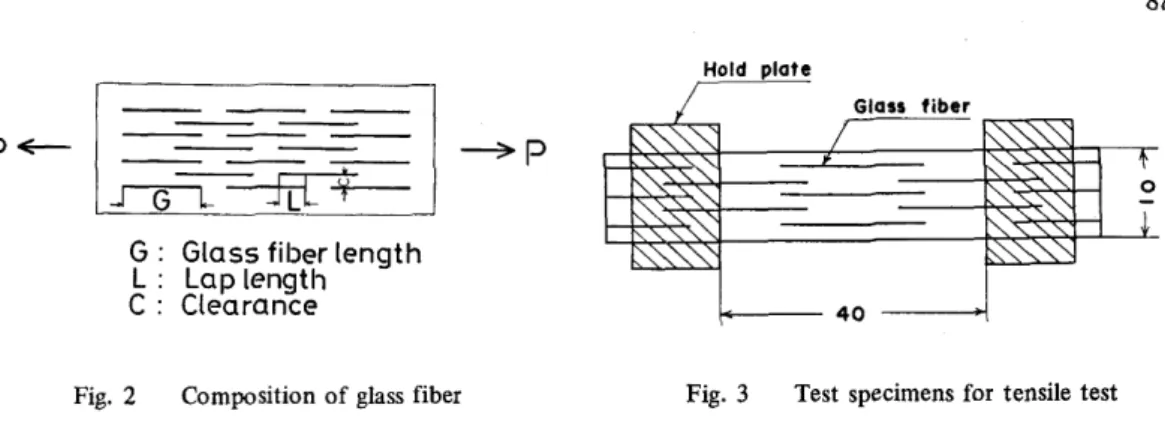
Fig. 2 shows basic fiber arrangement by means of batch method for the purpose of examining reinforcement effect, of glass fIber.
p-I~I~p
G: Glass fiber length L: Lap length C : Clearance
Fig. 2 Composition of glass fiber
Hold plate
~--- 40
Fig. 3 Test specimens for tensile test
From this, test pieces as shown in Fig. 3 were prepared for tension test and photo-elastic experiment. Tension test was carried out with ~niversal testing machine with electronic tube, Autograph IM-I 00, and tensile stress-strain and, change in shape until failure have been observed.
On the other hand, Autograph IS-2000 was combined with photo-elastic experiment device for photo-elastic experiment, with which interference fringe of double-refracted light under different loads has been photographed and dynamic distribution of internal strain has been obtained.
Material used for the experiment was polyethylene of low density and E-glass formed into FRPE by hot press. Welding was carried out by ultrasonic welding method using Sonopet 1000 B.
3 Experimental Results and Consideration
. Fig. 4 shows relationship between lap length (L) and tensile strength (Ts) under the condition of glass fiber length being 30mm and clearance being fixed at 2mm. As a result, it has become clear that the relationship can be given in straight line expressed by:
o
Ts
=
j L + 1.3•
),...,- 8"""'"
v'
:..-.--
... .---
.
...----v·
7~ •
r---- Length of gloss fiber : 30mm
CleuronCC' : 2rnrn
o
l
2Fig. 4
P\ut<2 thic~~ss .. Q.1"hr.ffi
I I I I
4 6 8 10 12
Lap length (rrm)
Rdation between tensile strength and lap length
14
Fig. 5
10 20 30
Glass eontent (wt.%)
Relation between tensile strength and glass content
88
On the other hand, it was found that, with FRPE in which glass fibers are dispersed, the relationship between Ts and glass fiber content (Gc) can also be given in straight line, as shown in Fig. 5, until Gc reaches approximately 30% in weight. With this experiment, Ts was known to be 1.3 when L
=
O. This is the strength of matrix itself, and, despite glass fiber content of 20% in weight, no effect of reinforcement has been observed. On the contrary, Ts was 6.5 when L=
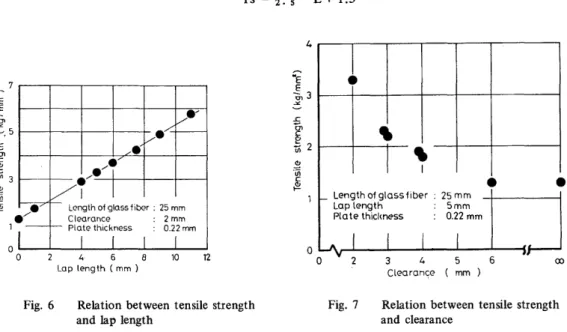
14, and showed slightly bigger value than glass fiber content of 30% in weight. From Figs. 4 and 5, similarity has been found in reinforcement effect by L and by Gc. Fig. 6 shows relatiqn- ship between Land Ts when glass fiber was 25mm long and clearance was fixed at 2mm, and it has become evident that Ts can be given in straight line expressed by:"E E 7
o
Ts
= -&-
L + 1.3....
~ ... -/
/ '
•
...
... /1
~
Vr
t--I
Length of glass fiber: 25 mm
./ l -
f--- Clearance Plale thickness : 0.22 mm : 2 mmj 1 l I
o 4 6 8 10 12
Lap length ( mm )
Fig. 6 Relation between tensile strength and lap length
4
o
1 ..
I ..
I• •
r- Lengthofglassfiber: 25mm
Lap length : 5 mm
o
Pta te thiclmess : 0.22 mm
.A
I
v 2
Fig. 7
I I I
"
3 4 5 6
Clearane<? mm
Relation between tensile strength and clearance
Reviewing the above, Ts seems to become slightly bigger as fiber length becomes shorter when Land C are kept same. This, however, is an apparent Ts, and Gc becomes bigger in reality as fiber length becomes shorter, even though Land C are kept same, and this might be the reason why L has got different coefficients. Relationship of C and Ts with glass fiber length being 25mm and L being fixed at 5mm is shown in Fig. 7. Ts shows rapid drop as C increases.
When C reaches 6mm (about 10% in weight), no reinforcement effect is observed and Ts drops to that of matrix itself. It has become apparent from this that the smaller C would be, the better.
(a) - (f) of Photo. I show behavior of failure being pursued during the course of tension test done on the test piece of glass fiber length
=
30mm, L=
14mm and C=
2mm. Stress increased as the time passed, and showed the maximum value just before glass fiber broke away from matrix (in the neighborhood of (b) in Phofo. I). Breaking-away took place first at the tip of fiber, then propagated to the side of the tip, causing shearing failure between matrix and fiber.Tensile stress, therefore, does not drop rapidly. Maximum stress at this moment was 6.3kg/mm2 •
Photo. 2 show behavior of failure being pursued during the course of tension test done on the specimen containing in itself two formation of L = Omm and. L = 2mm, with glass fiber length
=
30mm and C=
2mm. Photo. 2 (b) is under the maximum stress, 1.5kg/mm2, inwhichPhoto. 1
(a) ( b) (e)
Cd) (e) (f)
Behavior of failure being pursued during the course of tension test done on the test piece of glassfiber length=30mm, L=14mm and C=2mm
89
90
Photo. 2
(0) (b) (c)
(d) (e) (f)
Behavior of failure being pursued during the course of tension test done on the test piece containing in itself two formation of L=Omm and L=2mm, with glassfiber iength=30mm and C=2mm
91 plastic flow of matrix is clearly observed in the neighborhood of the fiber tip in outside part.
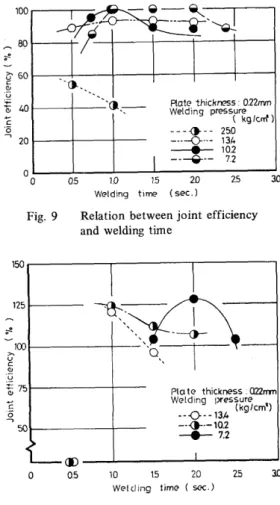
Photo. 2 (c) shows that failure has occured at the tip area of fiber, and matrix is apparently no more in the condition that the stress can be transmitted from one fiber to another. Ultrasonic- welded test piece is shown in Fig. 8, and welding was carried out at the place whose width was 3mm. Fig. 9 shows relationship between welding condition and welding joint efficiency, from which it is known that joint efficiency of more than 90% has been accomplished within the range of 7.2-13.4kg!cm2 in welding compression force and 0.7-2.0 seconds in welding time.
Fig. 10 shows relationship between ratio of weld thickness to base material thickness and welding joint efficiency, with both PE and FRPE. Within the range of 100-170% in the ratio of weld thickness, welding efficiency of 100% and 120% was achieved with PE and FRPE respectively.
R, has become evident from this relationship that the ratio of weld thickness to base material thickness can be used as an effectual critertion to judge whether or not the welding is good.
Results of welding done on FRPE of L
=
3mm and C=
2mm are shown in Fig. 11, from which it is known that, although the range of appropriate time of welding became narrower, jointHold plate
Weld zone
3 3
~--- 40
Fig. 8 Tensile test specimen
140 120
J • •
~ 100
,,-e-r-"- •
,,~~"
~-Plelte thickness O.22mm
~
.. .:
: Po(yety(ene LCIP length 3mm 4 o i--- "CI~Clrance 5mm
} I
0 I I
o 40 120 160 200
Thickness ratio of weld zone to Ix-lse mCL terial (0;.)
Fig. 10 Relation between joint efficiency and thickness ratio of weld zone to base material
100
--~-- --.'~ I
~ 80
r-
'ct-,
,
Plate thickness: 022rrm '(l,-, - Welding pressure C; 40
:g c 20
o o 0.5
Fig. 9
( kg/crrt) ---{)--- 25.0
---0 .. - 131.
----..-
102I
----Y-- 1.21.0 1.5 2.0 25
Welding time (sec.)
Relation between joint efficiency and welding time
30
1 5 0 . - - - , - - - , - - - ,
1 2 5 1 - - - - -
", ---{)-
~:,~
~100 ... - - - t - - "0" \
~Q
~75~---+--- Plo te? thickness. Q22rrm Welding pressure?
(kg/em') --0--13.4 50 ... - - - \ - - - - ---<)---10,2 ----.- 7.2
( 1 ) _ - - . 1 . _ - - _ - - - 1 - _ - - _ ...
o 0.5 10 15 20 25
We((ling time ( soc,)
Fig. 11 Relation between joint efficiency and welding time
3D
92
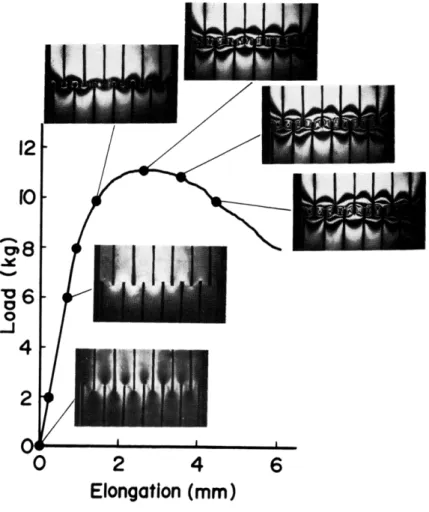
efficiency of more than 100% has been accomplished within the range of 7.2-13.4kg/cm2 in welding compression force. Once being put in stress or strain condition, all of amorphous isotropies take on double refractive property temporarily, remain no more as isotropic bodies, and give the same optical phenomena as crystaline body does. Based upon these interesting characteristics, behavior of stress transmission from one fiber to another of FRPE has been looked for using polarized light. Figs. 12-14 show relationship between load-elogation diagram
o 2 4 6
Elongation (mm)
Fig. 12 Mechanism of glassfiber reinforcement depend on photo-elasticity experiment Glassfiber length ............. 30mm
Glassfiber clearance ................ 4mm Glassfiber lap length ......... 2mm Tension speed ............ 1.5mm/min
93
strength, stress concentration appears at the tip of fiber, then the stress distribution moves gradually t~~ard the side of the tip, and load is transmitted to adjacent fiber. Stress reaches its maximum point when the load is further increased, and shearing failure occurs, immediately after that, in the neighborhood of fiber tip. As for the weld, stress concentration appears at
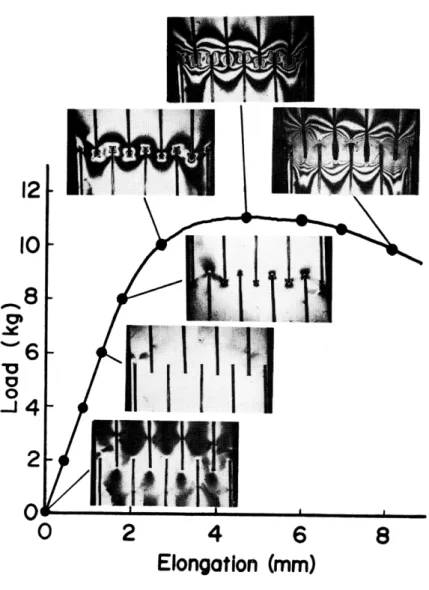
12 10
",8
~ 0'
~6
"0
c
0-.J4 2
0 0 2 4 6 8
Elongation (mm)
Fig. 13 Mechanism of glassfiber reinforcement depend on photo-elasticity experiment Glassfiber length ............ 30mm
Glassfiber clearance ........ 6mm Glassfiber lap length ..... 4mm Tension speed ................... 1.5mm/mm
94
of FRPE and its weld and photo-elastic phenomenon which shows effect of glass fiber reinforce- ment in stress condition. FRPE in Fig. 12 was of C
=
4 and L=
2mm, that in Fig. 13 was of C = 6 and L = 4mm, while FRPE in Fig. 14 was of C = 6 and L = 3mm at weld, and fiber length in all of these cases was 30mm. When the stress reaches about 73% of the maximum10
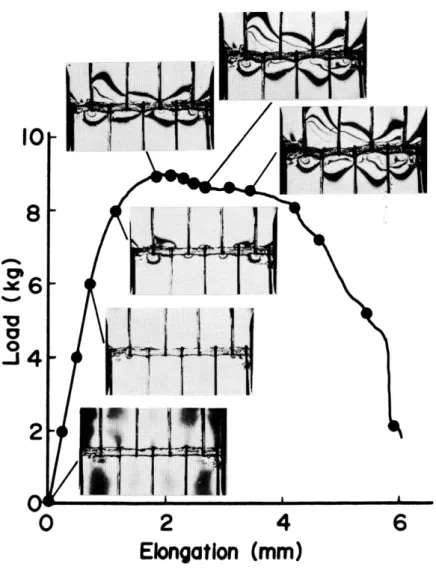
o 2 4 6
Elongation (mm)
Fig. 14 Mechanism of glassfiber reinforcement in the weld part depend on photo-elasticity experiment
Glassfiber length ...... 30mm Glassfiber clearance ...... 6mm Glassfiber lap length ... 3mm Tension speed ...... ....... 1.5mm/min
the tip of fiber at about 90% of the maximum stress. Stress is then propagated to adjacent fiber until it comes to its maximum point, and failure occurs at the boundary of matrix on both sides. Weld is rather reinforced by deposit of welding.
4 . Conclusion
The following summary can be made from the results of the present experiments.
Relationship of Land Ts can be given in straight line, and so is relationship of Gc and Ts so long as Gc is less than 30%. Relationship of C and Ts is on the other hand something like what is expressed by a curve of second degree, and C is desired to be as small as possible. No fiber reinforcement effect is expected unless Land C are within effective range. Failure in the course of tension occurs first at the tip of fiber and propagates to the side of tip. Transmission of stress by the effect of fiber reinforcement can be observed in photo-elastic phenomenon. In order to judge whether the welding is good or not, ratio of weld thickness serves as an effectual criterion. Welding joint efficiency of FRPE was approximately 80%.
Acknowledgments
This work was partly supported under the contact for the Textile Industrial Research Institute and No. 785020 for the Scientific Research at 1972, Japanese Educational Ad- ministration.
Part of this work was present at the Annual Meeting of the Japan Welding Society, Matsuyarna City, October 1973.
Referenoes
1) H. KIMURA: A Study on the Weldability of F. R. P. E (I), Journal of the Japan.
Welding Society, Vol. 42, No.1, P. 40 (1973)
2) H. KIMURA: A Study on the Weldability of F. R. P. E (n), Journal of the Japan Welding Society, Vol. 42; No.2, P. 114 (1973)
3) H. KIMURA: A Study on the Weldability of F. R. P. E ( ill ), Journal of the Japan Welding Society, Vol. 42, No.3, P. 202 (1973)
4) T. HAYASHI: Composite material technology, P. 51 (1971) 5) K. YUASA: Theories of material dynamics, P. 284 (1960) 6) Society for the study of stress measuring technology:
Stress measuring method, P. 472 (1958)