【
報制
.
UDC :624
.
012.
45 539.
3 620.
1日本 建 築 学 会構 造 系 論 文 艱 告 集
、
第419
号・
1991 年1
月 ∫ournat ofStruct
.
C6nstr
.
Engng
,
AIJ
,
No
.
419
,
Jan
.
,
1991
DAMAGE
BE
耳
AvIoR
.
oF
R
耳
INFoRCED
CoNcRETE
、
・
.
COLUMNS
UNDER
UN
.
IAXIAL
AND
BIAXI
・
AL
・
,
.
,
.
.
.
LATERAL
.
LOADING
、
1
.
’
.
r
軸
お
よ び
二軸横 力荷重
を
受
け る
鉄 筋
コ ン’
ク
リ
ー
ト
柱
の
損傷
挙
動
JunJ
’
i
O
(
}
A
iVA
*,Yoshihiro
ABE
* *,Michio
HOSHI
* * *、
and
Ma5ahiro
IKUTA
*嘗
* *、
「 ..
. 一
、.
小 川 淳
二
, 阿 部 良 .
洋 ,
星
.
.
.
道 夫 ,生 .
田 真 大
.
幽
」
Ca
耳
tilever
−
.
!
ype
rei ロforced
goncrete
qolumn
speqin }eqFare
usedfor
.
uniaxial andbiaxial
staticlateral
loading
tests
.
Specimens
are approximatelyfull
scale models consideredto
be
representa一
巨vebf
th6
fitst
st6ryinterior
columnsin
typicahhree
ゼ
ofive
storiedbuildings
in
Japan
.
、
丁上
ebehavior
of crack 畫ng andspa
旦ling
ofthe
re 量nforced.
concrete co.
lumns
specimensunder
,
the
・
action ofbiax
置
al.
loadi
ロg
cDuld、
simulate somewhatthe
earthquakedamage
features
offrame.
type
RC
b
“
ildings
.
obS
,
erved
in
the
pas
しstrong
earthquakes.
The
biaxial
loading
gives
lnore
『eriousd
・mage−
t
・ しb
・b
・nc・et6.
・ 。
1
伽 ・th
・n出・uniaxi ・1
・ne・
..
層 −
. .
.
.
Adcording
to
止 e crack−
spa 旺 oHdamage
index
,
discussed
in
.
this
study ,(1 )
・
If.
the
cracklength
ratio.
is
around10and
the
.
spaU off area ratio.
is
Irom
10
to
30
%,
the
・
maximum
ductility
sho “ld
be
around3
.
,
.
.
(
2
)
b
融
臨
黠 翻
二
1
詰
ln
、認
讒
d
課
s欄
e51a 「sbec
?
m,
el1°啣
lbngi
nal
ba
「sKeywonls
:1
〜C
column,
uninXl’
al
loading
,
binxial
loading
,
eaプtEquake
dOmage,
crec 々lengt
乃 ratio,
、.
.
sPall area ratio
.
..
、
,
t
踟
.
尸
圏
1.
Infrl
)duction
「.
『
The
earthquake
resistant
design
of
reinforced
.
concrete
buildings
is
based
onpermitting
certaindegree・
fd
・血
・g
・t
・ s’
t
・ucty ・al・el
・m
,
e
…,
wh ・・th
・y
・ ・e
・ubjec
・・d
・・.
sev
・・e
ea
・thq
・akr
.
・xcit
・ti
・n
・・
S
。it
becomes
necessary
tolestimate
th
俘
degree
of
structural
damage
in
reinforcedconcrete
structufes
『
6
as
to
evaluate
their
post
earthquak.
e
∵serviceability
、
It
is
established
that
the
damage
features
of
columQs
under
the
uniaxial
loading
aredifferent
from
thgse
under
the
biaxial
loading6
)−
il ).
Features
of
・
bia
冬
ial
loadin9
wereob
も
erved
in
actual earthquakedamage
such
as
the
Hachinoh6
’
City
Libr
’
ary
and
the
Mutsu
Municipal
Hall
in
the
ユg68
Tokachi −Oki
earthquake
.
In
this
paper
,an
experimental
program
,including
・
he
uni ・
li
・1
・ ・d
・h
・bi
・xi ・l
l
煢
te
・al
・1
・adi
・≧
ca
・e
・,
・・inve
・・ig
・t
・ ・h
・d
・皿 ・g
・b
・h
・vig
・ ・f
・ei
・f
・.
・C
・d
concretecolumns
upder
earthquake
loading
is
.
discussed
.
,
The
biaxia1
.
loading
ca
≦e
conside エed
i
町this
experimental
program
includ6s
simultaneous
application
。f
lQ
・d
i
・.
N
$
A
・d
E
Ψ
di
・g6ti
・.
n・・9i
・i
・g.
・i
・.
e ・… eall
・adi
・g
P
・th
・
・uch
・・ci
・cul
…a
与
w ・ll
.
・・
alte
・n
・t
・applicatiob
in
the
mutua
,
11Y−
perpendicular
・
directiops
,
giving
riseto
alternately
cr6ss
loading
path.
H
・w・v・ ・th
・di
・placement.
鋤
pllt
・d
・ ・ a・e
.
:
k
・pt
仁
h6:
.
s
、aM
・.
Th
・uniaxi
・l
and
th
・biaxi
・l
l
・adirig
ca
・9
・di
・9.
…ed
i
・thi
・p
・p
・・a
・e
p
・・b
・bly
.
・t
中
・twg
・・t
・emiti
・・with
the
act
・al
ea
曲
q
・ ・k
・1
・adi
・g
P
・tt
・m
lyipg
somdwherein
between ’
.
.
.
’
「
.
・
宰
Ass6c
:Prof
,
,
Tohoku
Un
.
iv
.
,
Dr
.
’
Eng
.
ゴ
r
¥Assoc
.
Prof
∴
Tohoku
・
1
丘st.
ofTech
.
,
Dr
、
E
皿g
.
・
.
* * *Res
白arch
Assdc
.
,
TohQku
Univ
.
榊 事 *
Hokka
[do
Rai
[wa’
y
.
CQ
.
,
Former
Grd
.
.
Student
ofTohoku
Univ
,
.
東北 大学 助 教授・
工博 東北 工 業 大学層
助 教 授・
工 博 東北 大学 助 手東北 大 学
大 学 院 生
.
(現JR
北 海道)
一
87
一
Various
indices
for
evaluating
the
structuraldamage
in
reinforcedconcrete,
such asdamage
ratio'),flexural
damage
ratio anddissipated
energy2), sloperatio3',
energy
dissipation
index"),
etc.
,have
been
proposed.
However,
all ofthese
indices
require
the
use
of
hysteresis
loops
recorded
duting
earthquakes.
As
buildings
are
notequipped
to
recordload
displacement
time
histories
during
earthquake
loading,
visualinspection
maybe
the
onlypractical
wayof
collecting
data
for
evaluationof
the
structuraldamage.
The-prirnary
data
from
visualinspection
comprisethe
information
on
concretel
cracks
ancl
concrete
spalling5].
In
this
paper,
relationships
between
the
displacement
ductility
andthe
information
on
crack
length
and
spall
off
area
are
exarnined
onthe
basis
oftest
results,A.method
of estimatingthe
maximum
displacement
experiencedby
reinforced
concrete
column
from
the
visual
damage
data,
based
on
the
quantitative
relationshipbetween
them,
is
proposed,
2.
Test
Specimen
and
testing
procedure
Separate
testing
programs
for
the
uniaxial andthe
biaxial
lateral
loading
cases
have
been
undertaken.
Cantileyer-type
column specimens,used
in
this
testing
programs,
are
shown
in
Figs.
1
(LC-Type,
uniaxial) and
3
(BC-Type,
biaxial).
Specimens
are
appproximately
full
scale
models,consiclered
to
be
representative
of
the
first
storyinterior
columns
in
typical
three
to
five
storied
buildings
in
Japan.
Table
1
shows
the
loading
paths,
the
loading
displacement
ductility
steps,
strengths
of
reinfoicement
and
concrete,
and
the
axialload
for
eachtest
specimen.
The
general
setup
for
the
uniaxial
and
biaxial
loading
'tests
are
shown
in
Figs.
2
and
4,
respectively,The
lateTal
load
is
appllecl
at
a
height
of
1
100
mmfrom
the
upper
surface
of
the
footing
block
for
both
the
uniaxialand
the
bihxial
loacling
cases.Therefore,
the
shear span ratie ofthis
columnspecimen
is
2.2.
The
calculated
ultimate
flexural
and
shear
strengths
ofthe
specimens efBC-3
seriesare
about
40.6t
and
41.9t
respectively.
The
columnlength
ofthe
biaxial
loading
test
specimen
is
made
shorter
than
that
of
the
uniaxial
one,
because
the
specimen
for
biaxial
loading
needsto
be
attached atthe
free
end ofthe
column with a specialjig
(height
490
mm),
inducing
the
axial
and
lateral
loacls
at
the
column
top.
There
is
alevel
difference
of
140
mm
between
the
NS
ancl
EW
loading
axes,
because
the
NS
andEW
loading
jacks
in
the
mutuallyperpendicular
directions
haye
to
fit
in
the
same shaftof
the
Load
inducing
jig,
Therefore,
the
loading
height
of
1100
mm
is
measured
from
the
top
of
the
'footing
block
to
the
center
of
the
two
mutually
perpendicular
]oading
axes.
The
footing
block
of
the
test
specimens
and
the
reaction steelframes
are
firmly
bolted
and
tightened
to
the
extremelyrigid
testing
floor
(thickness
900
mm)
using
high
strength
sleel
rods,
screw
jacks
(capacity
25
t,
4jacks
for
the
uniaxial
loading
and
12jacks
for
the
biaxial
loading),
andthick
steel
piate
shear
connectors
in
order
to
achieve
fixity
at
the
base,
The
lateral
loading
system
for
the
uniaxial
loading
test
is
made
up
of
two
hydraulic
oil
jacks
(capaciity
og-?>.,g?(S ooHo-oxgl::lillil1.1111 :ii'IIIili
s"il
.o.
.,,,,
g
:D:
ssosoesso
1600
Fig.1
Test
specimenloading
test
4-sgg-L
Longitvdinal
Reinforcement8-D19
(pt-O.34Z)
Transvers
ReinferaementNS
Direction
3-Dlo
eloo
(Pw=O.43Z)
EWPireetton
2-DIO
@100
(pw=O.29Z)
for
uniaxial outem LateralLoeding
React
±enSteel
Frame
AxialForce
LoadingCirder
Oil
Jack
for
Lateral
Testing
Fig.2
Loading
Loadingt)IHe
±gh-LoadCell
Prestressing
SteelLedef32anDtaveter
ooenHTestSpecirnenl
or300o
set-up
for
uniaxial]oading
test
Loading
-88-Table1
Loading
program,
strbngth of reinforcement and concrete, and axial,]oadfor
eachtest
specimen" :
Displacement
tiuctility
Factor
LoadingProgram
'LongitudinalTransver$e
ConcreteSpec.PathSteps
{pt)Barsay!ov(kglcm2)Barsaylau(kglcm2)2eFe(kg/em2)testFe-{kglefu2)
AxialLoad<ton)CRatio)LC-1
O.5-1-2-3-4-5-7-14
18475.9CO.13)
LC-2O.5.1-2-3-5-7-IOx2
2137E.7(O.14)
LC-3
1-2x5=3x5-5xS--7x2
4000582e
NS4-DIOe16o
pw=o.3sg
EW3-DIOQ160
pw=O.271
402057EO22721575.9CO.l3)
LC-4
24974.9CO.13)
LC-S4ts'O.5-1-2r3-5-7--10-148-D19Pt=O.341 24'4130.2CO.23}LC-10
'
1-2-]-5-7-IO-14
26S155.2(O.25)
L
¢-ll
35465467
39235676246273155.8CO.25)
LC-12O.S-l-2-3-S-7-10-14
NS3-DIOelooPw=O.4,]t
EW2-DIOeloopw=o.2gg
2e'o'156.3(O.25)
LC-l3114216145.7{O.'26}
LC-・14
36475621
3g92550722920976.0CO.l3)
BC-l1TTt"-''1-3-S-le
CN.S-E.W)
249lS4.2(O.25.)
BC-2
O.5-1-3.-5-7
37175331
3B45S662251-2eol57.0(O.2S}
BC-3--tt'-iF'O.5-1-3--5-7
(N.S-E.W)
24S.!71.3(O.25)
BC-41v.-LLIO{N.S-E.W)
8-D19pt=o.34g
3-DIOeloo
pw=O.431
249'173.l{O.25}
'BC-5Nfvt'-xxsO.S-1-3-5
CNE.SW-NW.SE)
364755S2
34745150274254171.StO.25)
BC-6'O.S-1--3-5
232171.7(O.25)
50t
in
compression>.
One
of
them
is
used
for
the
positive
direction
loading
(towarcls
North)
andthe
other
for
the
negativedirection
loading
(towards
South).
The
test
specimenis
subjected
to
one cycleload
reversal alongthe
NS
direction
at
each
target
displacement
ductility
step.
The
same
loading
procedure
is
repeated wjthincreasing
target
displacements
untii
the
test
specimen
could
no
longer
support
the
axialload.
The
lateral
loading
system
fer
the
bi'axial
loading
test
is
madeup
of
two
reversiblehydraulic
jacks
(cqpacity
50
t
in
both
compression
and
'tension).
Both
jacks
are attachedto
the
thick
shaft
of
the
load
inducing
jig
with
vertical
and
horizontal
free
]oints
at
both
ends.
The
load
inducing
jig
is
fastened
to
the
free
encl
of
the
,column
with
high
strength
bolts,
The
test
specirne.n
is
subjectedto
one
cycle
load
reversal along
the
NS
and
EW
directions,
alternately
or simultaneously, at eachtarget
displacement
step.The
pump
lor
the
lateral
loading
is
controlled
manually
in
both
loading
cases.
The
applied
load
is-adjusted
to
follow
aPproximatelythe
prescribed
displacement
paths.
The
target
displacement
ductilities
are.
O.5,
1,
3,
etc.,as
shown
in
Table1.
The
displacement
ductility
is
calculated-by
dividing
the
displacement
by
the
yieLding
displacement.
So
the
displacement
ductilit'y
atthe
yielding
dispiacement
becomes
equai
to
1.
The
yielding
displacement
is
defined
asthe
displacement,
at whichthe
strai'nof
the
longitudinal
reinferce・mept
in
the
tensile
zone reaches or exceedsthe
target
strain valuegf
O.2
%.
The
yielcl
strain
of
the
longitudi'nal
reinforcernentis
O,
20-O,
21
・%
as
obtained
from
standard
tensile
tests.
The
yielding
displacement
occurs atthe
top
displacement
to
column
length
ratiQ
of
about
11200,
in
both
the
uniaxial
andbiaxial
ioading
tests,
,
,
The
axialload
values are13
or
25
%
of
the
axial
ultimate
strength.
This
ultimate
strength
is
obtained
by
the
product
of
the
28-day
concrete
strength
and
.the
gross
sectionat
area
of
the
column.
The
axial
load
is
appliedto
the
'free
end ofthe
column
through
an
universal
joint
attached
to
a
loading
girder.
The
hydraulic
center
hole
jacks
(celpacity
100
t
in
compression)are
driven
by
the
automatically
controlled
hydraulic
pump
(pressure
720
kglcm2,
capacityO.
5
llmin.
).
The
capacity
of
the
pump
is
not
enough
to
89--
cape:IlgSL:::lai[ES:;iilt-:ptT
:8coiiiii:,lii1・l・11tltt/IEpb
ses8e
"・D""an40DBOO4001600
ess
4-sQg-L
Longttudtnal Re±nforcement 8-D19(ptdO.34Z)
Tramsverse RAtn[eTeement 3-Dloeleo
(pw!e.43z)
Hg.3
Test
specimenfor
biaxial
loading
test
pt8q AxialFerce Loa"ng:ogirderH
otsLoadingHeight
''''
'
'
e)"- Prestressir/gee-SteelLedof2eJ 32rnmDiameter-Test oSpecimen
oco 15001500
1000TestingFloer
follow
the
sudden
change
in
the
axial
load.
As
a
result,the
valuesof
the
axial
load
are
seen
somewhat
scattered.
For
the
sake
of
safety
and
stability
of
the
axial
load
induc-ing
system,
the
contact
points
of
the
girder
ends
and
the
axial
load
inducing
tension
rods
are
madeto
be
lower
than
the
free
end
of
the
column
like
a
balancing
toy.
Then,
the
axial
load
inducing
girder
is
fabricated
in
C-shape
for
the
unia-xialloading
test
and crossedC-shape
for
the
biaxial
loading
test,
foroedSng
Fig4
Loading
set-upfor
biaxial
loading
test
3.
Instrumentation
and
ment
The
displacement
at
the
top
ofthe
columnis
measured
at
two
points,
near
the
corners
of
a
face,
so
as
to
take
into
account
the
effect
of
possible
horizontal
rotation.The
displacement
measurement
is
made
in
the
direction
of
the
lateral
loading
(NS)
in
case ofthe
uniaxialloading
test,
and
in
the
mutually
perpendicular
directions
(NS
and
EW)
in
case
of
the
biaxial
loading
test.
Differential
transformer
tyPe
transducers
are
used
for
the
displacement
measurement atthe
columntop.
Both
lateral
and axialloads
are
measuredby
strain
gage
type
load
transducers,
whichare
connectecl
to
the
loading
jacks.
The
verticaldeformation
and rotation are measuredin
100
or
200
mmgage
length
using straingage
type
U-shaped
deformation
transducers.
These
transducers
are
fixed
to
the
bolts
specially
anchored,
using
thrust
bearings
in
order
to
form
rotation
free
joints.
In
the
uniaxialloading
test,
the
verticaldeformation
and
rotationare
measured along one colu'mnface,
parallel
to
the
loading
direction.
In
the
biaxial
loading
test,
they
are
measured
along
the
two
adjacentfaces
of
the
column.
Strains
in
the
longitudi]nal
and
the
transverse
reinforcement are measuredby
using
electrical
resistance
strain
foil
gages,
with
2
rnm
gage
length.
Strain
gages
of5
mmgage
length
are usedfor
measurementof
large
strains
of
up
to
10
%
.
The
axial
loads,
lateral
loads,
deflections,
rotatio.ns and strainsare
converted
into
electrical
signalsby
transducers.
During
each
cycle,
the
loading
is
temporarily
stopped
whilethe
output
signals
are
automatically
scanned
and
stored
in
a
computer
floppy
disk.
In
addition,signals
from
the
displacement
and
load
transducers
are
displayed
by
cligital
volt
meters,
and
recorded
in
analog
form
in
a
X-Y
-90-recorder,
The
lo'ading
program
is
contlolied
manuallyby
monitoringthe
digital
voltMeter
readings and'
the
X-Y
recorderdiagrams
of
the
'displacernents
trajectory.
.
'
Test
specimens, are whitewashedto
make
it
easy
to
detect
cracks enthe
concrete surface.Cracks
developed
during
loading
are marked with apencil,
sothat
crackpatterns
canbe
follQwed
easily.At
the
loading
stage whenthe
residual
displacement
becomes
zero, ciackpatterns
ancl outlines of.concrete
spall・
off
area
are
traced
with
q
fiber
tip
pen
on
a
transparent
thin
plastics
sheetof
,500
mm width.The
width
of
the
'sheet
is
made equalto
that
ofthe
column,so
as
to
make
it
easy
to
reset
the
sheet
as
required, when
tracing.
Crack
patterns
and
outlines ofthe
concrete spall effarea
are
divided
into
smalllinear
siegments
at
adequate
intervals
by
manualoperation,
Vector
data
of
these
linear
segments
'are
obtained
by
a
tablet
digitizer
and storedin
a computerfloppy
clisk,
The
cracks
at
the
corner
between
the
column
face
and
the
top
of
the
feoting
block
are
nottraced,
The
color
infoimation
of
a
pixel
of
a computer colordisplay
is
indicated
by
green,
red
and
blue'
bits.
Those
c61orbits
data
can
be
read
into
arrayclata
of aBasic
program.
After
setting
a
computer
display
(640
×475,
pixels)
to
500
pixels
representing
the
column
width of500
mm(1
mlnlpixel), crac,kpatterns
aredrawn
with''blue
lines
on
the
computer
display,
using vecCordata
of cra6kpatterns.
The
linear
segments ofcrack
patterns
aregr6uPed
into
three
cornpOrients,
horizontal',
diagonal
and
vertical,
The
last
pixel'ofeach
segment
is
coleredgreen,
in
orderto
avoid countingthe
last
pixel
three
times,
as
the
equivalent
erack,16ngth
is
calcul.atedby
eachcomponent
grdup.
If
cpncrete
spalling
data
exist,
outlines
of
the
spall
off area aredrawn
with'Iedlines
on
the
same
display,
The
inside
of
the
figure
is
painted
recl,in
otder
to
delete
cr'ack
patte'rns
included
inthe
figure.
The
equivalent
crack
length
is
obtainecl
by
counting up
the
numberof
the
blue
pixels
indicating
the
trajectory.
The
totar
equi,yalent cracklength
is
calculatedby
addingthe
equivalent
crack
length
for
the
three
components.This
pixel
counting methodcan
give
103.0%
(the
average valueof
39cases
without
spalling,
maximurp
111.9%,
minimum
97,
3
%
)
efthe
acctiratecrack
length
c'alculated
frorn
crack
vectordata
by
the
Py.thagorean
theorem.
The
total
spall
off
area
is
obtained
by
counting
up
the
number
of
the
redpixels
indicating
the
spall
off
'
areas
on
'the
disPlay,・'
'
',
4.
Test
results
Loading
path
'
.
:Fig,
5
showsmeasured
ioading
paths
on
the
NS-EW
displacement
plane
for
the
biaxial
loading
tests,
which
are
obtained
as
the
trajectory
ofthe
columntop
displacernents
alongthe
two
principal
axes
during
the'biaxial
loading.
It
is
seen
that
the
manualcontrol
of
loadings
has
been
good
in
achieving
the
prescribed
displacement
paths,
which are shownin
the
second
column
ef
Table
1.
,Damage
In
the
uniaxial
loading
test,
there
is
a
significant
difference
in
the
qamage
behavior
between
loading
surfaces,
perpendicular
to
the
lateral
load
direction
and
indicated
by
S
'and
N
surfaces
in
Fig.
6,
and
non-loading
surface,
parallel
to
the
load
and
in-dicated
by
E
surface
in
Fig.6.
0n
loading
surfaces,
horizontal
flexural
cracks
are
domi-nant,
And
on
non-loading
surface,
diagonal
cracks
h're
dominant.
Ih
the
biaxiar
loading・test,
horizontal
flexural
crlacks
are
observed
on
all
surfaces up
to
the
yielding
displacement
load
cycles, as shown
in
Fig.
7.
In
thg
uniaxial.
Ioad-ing
test,
spalling occurs mainlyin
full
column
width-
of
the
loading
surfa'ces
and
in
beth
the
corner
parts
of
the
non-loading
surface.
In
the
biaxial・loading
test,,spalling
occurs
in
al'most
N w;E
40
Bc-1
S20
40
20
2040
A
E
2o
v
tP'
Lo
4o
40:BC-4
v20no20
204e
Defleetton40
35
o 40B9-3 20o20
204'403eBe-s
o20 a2040Fig.5
Measured
loading
path
of
biaxial
loading
test
sSurfaee(Leading
A
-ESurfaee1Xl
s/Z
NSurfadeCLoadtng)-v-i
Jt-.
sJ--'
p=lN
.
Ep-3
s
-f'tt''t-'
N-t,
.-.tit.-eet
y
-.
d N w t s -t Eil)sN
pm5N
}.k-Ek
xN
L N-'it'
as
pt =10
and spall off area of specimen
.i:..xj
L
.l,-pt
E1s・.-・E,-ii
stepspe7Fig.6
Crack
pattern
LC-12
at
end ofloadingESurfaeeNSurface
--IT---"..
---H--+-t
''
NeA"=o.s
"-1
"±
3"=S
Fig.7
Crack
pattern
and spalloff
area
of
specimen
BC-6
at end ofloading
steps
full
colurnn
width
in
all
surfaces.Spalling
of
concrete
cover
starts
from
adisplacement
ductility
of3
in
biaxial
loading,
comparedto
that
of
5
in
uniaxialloading,
In
case
of
the
biaxial
loading,
horizontal
cracks
atthe
bottom
parts
become
visible
in
all
sufaces
at
displacement
ductility
of
O.
5.
.As
the
ductility
increases
to
1,
mainlyhorizontal
cracks
continue
to
develop
together
with
a
few
diagonal
cracks.At
this
ductility,
the
cracks
are
seen
to
develop
up
to
a
height
oflegs
than
one column width.The
authors
also
noticed afew
vertical cracks nearthe
free
end ofcolumn
specimens.
It
seemsthat
insufficient
anchorage
oflongitudinal
reinforcement atthe
to])
ofthe
colurnn
is
the
cause efthese
cracks,
The
cracks
at
the
bottom
parts
continueto
increase
and expand asthe
displacement
of
the
column
increases
upto
aductility
of3.
Beyond
a
ductility
of
3,
the
rate
of
development
of newcracks
slows
down,
the
existing cracksare
seen
te
widen
further,
and
shallow
concrete spalling
begins
in
all
surfaces.
At
a
ductility
of
5,
concrete
cover spallingoccurs
oyer widearea
on all surfaces,and
the
reinforcement
is
uncovered.
Sorne
ofthe
longitudinal
reinforcement
buck].e
slightsy
between
transverse
reinforcements.At
aductility
ef
7,
the
core
concrete,
confined
with
crossties
andtransveTse
reinforcement,disintegrates
seriously.
This
!eads
to
epening of endhooks
(lc:s
or
180
deg.
)
of
ctossties
andtransverse
reinforcernent,
so
that
the
concrete
coreis
nolonger
confined.The
column
length
becomes
rapidly shorterunder
the
action of axialIQad
withthe
con$eque/nt
lafge
scale
buckling
oflongitudinal
reinforcement.
Hysteresis
loops
Load-displacernent
hysteresis
loops
ofthe
specimenLC-12
are
given
in
Fig.8,
as
a
typical
representative
of
specirnens
underthe
uniaxialloadings.
The
load-displacement
relationshipof
the
specimen
LC-13
is
alsodrawn
by
a
broken
line
in
Fig.
8.
The
specimen
LC-13
was subjectedto
the
oneway
monotonic
lateral
loading
alongone
of
the
principal
axes.
These
cyclic
hysteresis
loops
are yerystable
up
to
very
high
displacement
ductility
of
the
order
of
10.
The
specimen
LC-12
reachesthe
-92-ultimate
strength
at
around
displacement
ductility
of
3.
After
the
ultimate
strength,
the
spe.cirT}en
shows
very slight strength
d,egradation
upto
veryhigh
displacement
ductility,
The
envelope
curve
of
the
specimen
LC-12
almostcoincid6s
withthe
load-displacement
relationshipof
the
・specimen
LC-13.
It
'seems
that
there
is
almost
no
effect
of
the
cyclic
loading
on
res.toring
force
characteristics
when
there
is
only one cyclein
eachloading
step.Load-displacement
hysteresis
loops
ofthe
specimensBC-3
andBC-6
aregiyen
in
Figs.
9
and
lo,
respectively, as
typical
representatives ofspecimens
underthe
biaxial
loadings.
The
specimen
BC-3
is
subjected
to
the
crossaltemate
,loading
paths
along
the
NS
and
EW
axes.
The
load-displacement
hysteresis
loops
of
the
specimen
BC-3
are
drawn
independently
on
the
NS
and
EW
planes.
The
specimen'
BC-6
is
subjected
to
the
circularload-ing
paths,,
so
the
load-displa'cement
hysteresis
loopg
areindependently
drawn
as
projected
charts
on
the
NS
nadEW
planes.
The
load-displacernent
relationship ofthe
specimenBC-4
is
drawn
by
a
broken
line
in
Figs.
9
ancl10.
The
specimen
BC-4
is
subjected
to
verylarge
bia-xial
one
cycle
loadings
witha
displacement
duc-tility
of10,
The
load
was appliedfirstly
along
the
NS
axis,
and
then
along
the
EW
axis,The
specimen
collapsed
half
waythrough
the
EW・
loading.
Both
envelopecurves
of
the
specimens
BC-3
andBC'6
reachthe
ultimatestrength
at
around
displacement
ductility
of
2.
After
the
ultimate
strength,
hysteresis
loops
show
rapidstrength,degradation.
The
specimen
BC-6
shows
more
serious・
strength
degradation
than
the
specimen
BCJ3.
It・can
be
said
that
the
bia-xial
loading
path
gives
mucfi
severer
damage
onthe
columnthan
the
uniaxial
loading.
And
with-in
the
biaxial
loading,
the
areal
loading
paths,,
like
circularloading
paths,
give
severer
damage
than
the
linear
loading
paths,
like
alternative
cross
loading
paths.
Equivalent
crack
length
ratio and spall off arearatlo
'
・
The
total
equivalent cracklength
is
calculated
on
the
square area(500
×500
mm2)
of
one
col-umn width sides at
the
bottom
of
the
Column
bY
the
pixel
・counting
method
mentioned
above.
The
equivalent
crack
length
ratio
is
defined
as
the
ratio ofthe
total
equivalentcrack
length
to
the
column
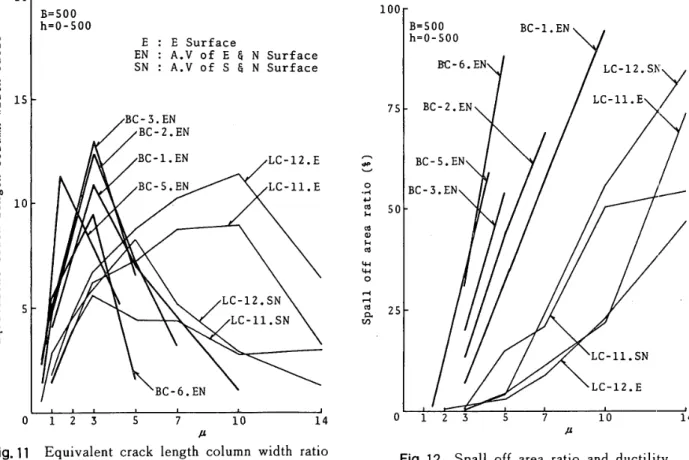
width,Fig.11
shows
the
rela--tionship
between
the
equivalent
crack
length
ratio
and
the
clisplacement
ductility
foT
both
the
uniaxial
andthe
biaxial
loading
cases,
For
the
uniaxialcase,
the
equivalent
crack
length
ratiois
seento
increase
with
displace-rnent
ductility
up
to
a
value of5.
After
that;
the
s soAg"vao213ttS7t-T---t.---pt=leL--t--L
:30e-20
-30-2e
203040 beflectton{mn)-2e-30
LC-12LC-i3---"--40-so
Fig.8Load-displacement
LC'l2
and
LC-13loops
ofspecimens?so
Ne
l
U4o
t rd V---+--E'-03ols.3s/.-.--.--."s.-pt=
it"3'--"')
t
t
' 'rS..J/'/-rt---.t''
-30
'
..V-10
.'!77i,y
t/i'y/gtf,ttt
,f"'
tt
tytt.tt'
tt.t
'i's
/' ''.t."/
'''"t"
tt
,:
・fi!
tttt.
'7・fi'lo.."x3o
,,'tf..""Deflecti'en(m])tttttt
t
.
y'x""""'''x'1'(
v'.l,・・r
BC-3NSr1
EW----'
-h"H'J""r---!,!=:rr:tV.ii.',・z':E'Y・''-4D
BC-4NS----50
Fig.9Load-displaeement
BC-3
and
BC-4loops
ofspeelmensFig.1O
p
L'oad-di$placemenr
BC-6
andBC-4
lbloops
ofspeclmens N-93-etrlvtuk=pv・H3gE=-eo=vtn:odMoatgvp=o"tu>.H=orut
20
IS
10
s
B=SOOh=O-SOO
E
:E
SuTface
EN
:A.V
ofE
G
N
Surface
SN
:A.V
ofS
G
N
Surface
Ol23
S7
10
14
#
Fig.11
Equivalent
crackIength
column width ratioand
ductility
n-wo-vutkcovked"igod-ptAtn100
7S
so
2S
O123
S7
10
14
#
Fig.
12
Spall
off area ratio andductility
equivalent
crack
length
ratiofor
the
loading
surfacedecreases
due
to
the
effect
of
concrete
spalling,
but
it
still
continues
to
increase
for
the
non-loading surface.At
a
displacement
dllctility
of1,
the
equivalent
crack
length
ratio
is
about
2.
5
in
beth
the
loading
and
the
non-loading
surfaces.
At
aduc/-tility
of
3,
the
ratio
becomes
about
6.
At
aductility
of7,
the
ratiois
about5
in
the
loading
surface, and about10in
the
non-loading
surface.
For
the
biaxial
case,
the
crack
length
ratio
is
seen
to
in-crease
withdisplacement
ductility
up
to
a
valueof
3,
After
that,
the
cracklength
ratiodecreases
rapidly
due
to
the.
effect
of
concrete
spalling.
At
a
displacement
ductility
of1,
the
cracklength
ratio
is
about5.
At
a
ductility
of
3,
the
ratio
becomes
about
10.
The
total
spall
off
area
is
also
calculated
onthe
square area(500
×500
mrn2) of one colurnn widthsides
at
the
bottom
ofthe
columnby
the
pixel
counting method mentioned above.The
spall off area ratiois
defined
a$
a
percentage
ratio
of
the
total
spall
off
area
to
the
whole
targeted
square
area.
Fig.
12
shows
the
relationshipsbetween
spalloff
area
ratios
and
displacement
ductilities
of
both
the
uniaxial
and
the
biaxial
cases.
The
spall
off
area
ratio
increases
rapidly
with
the
increment
in
the
displacement
ductility.
It
is
to
be
noted
that
the
equivalent
crack
length
ratioand
the
spall
off
area ratio usedin'
this
study
are
the
relative valuesfor
expressing
the
level
of
earthquake
damage.
The
equivalent
crack
length
ratio
and
the
spall
off
area
ratio
for
the
biaxial
loading
case
shoulcl
be
used
for
evaluating
the
earthquake
damage
of
reinforced
concrete
buildings
which
have
alrnost
same
deformation
characteristics
in
both
the
longitudinal
andtransverse
directions.
The
information
on
the
crack
width
is
not
considered
here,
5.
Conclusions
The
experimentalprogram
is
conductedto
studythe
damage
behavior
of
reinforced
concrete calumns,subjected
to
the
uniaxial
a4d
the
equal
amplitude
biaxial
lateral
loadings,
in
the
nonlinear
plastj,c
range.
A
methed
of
evaluating
the
damage
level
of
reinforced
concrete
columns,
based
onL
visual
information
such
as
cracks
and
spall
off
area,
is
presented,
Further
researchis
neededto
investigate
tkte
effects
of
various
parameters
such
asthe
different'
amplitudebiaxial
loading
paths,
the
variation ofthe
-94-axial
load,
the
repetition
of
loading
cycles
at
each
step,
the
velocity
of
the
deformation,
and so on.Major
conclusions
include
the
following,
.
1)
The
damage
features
of
columns
under
the
biaxial
loading
are
differenE
from
those
ofthe
uniaxialioading.
The
biaxial
loading
cases are seento
simulate
somewhatthe
actualearthquake
damage
on
columns
of
reinforeedconcrete
buildings,
for
whiehthe
deformation
characteristics
in
longitudinal
and
transverse
directions
are
same.
Sb
the
crack-spatldamage
indices
from
the
biaxial
loadings
ban
be
applied
for
evaluatingthe
state ofdamage
in
suchbuildings
in
the
event ofqctual
earthquakes.
The
equivale'nt
crack
length
ratio
should
be
used
in
evaluating
the
degree
of
damage
for
a
displacement
ductility
of
up
.to
3.
The
spall
off
area
ratio
should
be
used
beyond
a
ductility
of
3.
'
'
According
to
the
crac.k-spall
darnage
indices,
the
fpllowing
observations
can
be
made
with
regard
to
the
gener,al
trend
of
clamage
to
biaxially
loaded
column
in
this
experimental
study
:
a
)
If
the
equival'ent
crack
length
ratio
is
around
s
and
the
highest
crack
height
is
less
than
one
column
width,
the
maximumdisplacement
ductility
experienced
is
less
than
1.
b)
If
the
equivalent
crack
length
ratio
is
around
10
and
the
spall
off
area
ratio
is
from
10
to
30
%,
the
maximum
ductility
is
around3,
c
)
If
the
spalloff
area ratiois
from
30
te
85
%
and reinforcirigbars
are uncovereddue
to
the
spallingof
concrete
cover,
the
maximum
ductility
is
around
5.
d')
If
the
spalloff
area ratiois
more
than
50,%
andtransverse
bars
become
loose
andlongitudinal
bars
buckle,
the
maximum
auctility
is
over
5.
'
2)
The
biaxial
loading
gives
rnore
serious
damage
to
the
concrete
columns
than
the
uniaxial
roading.
In
the
biaxial
loading,
the
・areal
loading
path,
in
whichthe
displacement
trajectory
ofthe
column'formsareal
figures
like
the
circular
loading
path,
gives
rise
to
more
serious
strength
degradation
ofthe
concrete'columns
than
the
linear
path
such
as
the
alternate
cross
loading
path.
Therefore,
the
biaxial
loading
effects shouldbe
taken
into'account
for
the
modeling of restoringforce
characteristicsfor
the
type
o'fbuildings
mentioned above,'
'
6,
Acknowledgement
,
.
The
authors
wish
to
express
their
appreciation
to
the
Science
Research
Foundati.on
of
the
Ministry
of
Education,
Goyernment
of
Japan
for
a
grant
(No.
O1601008)
in
parti,al
support
of
this
expe'rimental
research
program.
They
'also
wish
to
thank
Prbfessor
Akenori
Shibata
for
his
valuable
advice
and
suggestions,
and
the
students
andgraduate
studentsof
the
Sttuctural
Laboratory
of
the
Department
pf
Architecture,
Faculty
ofEngineenng,
Tohoku
University
for
their
assistance while conductingthe
expenrnents.
Reterences'
'
1)
Shibata,
A.
, andSozen,
M.
A.
:
Substitute-Structure
Method
for
Seismic
Design
in
RIC,
JouTnal
of theStructural
Division,
ASCE,
VoLI02,
No,ST.1,
pp.1-18,
1976.1,
2)
Banon,
H.
,
Biggs,
J.M.,
andMax
lrvine,
H.
:
Seismic
Damage
in
Reinforced
Concrete
Frames,
Journat
ofthe
Structural
.Diyision,
ASCE,
Vol,I07,
Ng.ST9,
pp.1713-I730,,
]981.9.
,
3)
Toussi,
'S.
,Yao,
J.
Y.
P.
, andChen,.
W.
F.
:
APamage
Indicator
for
Reinforcecl
Concrete
FTarnes,
Jguinal
ofACI,,
Vol,,81,
No.3,
pp.260-267,
1984,3..
4)
Darwin,
D.,
andNmai,
e,K.
:
Energy
Dissipation
in
RC
Beams
underCyclic
Lead,
Journal
ofthe
Structurat
Division,