Regional Development with
ICT Economic Corridor Approach
in Mega Manila
in the Republic of the Philippines
STUDY REPORT
September 2004
Engineering and Consulting Firms Association, Japan
Nippon Koei Co., Ltd.
Table of Contents
Executive Summary
Abbreviations
CHAPTER 1 INTRODUCTION ... 1
1-1 Background ... 1
1-2 The Study Area... 1
1-3 The Objectives of the Mission... 2
1-4 Scope of Work of the Mission ... 2
CHAPTER 2 PRESENT CONDITIONS OF THE STUDY AREA ... 4
2-1 Demography ... 4
2-2 Socio-Economy... 4
2-3 Industrial Estates and Economic Zones... 5
2-4 Urban Centers... 7 2-5 Transport Network ... 7 2-5.1 Road ... 7 2-5.2 Rail ... 8 2-5.3 Maritime Transport... 9 2-5.4 Air Transport ... 10 2-6 Industries... 11 2-7 ICT Network ... 12 2-7.1 ICT Operators... 12 2.7-2 ICT Network... 12
2-7.3 Other ICT Services ... 15
CHAPTER 3 RELATED GOVERNMENT POLICIES ... 16
3-1 The Ten-Point Agenda ... 16
3-2 National IT Policies and Strategies... 16
3-2.1 National IT Policy ... 16
3-2.2 Individual IT policy... 17
CHAPTER 4 DEVELOPMENT AGENDA IN THE MEGA MANILA... 22
4-1 Development Issues... 22
4-1.1 Need for Integral Vision for Mega Manila ... 22
4-1.2 Need for Balanced, Multi-Functional Regional Cities ... 22
4-1.4 Recognition of IT as a Central Tool for Regional Networking... 23
4-1.5 Use of IT Tools for Effective and Accountable Government Administration... 23
4-1.6 Need to Share Essential Information on Investment Promotion... 24
4-2 Proposed Projects for ODA Funding... 25
4-2.1 Component 1: Regional Development with ICT Economic Corridor in Mega Manila ... 25
4-2.2 Component 2: Development study for the upgrading of local government administration by ICT ... 27
4-2.3 Component 3: The Enterprise Data-Base and Reference System for Japanese Firms Skills Inventory ... 28
List of Tables
Table 2-1 Provincial Population in Mega Manila ... 4Table 2-2 Gross Regional Domestic Product (GRDP)... 5
Table 2-3 Economic Zones in Mega Manila ... 5
Table 2-4 Urban Population in Mega Manila... 7
Table 2-5 Air Transport Statistics... 10
Table 2-6 Telecommunications Industry Structure... 12
Table 2-7 Outline of Telecommunications Subscription ... 12
Table 2-8 Regional Distcibution of Telephone Lines... 13
Table 2-9 ISP Subscription... 14
Table 2-10 Internet users and PC users ... 14
Table 3-1 IT Parks... 17
Table 3-2 Typical Prof. ITs’ area ... 18
List of Figures
Figure 1-1 Study Area - Mega Manila and Proposed IT Economic Corridor ... 2Figure 2-1 Railway Statistics ... 9
Figure 2-2 Foreign Cargo Statistics ... 10
Figure 2-3 Optical Fiber Network... 15
Appendices
Appendix B The Scope of Works for the Proposed Projects
Appendix B-1 Terms of Reference for Regional Development with the ICT Economic Corridor in Mega Manila Region
Appendix B-2 Terms of Reference for Development Study for the Upgrading of Local Government Administration by ICT in Central Luzon
Appendix B-3 Terms of Reference for Consultancy Services for The Establishment of an Enterprise Data-Base and Reference System for Japanese Firms Skills Inventory
EXECUTIVE SUMMARY
1. CONCLUSIONS
1.01 This mission proposes a comprehensive program approach under a tentative title, “Regional Development with the ICT Economic Corridor Approach in Mega Manila”, encompassing three components as below;
• Component 1: Regional Development with ICT Economic Corridor in Mega Manila
• Component 2: Development study for the upgrading of local government administration by ICT • Component 3: The Enterprise Data-Base and Reference System for Japanese Firms Skills Inventory
These components are inter-woven with each other, and should be thus implemented with an overall coordination under a program approach concept.
2. INTRODUCTION
Background
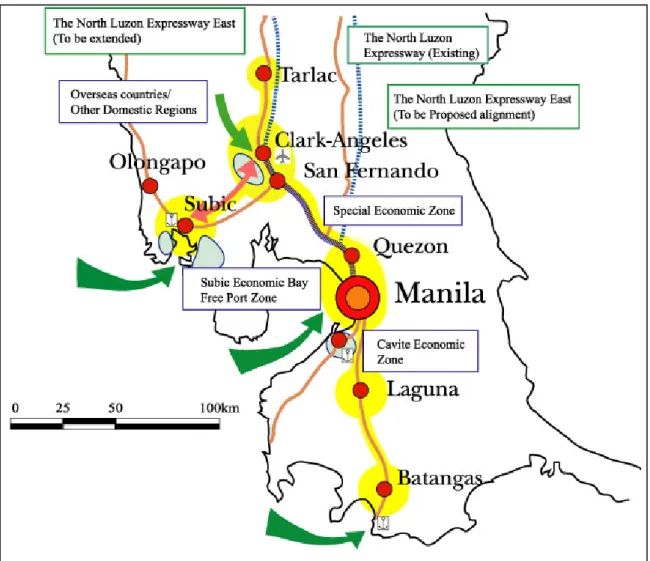
2.01 The Metro Manila area houses the national capital of the Republic of the Philippines (hereafter “RP”) and shelters approximately 10 million residents. The Government of RP recently emphasizes on decentralizing the economic functions from Metro Manila to the surrounding areas, including the Central Luzon Region and the CALABARSON (Cavite, Laguna, Batangus, Rizal and Queson provinces) area, denoted as a whole as the Mega Manila. The Mega Manila commands an area within approximately 100 km of radius from the National Capital Region (NCR), and accessible within 2 hours if effective road networks were provided.
2.02 It is thus envisioned that an overall master plan for regional development of the Mega Manila region needs to be formulated by promoting linkages of the existing urban centers within the region, as well as capitalizing on the enhanced information communication technology (ICT) network for better communication and coordination amongst the development stakeholders in the region.
2.03 In respect of the above, the Engineering Consulting Firms Association of Japan, under the Ministry of Economy, Trade and Industries of Japan, decided to send a mission for Mega Manila Economic and ICT Corridor Development under the Regional Development through Better Linkage Program. The mission consists of the following consultants, and dispatched to RP from 28th July through 12th August, 2004.
• Koji Yamada, Team Leader/ Regional Planner, Nippon Koei Head Office • Katsumi Fujii, ICT Expert, Nippon Koei Head Office
• Masato Kamiya, Socio-Economic Expert, Nippon Koei Manila Office.
The Study Area
2.04 The Study Area consists of the National Capital Area, Central Luzon Region (NEDA Region III), and CALABARSON region (NEDA Region IVa), and encompasses an area of 41,000 km2 and houses a population of 27 million.
The Objectives of the Mission
2.05 The objectives of the Mission is the following;
• To conduct a site survey and carry out extensive hearing sessions with concerned parties to grasp the issues of regional development in the Mega Manila Region
• To prepare scope of works for technical assistance by ODA programs of Japan that are suitable for immediate implementation
3. PRESENT CONDITIONS OF THE STUDY AREA
Demography
3.01 The Mega Manila encompasses an area of 40,000 kim2 in total, consisting of the NCR, NEDA Region III and IVa. The total population of the Mega Manila is 27 million, of which 10 million is in NCR, 9 million in Region III and 8 million in Region IVa. The population of the Mega Manila grew at an annual rate of 2.8% over the decade between 1990 and 2000, of which the Region IVa has the highest annual growth rate of 3.6%, showing a rapid economic growth.
Socio-Economy
3.02 Economic activities have been concentrated in Metro Manila that accounted for 31 percent of gross domestic product (GDP) of RP in 2002 and Regions III (share of 9 %) and IV (share of 16%). Thus the Mega Manila area has about 50% share of GDP in the whole Philippines.
Industrial Estates and Economic Zones
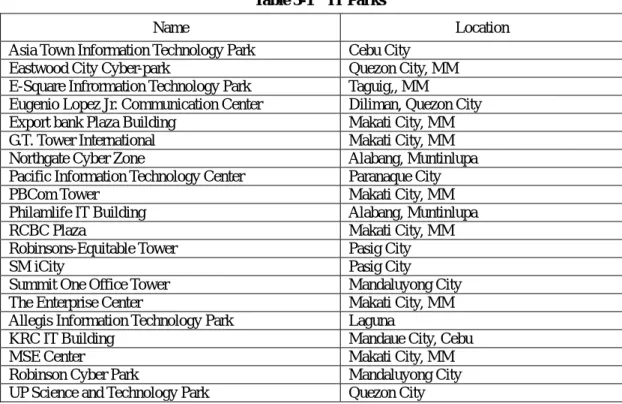
3.03 At present more than 60 industrial estates (registered by PEZA) have become investment powerhouses brought in by estate developers and locators. Industrial estates are spread all over the country covering more than 20,000 hectares of land, of which some 7,000 hectares are occupied, where more than 900,000 employees are working. Currently more than 900 firms registered by PEZA are operating in 65 economic zones, of which approximately 750 firms are located in Mega Manila area. Separately in total 76 ICT parks are registered by PEZA, of which 73 ICT Parks are located in Mega Manila.
Urban Centers
3.04 The largest urban center in the Mega Manila is naturally the Metro Manila, which consists of 17 urban centers. In Region III, the largest of the existing urban centers are Angeles in Pampanga Province and Tarlac in Tarlac Province, both having a population exceeding 260,000. In Region IVa, the largest urban center is Batangus with its population growing rapidly to reach 250,000. It is noted that the size of the urban centers in the Mega Manila regions are generally in the range not exceeding 300,000. Compared with the urban centers in the Metro Manila, ranging from 500,000 through 1,000,000 or more, the size of the cities in Regions III and IVa are generally small, and the ratio of urban population in these regions is not more than 15%, which shows limited urbanization in these areas.
Transport Network
Road
3.05 Metro Manila is traversed by two circumferential road network and eight radial roads. The two circumferential road links, however, can hardly cope with the increasing traffic and commodity flows that are still concentrated in Metro Mania, and those circumferential roads are not completely functional as a ring road due to the incomplete connection. The road network in Metro Manila needs to have good linkage with the road network with the neighboring regions especially with the Region III in the north and the Region IV-a in the south.
3.06 In region III, the Subic-Clark-Tarlac Expressway project is currently underway with the financial assistance of Japan. This project is aiming at connecting Subic and Clark by a 94.5 km expressway running from Subic Bay all the way up to the 6,400 ha Hacienda Luisita in Tarlac. There are three future
expansion plans being considered; the upgrading of the North Luzon Expressway which connects the Region III and Metro Manila, the extension of Subic-Clark-Tarlac Expressway to further north, and further east from Tarlac.
3.07 CALABARZON (Region IV-a) has weakness of road network, which hinders the linkage between the Batangas Port, Manila International Airport (NAIA), Manila International Cargo Terminal/Port and the region’s industrial estates. The South Luzon Expressway is the main artery that connects Metro Manila with CALABARZON. Over the years, as the areas surrounding the South Luzon Expressway, particularly south of Metro Manila and the areas within Laguna province, have seen massive industrialization, the extension of the South Luzon Expressway from Calamba to Sto. Tomas is currently under construction and it is said to complete in two years. This segment is a small portion of the whole length of a logistic corridor in CALABARZON, and will not deliver its full function unless the construction of the segment Lipa - Batangas City, where the modern sea port is under improvement with the financial assistance of Japanese Government.
Rail
3.08 The railway systems that pass through the Mega Manila are operated by the Philippine National Railways (PNR), the Light Railway Transit Authority (LRTA) and the Metro Rail Transit Authority (MRTA). PNR has two existing lines traversing Mega Manila area, of which the Line North is no longer operational and the Line South is only partially operational with only four or five trips daily. The rehabilitation of those lines has been under consideration but has not yet been materialized.
3.09 There are three light rail systems operating in Metro Manila; the Light Rail Transit (LRT) Line-1, LRT Line-2 and the Metro Rail Transit (MRT) Line-3. LRT Line-1 runs from north to south of Metro Manila (Monumento in Calaoocan City to Pasay City) for 14.5 km, LRT Line-2 runs from Quezon City to Pacig City for 4.3 km, although this is still partially operational while the remaining construction work for 9.5 km is still on-going, and MRT Line-3 runs from the North Avenue in Queszon City to Taft in Pasay City for 16.7 km. Those passengers lines ,however, are not efficiently connected and inter-modal integration (LRT stations and expressway entries/exits, etc.) is inadequate and hence they do not fully contribute to the improvement of traffic conditions in Metro Manila. The extensions of LRT and MRT lines have been planned but not yet been materialized.
Maritime Transport
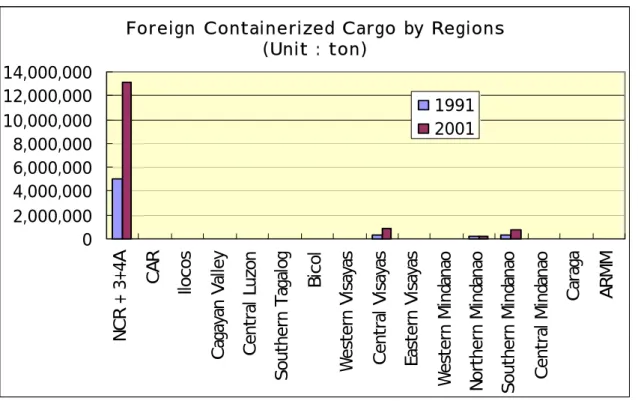
3.10 Manila has access to a a number of international destinations, making water transport a reliable alternative. The port of Manila at the mouth of the Manila Bay is composed of two harbors and one container terminal. The entire port handled 41 million tons of sea borne cargo in 2001 which accounted for about 30 percent of total cargo volume in the Philippines. Whilst this function has to be concentrated into one specific area especially in order to facilitate the scale of economy, the negative externality of the concentration of land transportation in Manila has been notable, such that the traffic congestion in Manila reaches a serious level.
3.11 The Batangas Port, now being utilized by locators in the CALABARZON is seen to be beneficial in streaming logistic requirements of export industry, as well as in easing the chronic congestion in major roads leading to the Manila Port. The expansion work is underway with the financial assistance of Japanese Government.
3.12 The Subic Port has currently been utilized mainly for the domestic cargo with a gantry crane in place. It is expected that the port can be a substitute for the Manila South Harbor in 10 years time as the principal port of entry into Matro Manila and Region III and as a regional transshipment port. The expansion works that have been financially supported by Japanese Government will be completed by 2007.
Air Transport
3.13 There are eighty-five public airports in the Philippines, of which four are designated as international airports (Ninoy Aquino Inter-national Airport, Subic, Clark, and Cebu) and four (4) others as
alternate international airports (Zamboanga, Davao, General Santos/Tambler, and Laoag). The airports in Clark and Subic are utilized mainly for private airfreight companies. The Clark airport which was initially planned to be a regional cargo hub and an alternate airport to NAIA needs to be developed as an international passenger gateway for Mega Manila supplementing or replacing some functions of NAIA.
Industries
3.14 NCR recorded output gains in both the industry and service sectors. The construction sector in NCR picked up from a negative 32.5 percent to 7.8 percent and the accelerated performance in the manufacturing boosted the performance of the industry sector. The substantial gains in Trade, Finance, Ownership of Dwellings and Real Estate (ODRE) and Government Services were enough to offset the deceleration in the outputs of the other sub-sectors such as electricity and water, transport communication and storage and private services.
3.15 In CALABARZON, the industry sector contributed the highest to the GDP at an average of 43.2 percent. The significant contribution of the sector was mainly due to the increase in manufacturing, construction and electricity, gas and water sub-sectors. The manufacturing industry in CALABARZON accounts for almost one-third of the overall regional economy and contributed and average of 19 to 20 percent to national output in manufacturing sector.
3.16 Region III is dominantly agriculture-based area also called the Rice Granary of the Philippines, delivering one third of the country’s total rice production. It is expected, however, that the region will develop industry and service sectors capitalizing on the well-facilitated transportation infrastructure such as expressway, seaport and airport and economic zones in the Area.
ICT Network
ICT Operators
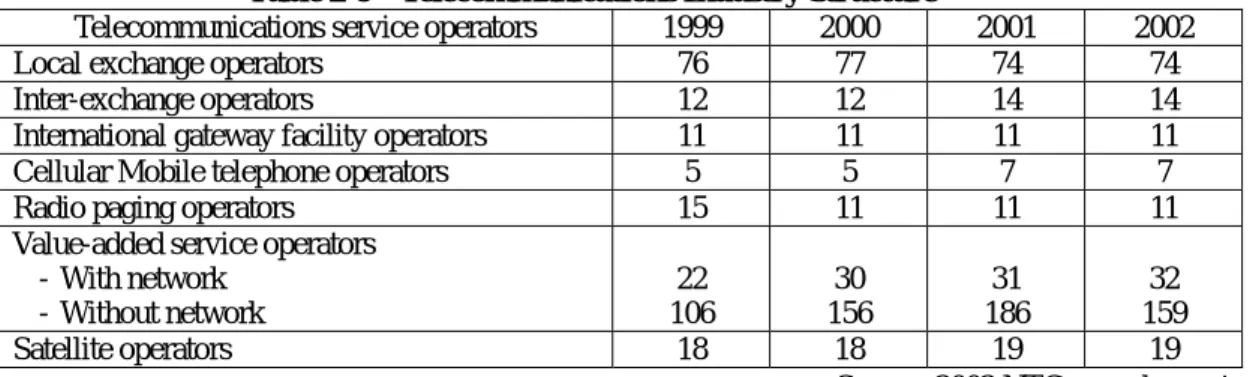
3.17 The telecommunication business in the Philippines was started by the private telecommunications operator during regnum of the U.S. The Manila telephone company was founded in 1905, and the name was changed to Philippine Long Distance Telephone Company (PLDT) in 1928. Since then, telecommunication business has been managed on a private sector initiative. The above liberalized service environment of telecommunications has so far resulted in the 11 international gateway operators, 7 cellular mobile telephone operators and 19 fixed line operators nationwide.
ICT Network
3.18 The subscribers as of 2002 of fixed line telephone, mobile telephone, and the Internet are 3.3 million, 15.4 million, and 0.8 million, respectively. The availability of telephone lines in areas outside of NCR is much lower than in NCR, showing a considerable imbalance of telephone lines in the nation. 3.19 In order to increase the number of fixed line telephone connections, the “Service Area Scheme (SAS)” under the “Basic Telephone Program (BTP)” was introduced in July 1993. This scheme requires new mobile telephone service licensees to install 400,000 local exchange lines and 300,000 local exchange lines to new international gateway service operators. As a result, the fixed line telephone density as of 2002 exceeded 4% from the level of 1% before enforcement of SAS. However, the activity ratio of the facilities has only been 44%.
3.20 The growth rate of respective services for the three years from 2000 to 2003 was 7% for fixed line telephone, 137% for mobile telephone and 100% for internet users. While the number of subscribers to fixed line telephones is relatively stable, the number of subscribers to mobile phones is continuing to increase rapidly.
3.21 According to the statistics of International Telecommunication Union (ITU), the number of internet users in the Philippines in 2001 was estimated to be 2 million. The internet user density is very
low, with only 259 users per 10,000 people compared to an average of 434 users per 10,000 people for the whole Asia.
3.22 The government of the Philippines aims to development the Information and Communication Technology (ICT) oriented business for the further economic development through the utilization of internet as a daily communication tool. However, most of the home users of personal computer at present are unfamiliar with the internet, while most internet users are in the business sector. Promotion of the internet utilization at home is thus required.
4. RELATED GOVERNMENT POLICIES
The Ten-Point Agenda
4.01 In her inaugural speech in June 2004, President Arroyo publicly announced the ten-point agenda, a set of policies to be undertaken in the six-year period of the new administration. This agenda plainly summarizes the policy directions of the regime. There are two points directly relate to this project: Agenda 5; The network of transport and digital infrastructure to link the entire nation; and Agenda 8; Decongestion of Metro Manila by forming new centers of government business and community in Luzon, Visayas, and Mindanao; and the Subic-Clark corridor will be the most competitive international service and logistic centers in the Southeast Asian Region.
National ICT Policies and Strategies
National ICT Policy
4.02 In July 1998 the government of the Philippine adopted a policy entitled “National Information Technology Plan for 21ST Century (IT21)” with the aim of becoming a “Knowledge center for Asia” in the 21st century through the practical use of information and communication technology. The timeframe for development extends over a period between 1998 and 2010.
9 By the turn of the century, the Philippines will have laid the infrastructure for every business, every agency of government, every school, and every home in the Philippines to have access to information technology.
9 By the year 2005, ICT use will be pervasive in daily life. Philippine companies will be producing competitive ICT products for world markets.
9 Within the first decade of the 21st Century, the Philippines will be a Knowledge Center for Asia; a leader in ICT education, in ICT assisted training, and in the application of information and knowledge to business, professional services, and the arts.
Individual ICT policy
Economic Zone(ICT Park)
4.03 In October 1999, Philippine Economic Zone Authority (PEZA) approved tax benefits for ICT application companies in an effort to promote ICT industries in the Philippine. Tax benefits to ICT application companies are the same tax benefits applied to the conventional economic zone under PEZA. As of 2004, PEZA has authorized ICT Parks at 20 locations, including the Eastwood City Cyber Park in Quezon City.
IT Hub Area
4.04 IT Hub Area is the area set up by a Memorandom Circular for “Rules and Regulation on the Provision of High Speed Networks and Connectivity to IT Hub Areas” in May, 2002. It is available that offer of high-speed network service under free payment method by all telecommunications operators including franchise in this area. At present, eight areas are specified as IT Hub Area, including
Pasing-Ortigas Business District, Makati City (Fort Bonifacio Global City and RCBC), UP-Ateneo-Estwood, Quezon City, Subic and Clark areas.
Government Information System Plan(GISP)
4.05 The “Government Information System Plan (GISP)” was adopted by the presidential order (E.O.265) in July 2000. GISP is positioned in the core of a government mid-term development plan (Angat Pinoy 2004) aiming at realization an e-Government within the next 5 years. Development of the following systems of four types is envisioned. The e-Government includes among others, Public service information system (PSIS), Office of president executive information system, Government procurement system (Electronic procurement system), sectoral application systems and the local government information systems.
5. DEVELOPMENT AGENDA IN THE MEGA MANILA
Development Issues
5.01 Even though the greater regional concept of the Mega Manila has been recognized gradually, there are a wide range of development issues that restrain the road to development of the region.
Need for Integral Vision for Mega Manila
5.02 The Metro Manila is showing a sign of over-density in every aspect – traffic congestion, long hours of commuting and rising property prices in the central area. A number of new projects, including Tarlac-Clark-Subic Expressway, improvement of the Subic and Batangus Ports, are on-going in the Mega Manila that will change the basic structure of the region drastically. Provision of ICT network is also in rapid progress with active contribution from the private sector. Nonetheless, the substance of the changes being brought about by these new projects is still unclear, and the future image of the Mega Manila still vague.
5.03 ICT networks are almost sufficient in supply, although the user-side of the network is weak. Internet connections are much too few compared with neighboring nations, and the literacy of the Philippine people in computer skill need to be improved. Sharing of essential information is long way to achieve. There needs to be a strong initiative on the part of the Government of RP to enhance the ICT capacity of the Philippines, and that of the Mega Manila.
5.04 There is an urgent need for an integral plan of the Mega Manila Region to put together a clear image of the future structure of the region around the core vision of extending the ICT Corridor throughout the region. For this purpose, a clearly defined vision for the integral development of the wider regional area of Mega Manila has to be formulated to address these issues.
Need for Balanced, Multi-Functional Regional Cities
5.05 Urban centers in the RP are small and scattered, and so are the secondary cities in Mega Manila. No sufficient planning of the growth of urban centers is in practice. In Regions III and IVa, the largest of the urban centers have the population not exceeding 300,000, which is much too small compared with the Metro Manila, which houses the population of 10 million. The lack of urban centers in these regions poses constraints for regional development, as well as to the advancement of human resources development.
5.06 It will be essential to increase the government services, economic activities and community functions in central cities in various regions, as these new centers will be the core of regional development and human resources development. Growth of regional cities will also cater to better access of agricultural goods produced in their surroundings. It will be important to introduce enhanced urban
planning to some of the selected urban centers that could grow to be regional centers. Candidate cities may include Tarlac, Angeles and Ologapo in Region III; Batangas, Lipa and San Pablo in Region IVa. Better Utilization of Local Resources in Regional Development
5.07 RP is endowed with indigenous resources in each locality, including agricultural production, fishery resources, natural forests, abundant water resources, tourist attractions with natural beauty or historical importance, etc. Utilization of indigenous resources are limited, due partly to inadequate infrastructures in localities and limited number of tourist visits.
5.08 In order for the creation of self-standing regional economies, it is essential to formulate plans to utilize the locally available resources to produce maximum values to the local economy. Land resources may have to be shared in harmony for various uses, such as industrial and agricultural. For this goal, a land use plan on a regional scale has to be formulated to balance the needs for conflicting demands for use. Recognition of ICT as a Central Tool for Regional Networking
5.09 The present condition which surrounds ICT in the Mega Manila is summarized below.
9 Telephone density of the Mega Manila area is higher than other areas by introduction of Service Area Scheme (SAS).
9 Various telecommunication services are offered under liberalized environment.
9 Despite plentiful human resources, ICT application companies are concentrated in Metro Manila. 9 Internet density is very low with 259 users per 10,000 people, compared with an average of 434
users in Asia.
5.10 Consequently, the study team confirmed that although the basic ICT infrastructure for users in economic zones was comparatively well developed, ICT of application field was not fully utilized in practical activities. Promotion of ICT use in application field utilizing these ICT infrastructures will become more important from now on. In order to accelerate ICT utilization as a support tool for economic development, it is required to formulate comprehensive plans taking into account of above factors for functionally distributed ICT development using regional networking in Mega Manila area. Use of ICT Tools for Effective and Accountable Government Administration
5.11 While computerization of private sector progressed in a stride, the computerization of local governments lagged behind due to lack of budget, human resources, etc. It is thus important for the local governments in Mega Manila to create an e-Government for “improving decision making process”, “increasing business efficiency” and “improving their services”. For this to be effective, a comprehensive ICT development master plan on the local government level is required.
Need to Share Essential Information on Investment Promotion
5.12 The improvement of accessibility to the information about the investment environment, required procedure, potential location, etc. is also one of the most effective promotion assets of investment as the Department of Trade and Industry (DTI), Philippine Economic Zone Authority (PEZA), and Japan Economic Trade Organization (JETRO) have been making a continuous effort. It is observed that many of Japanese companies trying to find out potential business partners are in need of other Japanese companies operating in the Philippines for subcontracts and parts supply.
Proposed Projects for ODA Funding
5.13 This mission proposes a comprehensive program approach for the solution of the above development issues, under a title, “Regional Development with the ICT Economic Corridor Approach in Mega Manila”, encompassing three components as below;
• Component 1: Regional Development with ICT Economic Corridor in Mega Manila
• Component 2: Development study for the upgrading of local government administration by ICT • Component 3: The Enterprise Data-Base and Reference System for Japanese Firms Skills Inventory These components are inter-woven with each other, and should be thus implemented with an overall coordination under a program approach concept.
Component 1: Regional Development with ICT Economic Corridor in Mega Manila
5.14 The objectives of the proposed Comprehensive Regional Development Plan for Mega Manila ICT Corridor Project will be the following:
• To formulate a comprehensive framework plan for the Mega Manila ICT Corridor, focusing on enhanced ICT connectivity, effective infrastructure network and usage and maximum use of local resources
• To assist selected municipalities with potential for regional cities in preparing urban plans and ICT enhancement strategies for balanced growth
• To conduct a feasibility study for the selected priority projects with urgency and value to the ICT Corridor of the Mega Manila
• To facilitate capacity building of central and local government staff in implanting the regional and municipal plans
Component 2: Development study for the upgrading of local government administration by ICT
5.15 The objectives of the proposed master plan study are to formulate a comprehensive ICT development plan aimed at upgrading Central Luzon administration and reinforcing administration functions through increased ICT utilization. The following outputs are expected form the study:
• Establishment of computerization achievement targets • Selection of information for computerization
• Identification of target organizations
• Preparation of roles and responsibilities of concerned organizations
• Preparation of system development plan for network system, data sharing system, ICT applications • Execution and evaluation of a pilot project
• Preparation of an operation and maintenance structure
• Cost estimates and identification of potential financing schemes
• Preparation of an institutional capacity building plan and human resource development plan
Component 3: The Enterprise Data-Base and Reference System for Japanese Firms Skills Inventory
5.16 The objective of the technical assistance is to establish the data-base of Japanese enterprise operating in the Philippines so that the business activities in the Philippines and foreign direct investment can be promoted. It is intended to improve the coordination among the private entities and develop the communication tool for the investors. The Study includes also the capacity building in updating, maintenance and publicity of the data-base. As a pilot scheme, the electronics and automobile related firms, and those located in the Mega Manila area are selected for the Study.
Abbreviations
Abbreviation Description
ADSL Asymmetric Digital Subscriber Line
ARMM Autonomous Region in Muslim Mindanao
ATO Air Transportation Office
BCDA Base Conversion Development Authority
BOI Board of Investment
BTP Basic Telephone Program
CALABARSON Cavite, Laguna, Batangas, Rizal and Queson provinces
CDC Clark Development Corporation
DOTC Department of Transportation and Communications
DPWH Department of Public Works and Highways
DSL Digital Subscriber Line
DTI Department of Trade and Industry
E.O Executive Order
ECFA Engineering and Consulting Firms Association, Japan
EPZA Export Processing Zone Authority
FS Feasibility Study
GDP Gross Domestic Product
GIS Geographic Information System
GISP Government Information System Plan
GOP Government of the Philippines
ICT Information and Communication Technology
ISPs Internet Service Providers
IT Information Technology
IT21 National Information Technology Plan for 21st Century
ITU International Telecommunication Union
JBIC Japan Bank for International Cooperation
JCCI Japan Chamber of Commerce and Industry
JETRO Japan Economic Trade Organization
JICA Japan International Cooperation Agency
LRT Light Rail Transit
LRTA Light Rail Transit Authority
MICT Manila International Container Terminal
MM Metro Manila
MMUEN Metro Manila Urban Expressway Network
MRT Metro Rail Transit
MRTA Metro Rail Transit Authority
NAIA Ninoi Aquino International Airport
NCR National Capital Area in the Metro Manila
NEDA National Economic Development Authority
NTC National Telecommunications Committee
ODA Official Development Assistance
ODRE Ownership of Dwelling and Real Estate
PC personal computer
PEZA the Philippine Economic Zone Authority
PLDT Philippine Long Distance Telephone Company
PNR Philippine National Railways
PSIS Public Service Information System
RP the Republic of the Philippines
S/W Scope of Works
SARS Severe Acute Respiratory Syndrome
Abbreviation Description
SBMA Subic Bay Metropolitan Authority
SEC Securities and Exchange Commission
SMS Short Message Service
① Olongapo Town – most of the cities are less than 200,000 population ② Olongapo Town ③ Clark Economic Zone ④ Gate to Clark Economic Zone ⑤ Eastwood Cybercity ⑥ Twin Towers in Eastwood Cybercity ⑦ University of the Philippines in Quezon City ⑧ IT Mall in Ortegas ⑨ Cyberzone in an Ortegas Mall
⑩ Internet Café in IT Mall ⑪ Telephone lines in
Burgos Street ⑫ Offices building in
Makaty City
⑬ Computers in IT Mall ⑭ Bataan Economic Zone ⑮ Subic Free Port Zone ⑯ Office of Subic Free
Port Zone
Present Conditions of the Study Area
①
②
③
④
⑤
⑥
⑧
⑩
⑬
⑭
⑮
⑦
⑪
⑫
⑯
⑨
CHAPTER 1 INTRODUCTION
1-1 Background
The Metro Manila area which houses the national capital of the Republic of the Philippines (hereafter “RP”) serves as the political, as well as the economic and financial center of the nation. The Metro Manila area shelters approximately 10 million residents, and the public investments have centered in this area.
The National Capital Area in the Metro Manila (hereafter NCR), on the other hand, suffers from chronic congestion due to heavy accumulation of the population and economic activities, limiting the Metro Manila’s capacity for future development severely and causing surging land prices and difficulty in commuting. These issues accrue apparently from the excessive accumulation of population to the Metro Manila areas, which has become one of the most important policy issues in the Philippines latterly.
The Government of RP recently emphasized on decentralizing the economic functions from MM to the surrounding areas, including the Central Luzon Region and the CALABARSON (Cavite, Laguna, Batangus, Rizal and Queson provinces) area, denoted as a whole as the Mega Manila. The Mega Manila commands an area within approximately 100 km of radius from NCR, and accessible within 2 hours if effective road networks were provided.
In the Ten-Point Agenda of the President in her inaugural speech on June 30th, 2004, the President stressed the need for de-congestion of the Metro Manila, stressing that the Subic-Clark corridor will be the most competitive international service and logistics center in the southeast Asia (Point 8). She also emphasized the necessity for providing the network of transport and digital infrastructures within the entire nation (Point 6).
It is thus envisioned that an overall master plan for regional development of the Mega Manila region needs to be formulated by promoting linkages of the existing urban centers within the region, as well as capitalizing on the enhanced information communication technology (ICT) network for better communication and coordination amongst the development stakeholders in the region.
In respect of the above, the Engineering Consulting Firms Association of Japan, under the Ministry of Economy, Trade and Industries of Japan, decided to send a mission for Mega Manila Economic and ICT Corridor Development under the Regional Development through Better Linkage Program. The mission consists of the following consultants, and dispatched to RP from 28th July through 12th August, 2004.
• Koji Yamada, Team Leader/ Regional Planner, Nippon Koei Head Office • Katsumi Fujii, ICT Expert, Nippon Koei Head Office
• Masato Kamiya, Socio-Economic Expert, Nippon Koei Manila Office.
1-2 The Study Area
The Study Area consists of NCR, the Central Luzon Region (NEDA Region III), and CALABARSON region (NEDA Region IVa), and encompasses an area of 41,000 km2 and houses a population of 27 million. The population breaks down into approximately 10 million for NCR, 9 million for Region III and 8 million in Region IVa.
1-3 The Objectives of the Mission
The objectives of the Mission is the following;
• To conduct a site survey and carry out extensive hearing sessions with concerned parties to grasp the issues of regional development in the Mega Manila Region
• To envision the direction of development in the Mega Manila region
• To prepare scope of works for technical assistance by ODA programs of Japan that are suitable for immediate implementation
1-4 Scope of Work of the Mission
The following is the outline of the scope of the Mission • Analysis on the Present Conditions
The Mission will analyze the statistical data and existing research outputs and documents and summarize the present conditions of the Mega Manila region from various aspects • Site Surveys
The Mission will visit the concerned sites and places of importance in envisioning the
development direction of the Mega Mania, including the economic zones in Subic, Clark and Laguna/Cavite
• Clarification of the Development Issues
Through the analysis of documents and hearings from concerned stakeholders in the public and private sectors, the development issues in the Mega Manila region will be clarified. • Formulation of S/W for Key Technical Assistance Projects
The Mission will formulate scope of works for key technical assistance projects to be promoted for ODA programs in RP. Attention will be paid to capitalize on the experiences in Japan.
• Proposal for Implementation Arrangement
The Mission will make proposals for implementation arrangement of the above-mentioned key projects.
CHAPTER 2 PRESENT CONDITIONS OF THE STUDY AREA
2-1 Demography
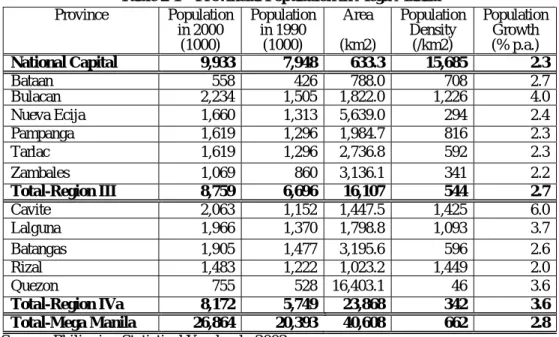
The Mega Manila encompasses an area of 40,000 kim2 in total, consisting of the NCR, NEDA Region III and IVa. The total population of the Mega Manila is 27 million, of which 10 million is in NCR, 9 million in Region III and 8 million in Region IVa, as shown in Table 2-1.
The population of the Mega Manila grew at an annual rate of 2.8% over the decade between 1990 and 2000, of which the Region IVa has the highest annual growth rate of 3.6%, showing rapid economic growth in this area in the decade.
The population density has a wide difference within the Mega Manila; in NCR the population density in 2000 is more than 15,000, indicating that the area is heavily built-up, whereas in the areas outside of NCR, the population density is less than 1,000. It should be noted that the population of NCR is more than 15 times higher than the areas outside of NCR, showing heavy concentration of population, and thereby of the economic activities in general, into the NCR area.
Table 2-1 Provincial Population in Mega Manila
Province Population in 2000 (1000) Population in 1990 (1000) Area (km2) Population Density (/km2) Population Growth (% p.a.) National Capital 9,933 7,948 633.3 15,685 2.3 Bataan 558 426 788.0 708 2.7 Bulacan 2,234 1,505 1,822.0 1,226 4.0 Nueva Ecija 1,660 1,313 5,639.0 294 2.4 Pampanga 1,619 1,296 1,984.7 816 2.3 Tarlac 1,619 1,296 2,736.8 592 2.3 Zambales 1,069 860 3,136.1 341 2.2 Total-Region III 8,759 6,696 16,107 544 2.7 Cavite 2,063 1,152 1,447.5 1,425 6.0 Lalguna 1,966 1,370 1,798.8 1,093 3.7 Batangas 1,905 1,477 3,195.6 596 2.6 Rizal 1,483 1,222 1,023.2 1,449 2.0 Quezon 755 528 16,403.1 46 3.6 Total-Region IVa 8,172 5,749 23,868 342 3.6 Total-Mega Manila 26,864 20,393 40,608 662 2.8
Source: Philippine Statistical Yearbook, 2003
2-2 Socio-Economy
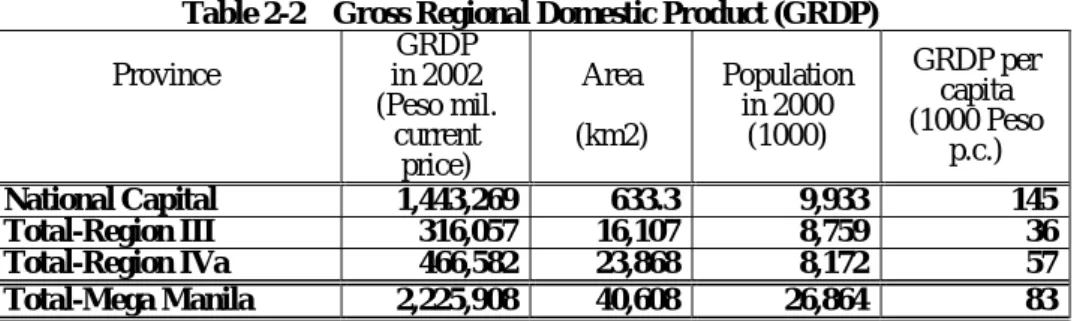
Similarly as in other developing counties, the Philippines has been facing the problem of the congestion in the metropolitan city. The Metro Manila is historically the center of population, economical and political activities in the Philippine. Economic activities have been concentrated in the NCR i.e. Metro Manila that accounted for 31 percent of gross domestic product (GDP) in 2002. Its two adjoining regions, Region III and IV have the next large share of GDP. The percentages of GDP in those regions are 9 % and 16 % respectively. Since the Region III and IV (IV-a) are included in the Mega Manila area, the Mega Manila has about 50% share of GDP in the whole Philippines.
The Region III located in the north of the Metro Manila has a big potential of granary product and further regional development owing to the special economic zones established on the former US bases in Subic and Clark. The Region IV-a, or CALABARZON, located in the south of Metro Manila has been enjoying rapid economic growth since 1994 with the outstanding development with a number of industrial estates where a number of foreign manufacturers are located.
Table 2-2 Gross Regional Domestic Product (GRDP) Province GRDP in 2002 (Peso mil. current price) Area (km2) Population in 2000 (1000) GRDP per capita (1000 Peso p.c.) National Capital 1,443,269 633.3 9,933 145 Total-Region III 316,057 16,107 8,759 36 Total-Region IVa 466,582 23,868 8,172 57 Total-Mega Manila 2,225,908 40,608 26,864 83 Source: Philippine Statistical Yearbook, 2003 for NCR and Region III
Data for Region IVa are given by NEDA Region IV Office 2-3 Industrial Estates and Economic Zones
Since early 1990’s, the Government of the Philippines has been trying to improve the economy by promoting foreign direct investment. In 1995, the Philippine Economic Zone Authority (PEZA) was established on the former Export Processing Zone Authority (EPZA),for the promotion of establishing world-class economic zones all over the country so as to respond to demands for ready-to-occupy locations for foreign investments. The PEZA’s role is not limited to supervise the administrative requirement for the industrial estates developed by the Government and locators but also to supervise the operation of private industrial estates by granting them economic zone status. PEZA formulated separate incentive schemes for developers / operators and locators such as th income tax holiday, an option to pay 5 percent gross income tax, in lieu of all national and local taxes, a permanent resident status for foreign investors, etc. Those schemes encouraged a number of foreign investors including many Japanese private companies operating in the manufacturing and electronics to come into the Philippines. This caused a boom of foreign direct investment in the Philippines.
Back in the late 1960’s, four government-owned economic zones in Baguio, Bataan, Cavite and Mactan were developed. These four estates are owned and operated by PEZA. In the early 1990’s, with the new government strategy mentioned above, twelve private-owned industrial estates or special economic zones began to take shape. Now more than 60 industrial estates (registered by PEZA) have become investment powerhouses brought in by estate developers and locators. Industrial estates are spread all over the country cover more than 20,000 hectares of land, of which some 7,000 hectares are occupied, where more than 900,000 employees are working. Currently more than 900 firms registered by PEZA are operating in 65 economic zones, of which approximately 750 firms are located in Mega Manila area i.e. Metro Manila, Region III and Region IV-a (CALABARZON). Separately in total 76 IT parks are registered by PEZA, of which 73 IT Parks are located in Mega Manila.
Table 2-3 Economic Zones in Mega Manila
Economic Zone Operating
Firms Area
Share in the Country
Public Economic Zones 466
Baguio City Economic Zone 12 CAR 3%
Bataan Economic Zone 61 Region III 13%
Cavite Economic Zone 286 Region IV-a 61%
Mactan Economic Zone 107 Region VII 23%
Private Economic Zones 460
Zones in Mega Manila 405 Mega Manila 88%
Zones in other area 55 others 12%
IT Parks 76
Parks in Mega Manila 73 Mega Manila 96%
Parks in other area 3 others 4%
Source: PEZA
Conceived in the early 1990’s, CALABARZON was a strategy for a sustainable development and it was planned as a model as the first regional industrial center in the country. While Metro Manila was the central business district of the Philippines that was too congested for manufacturing activities, CALABARZON was planned to accommodate the outflow of economic activities from Metro Manila. Since the airports and seaports are still concentrated in Manila, CALABARZON offers target markets with convenience in terms of travel time to and from international gateways. Presently, there are 15 planned and operating economic zones in CALABARZON. Cavite and Laguna are hosts to more than one half of the listed industrial estates in the island of Luzon. In the central Luzon area, or NEDA’s Region III, after the pullout of the American military installations, the Subic and Clark area have become widely noticed as the potential regional development areas helping the decongestion of Mega Manila. The special economic zones in the area were created under the Base Conversion Development Authority (BCDA). Presently, Subic Bay Metropolitan Authority (SBMA) and Clark Development Corporation (CDC) are playing the roles of developing the former US Military Bases in Subic and Clark respectively. Since there are a world class seaport in Subic and an airport in Clark, the investment has rapidly expanded. In Subic, the cumulative investment increased from US$1.9 billion in 1995 to US$4.2 billion in 2003. In Clark more than 300 locators including Japanese are currently in operation.
It is expected that the commodity distribution which is presently concentrated in Metro Manila will be shifted to Subic and Clark areas after the ongoing major infrastructure development projects; Subic Port Development Project and Subic – Clark – Tarlac Expressway Construction Project both funded by Japan Bank for International Cooperation (JBIC) to be completed in the next 3 to 4 years.
2-4 Urban Centers
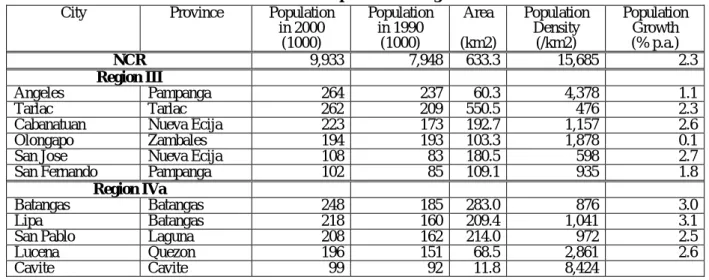
The largest urban center in the Mega Manila is naturally the Metro Manila, which consists of 17 urban centers. In Region III, the largest of the existing urban centers are Angeles in Pampanga Province and Tarlac in Tarlac Province, both having a population exceeding 260,000. In Region IVa, the largest urban center is Batangus with its population growing rapidly to reach 250,000. It is noted that the size of the urban centers in the Mega Manila regions are generally in the range not exceeding 300,000. Compared with the urban centers in the Metro Manila, ranging from 500,000 through 1,000,000 or more, the size of the cities in Regions III and IVa are generally small, and the ratio of urban population in these regions is not more than 15%, which shows slow urbanization in these areas.
Urban planning is basically the responsibility of respective municipalities, although the capacity of the municipalities is generally not sufficient to formulate a comprehensive urban plans for their jurisdiction. NEDA sometimes assists municipalities to prepare urban plans, though this assistance is no widespread due to limited funding.
Table 2-4 Urban Population in Mega Manila
City Province Population in 2000 (1000) Population in 1990 (1000) Area (km2) Population Density (/km2) Population Growth (% p.a.) NCR 9,933 7,948 633.3 15,685 2.3 Region III Angeles Pampanga 264 237 60.3 4,378 1.1 Tarlac Tarlac 262 209 550.5 476 2.3
Cabanatuan Nueva Ecija 223 173 192.7 1,157 2.6
Olongapo Zambales 194 193 103.3 1,878 0.1
San Jose Nueva Ecija 108 83 180.5 598 2.7
San Fernando Pampanga 102 85 109.1 935 1.8
Region IVa
Batangas Batangas 248 185 283.0 876 3.0
Lipa Batangas 218 160 209.4 1,041 3.1
San Pablo Laguna 208 162 214.0 972 2.5
Lucena Quezon 196 151 68.5 2,861 2.6
Cavite Cavite 99 92 11.8 8,424
2-5 Transport Network
2-5.1 Road
The rapid economic growth and urbanization in Metro Manila has resulted in growing demand for motorization. The increase in the number of motor vehicles led to the persistent traffic congestion, deterioration of urban environment and aggravated the service level of the metropolitan public transportation systems. Metro Manila is traversed by two circumferential road network and eight radial roads. The two circumferential road links, however, can hardly cope with the increasing traffic and commodity flows that are still concentrated in Metro Mania, and those circumferential roads are not completely functional as a ring road due to the undeveloped connection. Presently the improvement of yet another circumferential road, i.e. C5, is under way partially with the financial assistance of Japan, but this is also incomplete as a ring road. Since the Metro Manila faces a bay in the west and a mountainous area is in the east, the destination of development must have a direction of North and South. Hence the road network in Metro Manila needs to have good linkage with the road network with the neighboring regions especially with the Region III in the north and the Region IV-a in the south. In 2003, the Department of Public Works and Highways (DPWH) has completed a study on developing a Metro Manila Urban Expressway Network (MMUEN) that proposed to construct new expressways to improve the road network of Metro Manila and neighboring regions. The plan includes the construction of the Metro Manila Skyway that would connect the South Luzon Expressway and the North Luzon Expressway, improvement of C5
Expressway, extension of the Menila-Cavite Expressway.
In region III, as was mentioned earlier, the Subic-Clark-Tarlac Expressway project is currently underway with the financial assistance of JBIC. This project is aiming at connecting Subic and Clark by a 94.5 km expressway running from Subic Bay all the way up to the 6,400 ha Hacienda Luisita in Tarlac. This is also aiming at supporting Clark to be linked to a modern container port in Subic and to the North Luzon Expressway in order to make Clark an engine of growth in Region III. The upgrading of the North Luzon Expressway which is a current major transport artery traversing the Region III and connecting the Region III and Metro Manila, the extension of Subic-Clark-Tarlac Expressway to further north and further east from Tarlac are planned to enhance the integrity of the road network in the region.
In CALABARZON (Region IV-a), one of the most important issues is the weakness of road network. This weakness hinders the linkage between the Batangas Port, Manila International Airport (NAIA), Manila International Cargo Terminal/Port and the region’s industrial estates. The South Luzon Expressway, or sometimes called the South Super Highway, is the main artery that connects Metro Manila with CALABARZON. The highway starts in Manila's Paco district and ends in Calamba City in the province of Laguna, some fifty kilometers south of Manila. Over the years, the areas surrounding the South Luzon Expressway, particularly south of Metro Manila and the areas within Laguna province, have seen massive industrialization and urbanization, especially with the influx of local and foreign investment into the area and the migration of people from different parts of the Philippines.
The extension of the South Luzon Expressway from Calamba to Sto. Tomas is currently under construction and it is said that this will be completed in two years. However, the Calamba-Sto. Tomas segment is just a portion of an entire logistic corridor in CALABARZON and that segment will not deliver its full function unless the construction of the segment Lipa - Batangas City, where the modern sea port is under improvement with the financial assistance of Japanese Government.
2-5.2 Rail
The railway systems that pass through the Mega Manila are operated by the Philippine National Railways (PNR), the Light Railway Transit Authority (LRTA) and the Metro Rail Transit Authority (MRTA).
PNR has two existing lines traversing Mega Manila area i.e. Main Line North from Manila to San Fernando in La Union with 266.02 km and Main Line South from Manila to Legaspi City with 478.70 km and the branch lines of 485.42 km. However, the Line North is no longer operational and the Line South is partially operational with only four or five trips daily. The operational ratio of existing line is approximately 30%. The rehabilitation of those lines has been under consideration but has not yet been materialized. It is said that the rehabilitation of the Manila – Calamba line (part of Main Line South) will be financed by the South Korean Government and in March 2002, PNR signed a Memorandum of Understanding for the latter to prepare a feasibility Study for the proposed PNR South Rail Commuter Project which would cover the rehabilitation/strengthening of the tracks from Caloocan City whis is located near the Manila International Cargo Terminal/Port, to Calamba in Laguna. Also it is said that the railway line connecting Metro Manila to Clark, namely North Rail, will be implemented soon. The loan agreement between the Export – Import Bank of China and the Department of Finance was signed in February 2004 for the construction of North Rail Project Phase 1 Section 1 (Caloocan – Malolos).
There are three light rail systems operating in Metro Manila; the Light Rail Transit (LRT) Line-1, LRT Line-2 and the Metro Rail Transit (MRT) Line-3. LRT Line-1 runs from north to south of Metro Manila (Monumento in Calaoocan City to Pasay City) for 14.5 km, LRT Line-2 runs from Quezon City to Pacig City for 4.3 km, although this is still partially operational while the remaining construction work for 9.5 km is still on-going, and MRT Line-3 runs from the North Avenue in Queszon City to Taft in Pasay City for 16.7 km. Those passengers lines ,however, are not
efficiently connected and inter-modal integration (LRT stations and expressway entries/exits, etc.) is inadequate and hence they do not fully contribute to the improvement of traffic conditions in Metro Manila. The extensions of LRT and MRT lines have been planned but not yet been materialized.
Passenger by Railway Cargo Traffic by Railway
Figure 2-1 Railway Statistics
(Source: JICA Study) 2-5.3 Maritime Transport
Embraced by the Manila Bay, Manila has access to several destinations making water transport a reliable alternative. The port area of Manila activates the city as well as trade today as it was during the Spanish era. The port of Manila at the mouth of the Manila Bay is composed of two harbors and one container terminal. The South Harbor having five piers with berths covering about 4,241 m in length accommodates international cargo vessels, while the North Harbor has eight piers and three wharves comprising of 43 berths covering about 6,135.01 in length. The progress of containerization paved the way for the development of the Manila International Container Terminal (MICT) which is considered as one entire wharf with four usable berths with one alternately converted as roro and spanning some 840 meters in length.
The above mentioned South Harbor, North Harbor and MICT handled 41 million tons of sea borne cargo in 2001 which accounted for about 30 percent of total cargo volume in the Philippines. Whilst this function has to be concentrated into one specific area especially in order to facilitate the scale of economy,, the negative externality of the concentration of land transportation in Manila has been notable; namely, the traffic congestion in Manila has reached a serious level.
The Batangas Port, now being utilized by locators in the CALABARZON is seen to be beneficial in streaming logistic requirements of export industry, as well as in easing the chronic congestion in major roads leading to the Manila Port. The expansion work is underway with the financial assistance of Japanese Government.
The Subic Port has currently been utilized mainly for the domestic cargo with a gantry crane in place. It is expected that the port can be a substitute for the Manila South Harbor in 10 years time as the principal port of entry into Matro Manila and Region III and as a regional transshipment port. The expansion works that have been financially supported by Japanese Government will be completed by 2007. Passenger by Railway (Thousand) 0 1,000 2,000 3,000 4,000 5,000 6,000 7,000 8,000 9,000 19 81 19 82 19 83 19 84 19 85 19 86 19 87 19 88 19 89 19 90 19 91 19 92 19 93 19 94 19 95 19 96 19 97 19 98 19 99 20 00 20 01 MMR PNR
Cargo Traffic by Railways (ton) 0 20,000 40,000 60,000 80,000 100,000 120,000 140,000 160,000 1981 1982 1983 1984 1985 1986 1987 1988 1989 1990 1991 1992 1993 1994 1995 1996 1997 1998 1999 200 0 200 1 Cargo Volume
Figure 2-2 Foreign Cargo Statistics
(Source: JICA Study) 2-5.4 Air Transport
The airport sector is managed, operated, and regulated by the Air Transportation Office (ATO) under the Department of Transportation and Communications (DOTC). There are eighty-five (85) public airports in the Philippines. Four (4) airports are designated as international airports (Ninoy Aquino Inter-national Airport, Subic, Clark, and Cebu) and four (4) others are designated as alternate international airports (Zamboanga, Davao, General Santos/Tambler, and Laoag). The airports in Clark and Subic are utilized mainly for private airfreight companies. The Clark airport which was initially planned to be a regional cargo hub and an alternate airport to NAIA needs to be developed as an international passenger gateway for Mega Manila supplementing or replacing NAIA.
Table 2-5 Air Transport Statistics
Source: ATO Fo r e i gn C o n t ai n e r i ze d C ar go by Re gi o n s (Un i t : t o n ) 0 2,000,000 4,000,000 6,000,000 8,000,000 10,000,000 12,000,000 14,000,000 N C R + 3+4A CA R Ilocos C ag ayan V al le y Ce n tr al L u zo n S o ut her n T ag al o g Bi c o l W e st e rn V is ayas C e n tr al V is ayas E as te rn V is ayas W e st er n M ind an ao N o rt her n M ind an ao S o ut her n M ind an ao C ent ra l M ind an ao Ca ra ga AR M M 1991 2001 Air Passenger 1995 1996 1997 1998 1999 2000 2001 2002
1 Ninoy Aquino International airport (NAIA) 4,308,874 4,986,164 6,155,189 5,369,908 5,490,735 5,538,320 5,474,450 5,521,601 2 Mactan-Cebu International Airport (MCIA 1,841,904 2,047,566 2,330,431 1,761,530 1,895,077 1,699,378 1,710,943 1,597,524 3 Iloilo Airport 466,423 583,910 693,775 615,577 642,541 379,745 639,512 677,075 4 Cagayan de Oro Airport 349,947 353,902 510,519 835,797 439,706 357,534 404,906 467,877 5 Bacolod Airport 371,955 419,951 538,950 370,365 536,201 450,884 537,809 514,013 6 Zamboangan International Airport 319,165 355,594 422,491 252,994 292,221 285,206 270,138 296,191 7 Tacloban Airport 265,995 235,949 303,763 318,189 339,701 309,152 299,295 303,730 8 Davao International Airport 640,000 860,000 1,010,000 780,000 926,989 739,316 937,751 961,990 9 General Santos International Airport 76,721 100,893 127,487 322,702 206,210 585,629 148,204 129,445 10 Kalibo Airport 207,442 250,943 259,638 211,327 247,100 177,138 238,123 253,563 100 Others 1,595,036 1,533,564 1,825,302 1,269,468 1,230,721 1,071,443 1,313,318 1,294,408 Total 10,443,462 11,728,436 14,177,545 12,107,857 12,247,202 11,593,745 11,974,449 12,017,417
Air Cargo 1995 1996 1997 1998 1999 2000 2001 2002
1 Ninoy Aquino International airport (NAIA) 79,743 101,020 101,339 85,975 221,054 120,398 121,130 121,862 2 Mactan-Cebu International Airport (MCIA 23,151 27,919 68,151 26,476 34,144 34,685 39,407 44,380
3 Iloilo Airport 0 38,507 40,636 24,344 26,434 29,522 21,211 31,277
4 Cagayan de Oro Airport 8,206 9,094 11,748 6,913 8,771 9,480 7,834 9,515
5 Bacolod Airport 7,582 6,506 6,786 5,539 5,709 7,262 6,091 7,161
6 Zamboangan International Airport 4,772 4,286 11,159 4,811 6,699 6,434 8,708 8,890 8 Davao International Airport 827 1,956 4,164 6,272 7,278 8,929 6,713 6,467 9 General Santos International Airport 4,022 4,618 5,181 3,883 4,062 6,239 5,872 6,210 12 Puerto Princesa Airport 2,322 3,724 3,585 2,545 4,173 4,810 3,886 3,796
13 Roxas Airport 3,910 2,865 3,250 2,106 3,480 3,837 3,637 2,997
100 Others 15,966 14,460 19,080 11,990 11,974 14,063 N.A N.A
2-6 Industries
Despite the negative effects of SARS and the Iraq war, the Philippine economy sustained its resiliency with the Gross Domestic Product (GRDP) growing 4.7 percent in 2003 compared with 4.3 percent in 2002. The Service sector, which accounted for 46.7 percent of the total economy, recorded an accelerated growth of 5.8 percent in 2003 from a 5.1 percent increase in 2002. Also the Industry sector growth inched up to 3.8 percent from a 3.6 percent in 2002 and had a 33.5 percent share to the total GDP. Meanwhile, the aggregate agriculture, fishery and forestry, which comprised 19.9 percent of the economy, sustained its 3.8 percent growth in 2002.
NCR, which accounted for the biggest share in the GDP growth, recorded output gains in both the industry and service sectors. The construction sector in NCR picked up from a negative 32.5 percent to 7.8 percent and the accelerated performance in the manufacturing boosted the performance of the industry sector. The substantial gains in Trade, Finance, Ownership of Dwellings and Real Estate (ODRE) and Government Services were enough to offset the deceleration in the outputs of the other sub-sectors such as electricity and water, transport communication and storage and private services.
In CALABARZON, the industry sector contributed the highest to the GDP at an average of 43.2 percent. The significant contribution of the sector was mainly due to the increase in manufacturing, construction and electricity, gas and water sub-sectors. The manufacturing industry in CALABARZON accounts for almost one-third of the overall regional economy and contributed and average of 19 to 20 percent to national output in manufacturing sector.
Region III is dominantly agriculture-based area also called the Rice Granary of the Philippines, delivering one third of the country’s total rice production. It is expected, however, that the region will develop industry and service sectors capitalizing on the well-facilitated transportation infrastructure such as expressway, seaport and airport and economic zones in the Area.
2-7 ICT Network
2-7.1 ICT Operators
The telecommunication business in the Philippines was started by the private telecommunications operator during regnum of the U.S. The Manila telephone company was founded in 1905, and the name was changed to Philippine Long Distance Telephone Company (PLDT) in 1928. Since then, telecommunication business has been managed on a private sector initiative. The above liberalized service environment of telecommunications has so far resulted in the 11 international gateway operators, 7 cellular mobile telephone operators and 19 fixed line operators nationwide.
Table 2-6 Telecommunications Industry Structure
Telecommunications service operators 1999 2000 2001 2002
Local exchange operators 76 77 74 74
Inter-exchange operators 12 12 14 14
International gateway facility operators 11 11 11 11
Cellular Mobile telephone operators 5 5 7 7
Radio paging operators 15 11 11 11
Value-added service operators - With network - Without network 22 106 30 156 31 186 32 159 Satellite operators 18 18 19 19
Source: 2002 NTC annual report 2.7-2 ICT Network
The subscribers as of 2002 of fixed line telephone, mobile telephone, and the Internet are 3.3 million, 15.4 million, and 0.8 million respectively.
Table 2-7 Outline of Telecommunications Subscription
Service 2000 2001 2002 Growth rate
(2000-2002) Density* 4.01 4.26 4.17 4% Fixed telephone Subscribers 3,083,618 3,318,463 3,314,161 7% Density* 8.46 15.61 19.36 129% Mobile telephone Subscribers 6,505,587 12,159,908 15,386,606 137% Density* 0.52 0.64 1.01 94% Internet
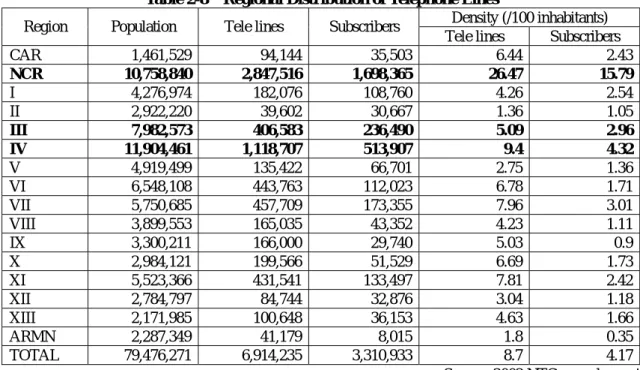
(dial-up account) Subscribers 400,000 500,000 800,000 100% *: per 100 inhabitants Source: NTC data The following table shows the regional distribution of telephone lines in the Philippines. It is clearly seen that the availability of telephone lines in areas outside of NCR is much lower than in NCR, showing a considerable imbalance of telephone lines in the nation.
Table 2-8 Regional Distribution of Telephone Lines
Density (/100 inhabitants) Region Population Tele lines Subscribers
Tele lines Subscribers
CAR 1,461,529 94,144 35,503 6.44 2.43 NCR 10,758,840 2,847,516 1,698,365 26.47 15.79 I 4,276,974 182,076 108,760 4.26 2.54 II 2,922,220 39,602 30,667 1.36 1.05 III 7,982,573 406,583 236,490 5.09 2.96 IV 11,904,461 1,118,707 513,907 9.4 4.32 V 4,919,499 135,422 66,701 2.75 1.36 VI 6,548,108 443,763 112,023 6.78 1.71 VII 5,750,685 457,709 173,355 7.96 3.01 VIII 3,899,553 165,035 43,352 4.23 1.11 IX 3,300,211 166,000 29,740 5.03 0.9 X 2,984,121 199,566 51,529 6.69 1.73 XI 5,523,366 431,541 133,497 7.81 2.42 XII 2,784,797 84,744 32,876 3.04 1.18 XIII 2,171,985 100,648 36,153 4.63 1.66 ARMN 2,287,349 41,179 8,015 1.8 0.35 TOTAL 79,476,271 6,914,235 3,310,933 8.7 4.17
Source: 2002 NTC annual report In order to increase the number of fixed line telephone connections, the “Service Area Scheme (SAS)” under the “Basic Telephone Program (BTP)” was introduced in an executive order (E.O) No. 109 in July 1993. This scheme requires new mobile telephone service licensees to install 400,000 local exchange lines and 300,000 local exchange lines to new international gateway service operators. As a result, the fixed line telephone density as of 2002 exceeded 4% from the level of 1% before enforcement of SAS. However, the activity ratio of the facilities has only been 44%.
The growth rate of respective services for the three years from 2000 to 2003 was 7% for fixed line telephone, 137% for mobile telephone and 100% for internet users. While the number of subscribers to fixed line telephones is relatively stable, the number of subscribers to mobile phones is continuing to increase rapidly. Since GLOBE and SMAT started their prepaid card mobile phone services with a Short Message Service (SMS) function in 1999, the number of subscribers has increased dramatically.
Table 2-8 shows National Telecommunication Committee (NTC) data for the number of account
paying subscribers to Internet Service Providers (ISPs) from 1996 to 2003. The dialup user and Digital Subscriber Line (DSL) user in 2002 are estimated to be 675,000 users and 125,000 users, respectively. The number of Internet users is not indicated accurately due to following reasons:
9 NTC does not collect statistics for all ISPs
9 Ddifficult to measure the number of users of Internet Cafés and prepaid services
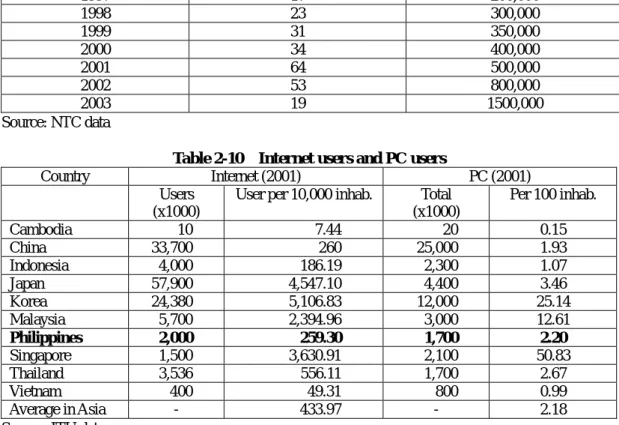
According to the statistics of International Telecommunication Union (ITU), the number of internet users in the Philippines in 2001 was estimated to be 2 million. The internet user density is very low, with only 259 users per 10,000 people compared to an average of 434 users per 10,000 people for the whole Asia. The reasons why the Internet density is so low is presumed to be because of the high cost of personal computers (PCs) (density: 2.2%), and a low density of fixed telephone lines (density: 4.17%). The results of a Philippine survey in June 2000 showed that the rate of utilization of internet was 30% at Internet Cafés, 26% in the academic sector, 24% in the business sector and 19% for home users.
The government of the Philippines aims to development the Information and Communication Technology (ICT) oriented business for the further economic development through the utilization of internet as a daily communication tool. However, most of the home users of personal computer are at present unfamiliar with the internet, which most uses of the internet are the
business sector. Promotion of the internet utilization at home is thus required.
Table 2-9 ISP Subscription
Year Registered ISP Subscribers
(Paying accounts) 1996 24 100,000 1997 17 200,000 1998 23 300,000 1999 31 350,000 2000 34 400,000 2001 64 500,000 2002 53 800,000 2003 19 1500,000 Source: NTC data
Table 2-10 Internet users and PC users
Country Internet (2001) PC (2001)
Users (x1000)
User per 10,000 inhab. Total (x1000) Per 100 inhab. Cambodia 10 7.44 20 0.15 China 33,700 260 25,000 1.93 Indonesia 4,000 186.19 2,300 1.07 Japan 57,900 4,547.10 4,400 3.46 Korea 24,380 5,106.83 12,000 25.14 Malaysia 5,700 2,394.96 3,000 12.61 Philippines 2,000 259.30 1,700 2.20 Singapore 1,500 3,630.91 2,100 50.83 Thailand 3,536 556.11 1,700 2.67 Vietnam 400 49.31 800 0.99 Average in Asia - 433.97 - 2.18
Source: ITU data
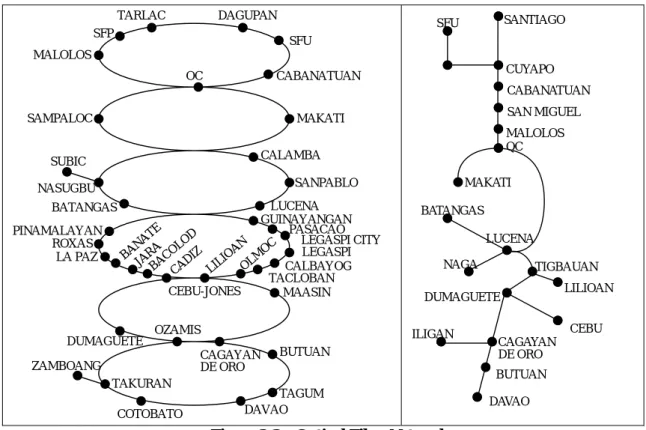
PLDT is operating a trunk line microwave communication network as well as a 10 Gbps optical fiber network. In 1999, Telicphil (Telecommunication Infrastructure Corporation of the Philippines), which is a consortium of 6 telecommunication operators, constructed a nation-wide 2.5 Gbps optical fiber network, as shown in Figure 2-4.
SANTIAGO CUYAPO CABANATUAN SAN MIGUEL MALOLOS QC MAKATI BATANGAS LUCENA TIGBAUAN LILIOAN CEBU DUMAGUETE NAGA CAGAYAN DE ORO ILIGAN DAVAO BUTUAN SFU TARLAC SFP MALOLOS DAGUPAN SFU CABANATUAN OC MAKATI SAMPALOC CALAMBA SANPABLO LUCENA BATANGAS NASUGBU SUBIC GUINAYANGAN PASACAO LEGASPI CITY LEGASPI CALBAYOG TACLOBAN OLM OC LILI OAN CAD IZ BACO LOD JARA BAN ATE LA PAZ ROXAS PINAMALAYAN MAASIN CAGAYAN DE ORO OZAMIS DUMAGUETE BUTUAN TAGUM DAVAO COTOBATO TAKURAN ZAMBOANG CEBU-JONES
Figure 2-3 Optical Fiber Network
2-7.3 Other ICT Services (1) Leased Line Services
Many of the companies are utilizing the leased line connections for their internet. Although the tariff of services varies by operators, the fee for the Manila operator is 300,000 pesos per month for a 100Mbps line.
(2) Dial-up Services
There are a number of ISPs in the Philippines and the fee structure varies. PLDT offers their dialup service at 0.25 pesos/minute during the daytime and 0.5 pesos/minute at night. Some operators offer unrestricted utilization at 3,000 pesos per month.
(3) ADSL・DSL
ADSL and DSL services are available in Manila and other principal cities. The ADSL service offered by PLDT is as follows.
Initial cost: 2,000 pesos Connection fee:
128kbps: 2,500 pesos/ month 256kbps: 3,000 pesos/month (4) Satellite
Since the satellite communication can be introduced at a comparatively low price, it is utilized in a number of educational institutions. Moreover, in local regions, it is also used at homes. The usage charge is 15,000 pesos/month for a 600Kbps connection.