1670
29 3 21
4 1
γ A
Peroxisome proliferator-activated receptor γ (PPARγ)
PPARγ 2 ob/ob [1] PPARγ PPARγ PPARγ fat-specific protein 27 (FSP27) 1 [2]
PPARγ ob/ob GeneChip
PPARγ liver PPARγ-dependent 3 (LPD3)
FSP27 LPD3 1) FSP27 FSP27-1a FSP27-1b mRNA 2) LPD3 LPD3 1) FSP27-1a FSP27-1b mRNA FSP27 1 2 (FSP27-1a FSP27-1b mRNA) [3] FSP27 [4]
FSP27
2
2
(Fasting) (Refeeding) FSP27-1a
FSP27-1b mRNA FSP27-1a FSP27-1b mRNA
( ) 7 53 (Fig. 1) mRNA mRNA FSP27-1a FSP27-1b mRNA 1 mRNA
(Fig. 2) FSP27-1a FSP27-1b mRNA
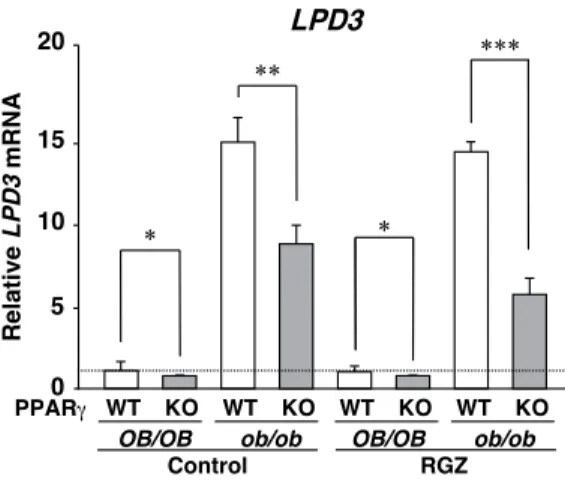
2) LPD3 LPD3 a) LPD3 LPD3 PPARγ LPD3 PPARγ PPARγ PCR (Control) PPARγ ob/ob (ob/ob-PPARγWT) LPD3 PPARγ
Fig. 1. FSP27 mRNAs in the liver are induced by fasting but decreased by refeeding.
Relative FSP27-1a mRNA 0 4 2 6 10 FSP27-1a
Control FastingRefeeding 8 * † 54 2 1 Relative FSP27-1b mRNA 0 53 55 Control Fasting Refeeding FSP27-1b ** ††
Figure 2. FSP27 mRNAs in the liver are induced by fasting but decreased by refeeding. QPCR analyses of FSP27 mRNAs in liver (A) and white adipose tissue (B) were performed using total RNA from each mouse. Expression was normalized to 36B4 mRNA, and each bar represents the average ± S.E.M. of 3 individual experiments. WAT, white adipose tissue; Control, ad libitum-fed mice; Fasting, 24 hr-fasted mice; Refeeding, relibitum-fed mice after 24 hr-fasting. Significant differences from Control: †p < 0.01,††p < 0.001. Significant differences from Fasting: *p < 0.01, **p < 0.001.
Fig. 2. Fasting-induced FSP27-1a and FSP27-1b mRNAs in liver are suppressed by insulin.
0 10 100 120 130(B) FSP27-1a 0 min 1 hr Control insulin inj. * Relative FSP27-1a mRNA 110 * 0 10 20 90 100 (C) FSP27-1b 0 min 1 hr Control insulin inj. ** Relative FSP27-1b mRNA 80 **
Figure 6. Fasting-inducedFSP27-1a and FSP27-1b mRNAs in liver are suppressed by insulin. QPCR analyses of FSP27 (A), FSP27-1a (B) and FSP27-1b (C) mRNAs were performed using liver total RNA from each mouse. Expression was normalized to 36B4 mRNA, and each bar represents the average ± S.E.M. of 3 individual experiments. 24 hr-fasted mice (Fasting/0 min) were sacrificed at 1 hr after intraperitoneal injection with insulin (8 munits/g of body weight) or glucose (5 mg/g of body weight). Control, ad libitum-fed mice. Significant differences from Fasting: *p < 0.01, **p < 0.001.
(OB/OB-PPARγWT) 10 PPARγ ob/ob (ob/ob-PPARγKO) LPD3 ob/ob-PPARγWT 50% (Fig. 3) PPARγ (RGZ) ob/ob-PPARγWT LPD3 ob/ob-PPARγWT (Fig. 3) LPD3 PPARγ ob/ob b) LPD3 ob/ob 5 LPD3 iodixanol LPD3 ob/ob-PPARγWT
peroxisomal biogenesis factor 14 (PEX14) LPD3
LPD3 (Fig. 4) ob/ob-PPARγKO LPD3 (Fig. 4) ob/ob-PPARγWT LPD3
Fig. 4. LPD3 protein is localized in the peroxisomal fraction of the RGZ-treated ob/ob mouse liver. LPD3
PEX14
PPARγ WT KO
Whole Peroxi Whole Peroxi
Figure 24. LPD3 protein is localized in the peroxisome fraction of the RGZ-treated ob/ob mouse liver, but not PPARγ null ob/ob mouse liver.
Peroxisome fraction was prepared as shown in Figure 23. The peroxisome fraction (Peroxi) was analyzed by Western blotting using anti-LPD3 and anti-PEX14 IgGs. PEX14, peroxisomal membrane protein PEX14 as peroxisome marker.
Fig. 3. The expression of LPD3 mRNA depends on the hepatic PPARγ expression and fatty liver formation.
Relative LPD3 mRNA 0 5 10 20 15 WT KO WT KO WT KO WT KO
OB/OB ob/ob OB/OB ob/ob
Control RGZ PPARγ LPD3 ** *** * *
Figure 7. The expression of LPD3 mRNA depends on the hepatic PPARγ expression and fatty liver formation.
QPCR analyses of PPARγ(A), LPD3 (B) mRNAs were performed using total RNA from each genotyped mouse liver. Expression was normalized to 36B4 mRNA, and each bar represents the average ± S.E.M. of 3 individual experiments. Ob/ob-PPARγWT mice have fatty liver, while ob/ob-PPARγKO mice are normal or have much less fat. OB/OB, normal genetic background mice; ob/ob, leptin-mutated mice; WT, hepatic PPARγ wild mice; KO, liver-specific PPARγ null mice;Control, diet without rosiglitazone; RGZ, diet containing rosiglitazone. Significant differences from PPARγWT liver : *p < 0.05, **p < 0.01, ***p < 0.001.
LPD3 c) LPD3 ob/ob GeneChip LPD3 LPD3 LPD3 LPD3-shRNA LPD3 LPD3 ob/ob
(LacZ-shRNA) ob/ob GeneChip
GeneChip 34365 LPD3 2 45 0.5 66 Table 1 10 mRNA
LPD3-shRNA ob/ob Ccnd1 Lipg
Ppargc1α Acot5 Scd3 Cfd Igfbp1 7 LacZ-shRNA
Scd2
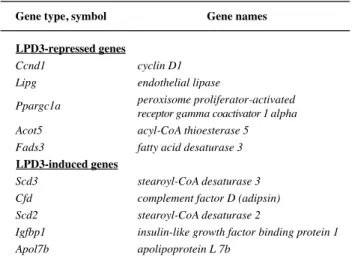
Table 1 Fads3 Apol7b
LPD3 7 (LPD3 ) LPD3 ob/ob LPD3 LPD3 3T3-L1 3T3-L1 Table 1 10 SCD3 [5] Cfd [6, 7] 2
Table 2. Lipid metabolism-related genes identified by GeneChip analysis. Gene names cyclin D1 1.80 Ccnd1 endothelial lipase 1.67 Lipg peroxisome proliferator-activated
receptor gamma coactivator 1 alpha 1.54 Ppargc1a
acyl-CoA thioesterase 5 1.53
Acot5
Signal ratio
1.52
fatty acid desaturase 3 Fads3 LPD3-repressed genes 0.40 stearoyl-CoA desaturase 3 Scd3 0.46
complement factor D (adipsin) Cfd 0.53 stearoyl-CoA desaturase 2 Scd2 0.64 apolipoprotein L 7b Apol7b
insulin-like growth factor binding protein 1
Igfbp1 0.60
Gene type, symbol
LPD3-induced genes
Table 1. Lipid metabolism-related genes identified by GeneChip analysis.
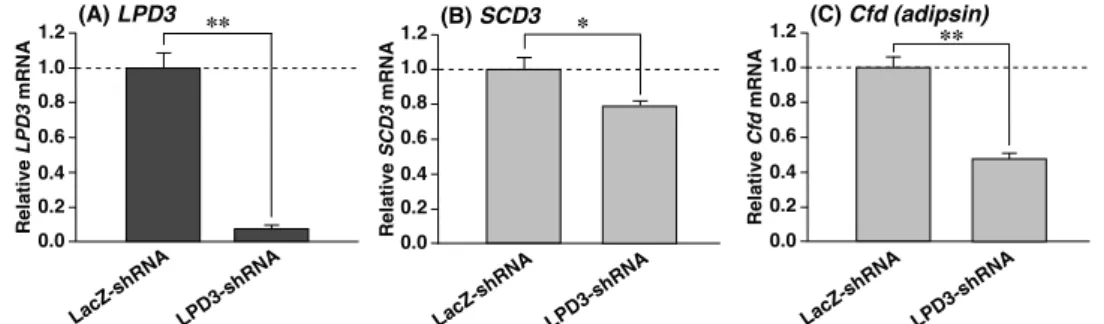
LPD3-shRNA LacZ-shRNA (Fig. 5) LPD3 SCD3 Cfd (Fig. 5A-C) 3T3-L1 SCD3 Cfd ob/ob LPD3 FSP27-1a FSP27-1b mRNA PPARγ LPD3 LPD3 SCD3 Cfd LPD3 PPARγ FSP27 PPARγ
1. Matsusue K et al. J. Clin. Invest., 111 , 737 (2003). 2. Matsusue K et al. Cell Metab., 7, 302 (2008). 3. Xu X et al. Hepatology., 61 857 (2015). 4. Aibara D. PhD Thesis. (2014).
5. Wang H et al. Cell Mol Biol., 28, 188 (2008). 6. Haugen F et al. FEBS Letters., 507, 105 (2001). 7. Song N-J et al. PLoS ONE., 11, e0162228 (2016).
Fig. 5. LPD3 knockdown in 3T3-L1 adipocytes leads to the repression of SCD3 and Cfd mRNAs. 0.0 (A) LPD3 Relative LPD3 mRNA ** 0.2 0.8 1.2 0.4 0.6 1.0 LacZ-shRNA LPD3-shRNA 0.2 0.0 0.8 1.2 0.4 0.6 (C) Cfd (adipsin) Relative Cfd mRNA 1.0 ** LacZ-shRNA LPD3-shRNA 0.2 0.0 0.8 1.2 0.4 0.6 (B) SCD3 Relative SCD3 mRNA 1.0 * LacZ-shRNA LPD3-shRNA
Figure 33. LPD3 knockdown in3T3-L1 adipocytes leads to the repression of SCD3 and Cfd mRNAs. Pre-adipocytes were transfected with LacZ-shRNA or LPD3-shRNA vector. At 3 days after infection, the cells were differentiated into mature adipocytes without RGZ for 11 days. QPCR analyses of LPD3 (A),
SCD3 (B) and Cfd (C) mRNAs were performed by using total RNA from each cell. Expression was
normalized to 36B4 mRNA, and each bar represents the average ± SEM of 3 individual experiments. Significant differences compared with LacZ-shRNA : *p < 0.01, **p < 0.001.
peroxisome proliferator-activated receptor γ (PPARγ) 2
ob/ob ob/ob
PPARγ fat specific protein 27 (FSP27)
FSP27
PPARγ
ob/ob GeneChip liver PPARγ-dependent
gene 3 (LPD3) FSP27 LPD3 1) FSP27 2 (FSP27-1a FSP27-1b mRNA) 2) LPD3 LPD3 FSP27 2 FSP27-1a FSP27-1b mRNA ( ) ( ) FSP27-1a FSP27-1b mRNA FSP27-1a FSP27-1b LPD3 LPD3 LPD3 PPARγ PPARγ LPD3 PPARγ LPD3 LPD3 ob/ob ob/ob LPD3 LPD3 LPD3 ob/ob GeneChip 34365 LPD3 2 45 0.5 66 SCD3 Cfd 3T3-L1 LPD3 LPD3 SCD3 Cfd LPD3 FSP27 PPARγ
2 1