Thesis of Doctor of Philosophy
The Study of Characteristics of Visual Attention in Depth
of Drivers in Traffic Environment
Ruting Xia
Supervisor:
Prof. Shun'ichi Doi
Doi Lab
Intelligent Mechanical Systems Engineering Graduate School of Engineering
Kagawa University, JAPAN
December 2008
© 2008 Ruting Xia All Rights Reserved
Acknowledgements
My profound gratitude goes to Professor Shun’ichi Doi and Professor Takahiro Wada, my mentor and research advisor, and Tutor Masato Fukushima, Intelligent Mechanical Systems Engineering, Graduate School of Engineering, Kagawa University. And Dr. Takahiko Kimura and Professor Toshiaki Miura, Department of Applied Cognitive Psychology, Osaka University, who all contributed significantly to the work described in this thesis. Without their guidance, contributions of ideas and theories, and even contributions down to the details of mathematical derivations and experimental data processing, I would certainly not have been able to complete the more complex and interesting parts of this work.
I salute Professor Shun’ichi Doi’s rich ideas, genuine passion for science, discovery and understanding, superior mentoring skills, and unparalleled availability, with a maximum time-to-meeting in every week. Professor Doi led me into the field of specialization of cognitive and traffic active safety, I would not have found the energy to work hard without Professor Doi’s support and encouragements as well as meticulously life care. I also salute Professor Takahiro Wada’s helpful advice and encouragement during my three years research and suggestion in elaboration of the thesis. I also salute Tutor Masato Fukushima’s generous guidance and helpful advice during two years research experiments and meticulously help in the preparation of this thesis. I also salute Dr. Takahiko Kimura and Professor Toshiaki Miura’s bright scientific ideas, solid methods, and patience with respect to my often lighter approach to research.
I would like to give my best thanks to Professor Jinglong Wu and Professor Shuxiang Guo for their warmly advisements and encouragement in my studies.
I am very grateful to colleagues for help and collaborations in my research: Fukuoka, Nishiyama, Hiroki, Matsuoka, Yoshida, Kono, Nanno, Iwasaki, Tsutsumi et al, and all whom I forget. Thank them to give the best efforts and make the lab an enjoyable and productive environment, I can not imagine I could finish my experiments without their cooperation.
My very special thanks go to my family, which, despite the great distance, have always given me love and unconditional support. I wish to express my deep gratitude to my mother for her supports and my wife Xiaoyan Zou for her love, and thank my son Xiancheng Xiahou for his encouragement.
I would like to thank Kuraoka Scholarship Foundation and Nankai Ikueikai Scholarship Foundation, for their funding of my postgraduate studies, so that I can pay more attention to my research.
Abstract
The number of traffic accidents keeps increasing with increasing of the number of private cars and the improvement of road traffic environments although death number of traffic accidents keeps decreasing over the recent years. There were a lot of factors for the traffic accidents, those factors that are directly related to people-the so-called “human errors”-has been examined by considering a car to be a cooperative human-machine system and through the analysis of about 300 road traffic accidents by the Institute for Traffic Accident Research and Data Analysis (ITARDA). When human errors are grouped into three categories, namely, cognitive errors, judgment errors and operation errors, they are found to constitute 47%,40%, and 13 of the total, respectively, meaning that cognitive errors and judgment constitute about 90% of all human errors. In addition, a lot of death numbers in the twilight condition have been reported. There are several reasons for the human errors; one of the main reasons is the effect of traffic environment (including car exterior and interior environment) on safety driving. Another primary reason is the effect of the visual function of drivers on operations of drivers.
With the popularization of the information prompt instruments in the car interior like automobile navigation system and speedometer etc., drivers obtained more and more information from the screen display. It is important the effect of the expression color of the information prompt instruments in the car interior on the visual attention of drivers. So, it is very important to reveal the vision attentional characteristics of drivers. However, characteristic of depth attention of drivers remained unclear, only a few studies addressed the effect of the environmental illuminance in car exterior and the information prompt instruments in car interior on the visual attention of drivers. We designed an attention measurement system to conduct four experiments in order to research the attentional characteristics of drivers in the present study
The environmental illuminance in car exterior can be divided into three categories: The bright, twilight and dawn. There are various kinds of color combines between the information prompt instruments in car interior and the traffic environment in car exterior. In order to ensure traffic safety and to obtain more visual information, drivers have to switch continually their visual attention between the objects presented in front of drivers because various kinds of traffic environments are changing continually during driving. The present study consisted of the following four parts:
(1) A study on characteristics of attention in depth of young subjects in changing supposed environmental illuminance. The experimental environment illuminances were: bright (480-680 lx)
and twilight (95-135 lx) conditions. Subjects were fifteen students served as participants, whose mean year was 21.8 years old. The subjects must make a quick response according to the information presented beforehand at the targets location. Three within-observe variables were used: cue validity (Valid: V, Invalid: I, Neutral: N). 65% of all trials were Valid, 15% were Invalid and 20% were Neutral. The experimental results suggested that the attentional characteristics of subjects were influenced not only by the vision function of subjects, but also by cue validity. Reaction time was shorter in the valid, and longer in the invalid. In addition, there was an effect of environmental illuminance on response lag in low illuminance condition, and the response lag depended on the shifting distance of the attention in depth. (Bright: 480-680 lx, twilight: 95-135 lx and dawn: 5-8 lx)
(2) A study on characteristics of attention in depth of subjects simulated low-vision in changing supposed environment illuminance. The experimental environment illuminances were: bright (480-680 lx), twilight (95-135 lx) and dawn (5-8 lx) conditions. Subjects were fourteen students served as participants, whose mean year was 24.9 years old. The results suggested that the attentional characteristics of subjects were also influenced by the environmental illuminanc. In particularly, reaction time was shortest in the dawn condition than in the bright and twilight conditions, and showed that there is an effect of low environmental illuminance on response of subjects.
(3) A study on characteristics of attention in depth of older subjects in supposed bright condition. The experimental environment illuminance was: bright (480-680 lx) condition. Subjects were fifteen older peoples served as participants, whose mean year was 63.9 years old. The results suggested that their reaction times were obviously longer than young subjects.
(4) A Study on characteristics of attention in depth in changing cue duration and targets color in supposed traffic environment. The experimental cue durations were: 600 and 1000 ms, and color of cue and targets were red and green under two observing conditions (static and dynamic). The results suggested that it was evident the effect of color on the response lag when the color of cue and color of targets was not consistent.
In present study, the visual attention characteristics of young, low-vision and older subjects are examined by changing peripheral environmental illuminance and color combination of cue and targets. Four experiments are conducted. The results of the environmental illuminanc experiments suggest that reaction time of the subjects with high visual adaptability is shorter than the subjects with low visual adaptability in twilight condition, this results show that the subjects with low visual adaptability have a response lag in twilight condition, the direction of switching attention of subjects result in this orientation to response lag. Response of subjects with low visual adaptability is slower than subjects with high visual adaptability when the
attention distance is greater. The results of the color combination experiments suggest that the asymmetry of attention is small in cue being red than that in cue being green, on the other hand, the reaction time is shorter in targets being red than that in targets being green in invalid condition.
In conclusion, danger tendency of drivers is exposed in traffic environmental illuminance change in this study. To be engaged in traffic safety education, according to those research results, we should expound visual attention characteristics to drivers, even try to append these
finding into teaching pamphlet in order to ensure traffic safety and to decrease traffic accidents.
Keywords: Visual attention in depth, Traffic environment, Peripheral environmental illuminance, Cues and stimuli, Duration and color.
Contents
Acknowledgements Abstract
Chapter 1 General Introduction
1.1 Research background …...1
1.2 Connotation of visual attention ………....…4
1.3 History of the research of visual attention ………...7
1.4 Current researches ………...8
1.5 Spatial theories of visual attention ………...9
1.6 A three-dimensional space: Stereoscopic space and real space ……….11
1.7 A few cases on visual attention research simulated traffic environment ………...14
1.8 Purpose and significance ………...16
Chapter 2 Experimental Procedure 2.1 Introduction ………17
2.2 Experimental procedure …...20
2.2.1 Test of visual functions of young subjects in 2-D space …...20
2.2.1.1 Test method …...21
2.2.1.2 Results of test ...…22
2.2.2 Test of visual functions of young subjects in 3-D space ...25
2.2.3 Test of visual functions of older subjects in 2-D space ...………...27
2.3 Summary ...………...27
Chapter 3 A Study on Characteristics of Attention in Depth of Young Subjects in Changing Supposed Environmental Illuminance 3.1 Introduction ………....29
3.2 Method ………..…….32
3.2.1 Subjects …...32
3.2.2 Apparatus …...32
3.2.3 Cue and stimuli …...36
3.2.4 Experimental design ………...36
3.2.5 Task and procedure ………...36
3.3 Results and discussion …...38
3.4.1 Method ……….……43
3.4.1.1. Subjects ………..43
3.4.1.2. Apparatus and stimuli ……….43
3.4.1.3. Procedure ………43
3.4.2. Results and discussion ……….45
3.5 Summary …...46
Chapter 4 A Study on Characteristics of Attention in Depth of Subjects Simulated Low-vision in Changing Supposed Environment Illuminance 4.1. Introduction ………...48
4.2. Method ……….…..50
4.2.1 Subjects ………..…50
4.2.2 Apparatus ……….…..50
4.2.3 Cue and stimuli ………..…51
4.2.4 Experimental design ………..…51
4.2.5 Task and procedure …...52
4.3 Results and discussion …...52
4.3.1 Results in dynamic observing condition …...52
4.3.2 Results in static observing condition ……….……54
4.4 Summary …...57
Chapter 5 A Study on Characteristics of Attention in Depth of Older Subjects in Supposed Bright Condition 5.1 Introduction ………59
5.2 Method ………...60
5.2.1 Subjects ……….60
5.2.2 Apparatus ………..61
5.2.3 Cue and stimuli ……….61
5.2.4 Experimental design ……….61
5.2.5 Task and procedure ………...61
5.3 Results and discussion ………...62
5.4 Summary ………65
Chapter 6 A Study on Characteristics of Attention in Depth in Changing Cue Attend Duration and Targets Color in Supposed Traffic Environment 6.1. Introduction ………...67
6.2.1 Method ………70
6.2.1.1 Subjects ………70
6.2.1.2 Apparatus ……….70
6.2.1.3 Cue and stimuli ………70
6.2.1.4 Experimental design ………71
6.2.1.5 Task and procedure ………..71
6.2.2 Results and discussion for duration experiment ……….71
6.2.2.1 Cue location validity and duration effects ………...72
6.2.2.2 Characteristics of switching of attention in depth ………...76
6.3 Experiment of effect of color on reaction time (Color experiment) ………..77
6.3.1 Method ………77
6.3.1.1 Subjects ………77
6.3.1.2 Apparatus ……….77
6.3.1.3 Cue and stimuli ………77
6.3.1.4 Experimental design ………78
6.3.1.5 Task and procedure ………..78
6.3.2 Results and discussion for color experiment ………..78
6.3.2.1 Color of cue and target is consistent under static observing condition ……...78
6.3.2.2 Color of cue and target is inconsistent under static observing condition …..80
6.3.2.3 Color of cue and target is consistent under dynamic observing condition …83
6.3.2.4 Color of cue and target is inconsistent under dynamic observing condition …....85
6.3.2.5 Interaction effect of cue location validity and color combine on reaction time in both 600 ms and 1000 ms duration ...88
6.4 Summary ...90
Chapter 7 General Discussion 7.1 Discussion of our results for young subjects’ reaction times ...94
7.2 Discussion of our results for low-vision subjects’ reaction times ...96
7.3 Discussion of our results for older subjects’ reaction times ...97
7.4 Discussion of our results on location and color cues ...98
Chapter 8 Conclusion and Future outlook 8.1 Conclusion ...96
8.2 Future outlook ...98
References …...98
List of Figures
Figure 1-1 Statistic of motor vehicle numbers during 1995-2007 in China ………..2
Figure 1-2 Death numbers of traffic accidents during 1995-2007 in China ………..2
Figure 1-3 Block diagram of a vehicle regarded as a human-machine cooperative system …..3
Figure 1-4 Death number with different age during 2000-2003, Henyang City ………...4
Figure 1-5 Death number with different time in2004, Hangzhou City ……….4
Figure 1-6 Attentional model: SCAN ………....6
Figure 1-7 Attentional model: SLAM ………....6
Figure 1-8 Collocation of cue and stimuli in experiments of Downing & Pinker …...12
Figure 1-9 Collocation of cue and stimuli in experiments of Gawryszewski et al. ………….12
Figure 1-10 Collocation of cue and stimuli in experiments of Miura et al. ……….13
Figure 1-11 Top-down and bottom-up cue paradigm in experiments of Kimura et al. ……….13
Figure 1-12 Collocation of stimuli in experiments of Nakayama and Silverman …………...14
Figure 1-13 A still from a hazard perception clip with the four target placeholders ………...14
Figure 1-14 Attention measurement systems in front view of the driving scene ………15
Figure 1-15 Attention search in differential background illuminance ……….15
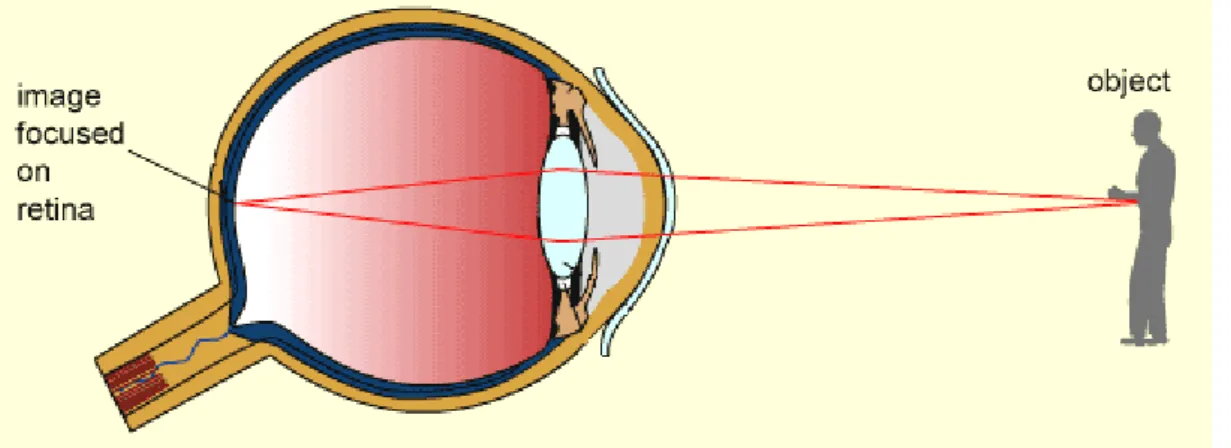
Figure 2-1 Structure of the eye ………17
Figure 2-2 Iris reflex in bright conditions ………18
Figure 2-3 Iris reflex in dim conditions ………...18
Figure 2-4 Focusing of the eye ………18
Figure 2-5 The ability of the lens at far place ………..19
Figure 2-6 The ability of the lens at near place ………...19
Figure 2-7 Visual functions composition of human attention …...20
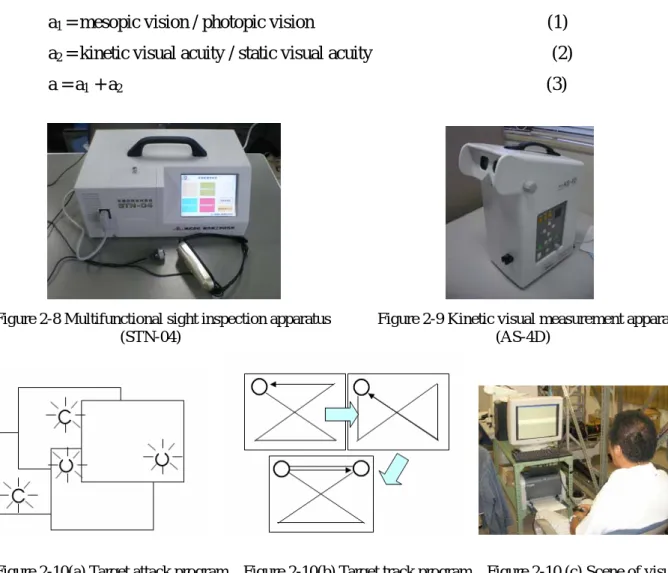
Figure 2-8 Multifunctional sight inspection apparatus (STN-04) …...21
Figure 2-9 Kinetic visual measurement apparatus (AS-4D) …...21
Figure 2-10(a) Target attack program ………..21
Figure 2-10(b) Target track program ………...21
Figure 2-10 (c) Scene of visual target attack and track testing (MMO-DVC-2011) ………...21
Figure 2-11 Distribution of visual performance of subjects ……….………...24
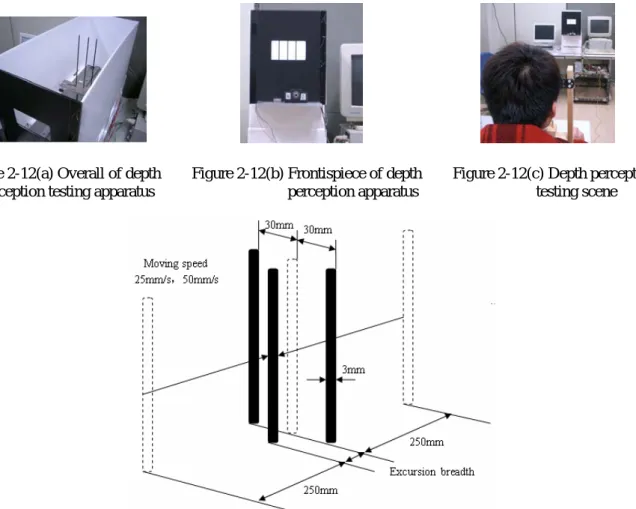
Figure 2-12(a) Overall of depth perception testing apparatus ……….26
Figure 2-12(b) Frontispiece of depth perception apparatus ……….26
Figure 2-13 Principium sketch of depth perception testing ……….26
Figure 3-1 Overall of experimental apparatus ………....33
Figure 3-2 A three-dimensional attentional measurement systems ……….33
Figure 3-3(a) A tunnel scene under bright condition ………...34
Figure 3-3(b) A tunnel scene under twilight condition ………34
Figure 3-4 Chair of a cart moving to-and-fro ………34
Figure 3-5 Steering wheels with buttons ……….34
Figure 3-6 Size of experimental apparatus ...34
Figure 3-7 Experimental apparatus control systems ………35
Figure 3-8 Distances between target and fixation (nearer targets) ………..37
Figure 3-9 Distances between target and fixation (farther targets) ……….37
Figure 3-10 Interfaces of control systems ………...37
Figure 3-11 Mean reaction times in each condition ……….40
Figure 3-12 Mean reaction times in invalid conditions ………...40
Figure 3-13 Mean reaction times of subjects in both bright and twilight conditions ………..40
Figure 3-14 Cost & benefit of the moved distance (High visual adaptability group) ……….42
Figure 3-15 Cost & benefit of the moved distance (Low visual adaptability group) ………..42
Figure 3-16 From near to far cases ………..44
Figure 3-17 From far to near cases ………..44
Figure 3-18 Cost & Benefit of response by forecast degree change (Low visual adaptability group) ……….45
Figure 4-1(a) Inner structure of eyepiece (the overall) ………50
Figure 4-1(b) Inner structure of eyepiece (size) ………..51
Figure 4-1(c) Inner structure of eyepiece with the yellow plastic film ………...51
Figure 4-2(a) Bright condition (480-680 lx) ………...51
Figure 4-2(b) Dawn condition (5-8 lx) ………51
Figure 4-2(c) Twilight condition (95-135 lx) ………...51
Figure 4-3 Mean reaction times and standard deviations (Dynamic condition) ………..53
Figure 4-4 Mean reaction times and standard deviations in different switch direction of attention (Dynamic condition) ………...54
Figure 4-5 Mean reaction times and standard deviations (Static condition) ...56
Figure 4-6 Mean reaction times and standard deviations in different switch direction of attention (Static condition) ………...56
Figure 4-7 Benefits &costs in three illuminance conditions ………57 Figure 4-8 Value of benefits &costs in both “from far to near”
and “from near to far” conditions ……….57 Figure 5-1 A three dimensional attention measurement system (cue duration experiment) ...62 Figure 5-2 Distributed conditions of cue and stimuli ……….63 Figure 5-3 Mean reaction time in both 600 and 1000 ms durations (Static condition) ……..65 Figure 5-4 Mean RTs in different switch direction of attention (Static condition) ………….65 Figure 5-5 Mean RTs in both 600 and 1000 ms durations (Dynamic condition) ………67 Figure 5-6 Mean RTs in different switch direction of attention (Dynamic condition) ………67 Figure 5-7 Collocation of LED & Color combinations of cue and stimuli ……….69 Figure 5-8 Mean RTs in three cue validity under static condition (color consistent) ………..70 Figure 5-9 Mean RTs in different switch direction of attention under static condition
(color consistent) ………70 Figure 5-10 Mean RTs in three cue validity under static condition (color inconsistent) …….74 Figure 5-11 Mean RTs in different switch direction of attention under static condition
(color inconsistent) ………....………..74 Figure 5-12 Mean RTs in three cue validity under static condition (color consistent) ………76 Figure 5-13 Mean RTs in different switch direction of attention under static condition
(color consistent) ………76 Figure 5-14 Mean RTs in three cue validity under static condition (color inconsistent) …….78 Figure 5-15 Mean RTs in different switch direction of attention under static condition
(color inconsistent) ………..78 Figure 5-16 Effect of color and location validity on reaction time (600 ms cue duration) ….80 Figure 5-17 Effect of color and location validity on reaction time (1000 ms cue duration) ...80 Figure 6-1 Mean RTs of the younger and older subjects ………...88 Figure 6-2 Mean RTs of the younger and older subjects in three cue validity ………88 Figure 6-3 Mean RTs of the older and younger subjects in both the I-same and I-different ...89 Figure 6-4 Mean RTs of the older subjects in different switch direction ……….90 Figure 6-5 Cost & benefit of attention for the older subjects ………..91
List of Tables
Table 2-1 Reflex action course in near and far places ……….20
Table 2-2 Moving adaptability test values of young subjects ………..22
Table 2-3 Ambience adaptability test values of young subjects ……….….…....23
Table 2-4 Visual adaptability statistic values of young subjects ………..23
Table 2-5 Visual performance of subjects of young subjects ………..………24
Table 2-6 Dynamic discrimination of subjects (target track item) ...………...24
Table 2-7 Dynamic discrimination of subjects (target attack item) ...25
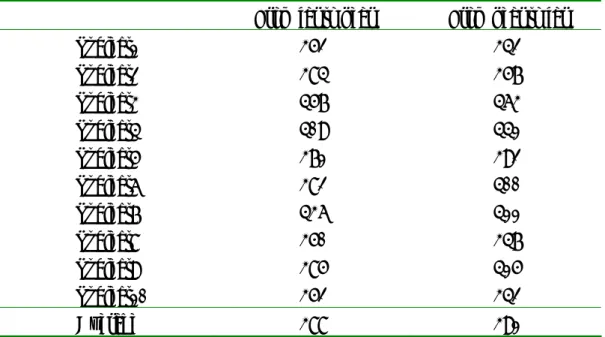
Table 2-8 Depth perception test values of subjects ……….………26
Table 2-9 Moving adaptability test values of older subjects ………..…….………26
Table 3-1 Mean RTs in bright condition (ms) ...38
Table 3-2 Mean RTs in twilight condition (ms) ...38
Table 3-3 Mean RTs in invalid-same and invalid-different under bright condition (ms) ...39
Table 3-4 Mean RTs in invalid-same and invalid-different under twilight condition (ms) ...39
Table 3-5 Mean RTs in both bright and twilight conditions ………41
Table 3-6 Cost & benefit values of two subjects with low visual adaptability ...44
Table 4-1 Mean RTs with different cue cases (Dynamic condition) ...53
Table 4-2 Mean RTs with different switch direction (Dynamic condition) ...53
Table 4-3 Mean RTs with different cue cases (Static condition) ...55
Table 4-4 Mean RTs with different switch direction (Static condition) ...55
Table 4-5 Benefits &costs values in three illuminance conditions ...56
Table 5-1 RTs of subjects in 600 ms duration (Static condition) ...64
Table 5-2 RTs of subjects in 1000 ms duration (Static condition) ...64
Table 5-3 RTs of subjects in 600 ms duration in different switch direction of attention (Static condition) ...65
Table 5-4 RTs of subjects in 1000 ms duration in different switch direction of attention (Static condition) ...65
Table 5-5 RTs of subjects in 600 ms duration (Dynamic condition) ...66
Table 5-6 RTs of subjects in 1000 ms duration (Dynamic condition) ...67
Table 5-7 RTs of subjects in 600 ms duration in different switch direction of attention (Dynamic condition) ...67 Table 5-8 RTs of subjects in 1000 ms duration in different switch direction of attention
(Dynamic condition) ...68 Table 5-9 RTs of subjects in 600 ms duration (Static condition)
[Color consistent (Cue: red・Stimulus: red)] ...71 Table 5-10 RTs of subjects in 600 ms duration (Static condition)
[Color consistent (Cue: green・Stimulus: green)] ...71 Table 5-11 RTs of subjects in 600 ms duration in different switch direction of attention
[Color consistent (Cue: red・Stimulus: red) (Static condition)] ...72 Table 5-12 RTs of subjects in 600 ms duration in different switch direction of attention
[Color consistent (Cue: green・Stimulus: green) (Static condition)] ...72 Table 5-13 RTs of subjects in 600 ms duration (Static condition)
Color inconsistent (Cue: red・Stimulus: green) ...73 Table 5-14 RTs of subjects in 600 ms duration (Static condition)
Color inconsistent (Cue: green・Stimulus: red) ...73 Table 5-15 RTs of subjects in 600 ms duration in different switch direction of attention
[Color consistent (Cue: red・Stimulus: green) (Static condition)] ...74 Table 5-16 RTs of subjects in 600 ms duration in different switch direction of attention
[Color consistent (Cue: green・Stimulus: red) (Static condition)] ...74 Table 5-17 RTs of subjects in 600 ms duration (Dynamic condition)
Color consistent (Cue: red・Stimulus: red) ...75 Table 5-18 Reaction times of subjects in 600 ms duration (Dynamic condition)
Color consistent (Cue: green・Stimulus: green) ...76 Table 5-19 RTs in 600 ms duration in different switch direction of attention
[Color consistent (Cue: red・Stimulus: red) (Dynamic condition)] ...76 Table 5-20 RTs of subjects in 600 ms duration in different switch direction of attention
[Color consistent (Cue: green・Stimulus: green) (Dynamic condition)] ...77 Table 5-21 Reaction times of subjects in 600 ms duration (Dynamic condition)
Color inconsistent (Cue: red・Stimulus: green) ...78 Table 5-22 RTs of subjects in 600 ms duration (Dynamic condition)
Color inconsistent (Cue: green・Stimulus: red) ...78 Table 5-23 RTs of subjects in 600 ms duration in different switch direction of attention
[Color consistent (Cue: red・Stimulus: green) (Dynamic condition)] ...79 Table 5-24 RTs of subjects in 600 ms duration in different switch direction of attention
Table 5-25 Mean RTs in valid and invalid locations in both 600 and 1000 ms durations ...80
Table 6-1 Mean RTs in three cue validity ...88
Table 6-2 Mean RTs in I-same and I-different validity ...89
Table 6-3 Mean RTs in different switch direction of attention ...90
Table 6-4 Costs and benefits of attention ……….91
Chapter 1 General Introduction
Motor cars are a very commonplace means of transportation, especially when compared to public transport. The number of private cars continues to increase, the numbers of people, who have access to their driving license, is getting more and more, however, road traffic accidents have become a problem. Thus, there is a need for a means of reducing the number of road traffic accidents without compromising the convenience that cars offer us. Many of researches are currently being done in the field of active safety. From analyses of drivers’ mistakes, many traffic accidents referred to as “human errors”, and have shown that drivers continue to make mistakes in the cognition of their external world and judging between safe/not safe. So, research into drivers’ behavior and active safety is being performed to develop driver support technologies that take the characteristics of a driver’s cognition, judgment, and actions into account.
When a driver is driving a car, the driver should attend objects to both near and far at the same time in order to ensure traffic safety, that is, feature information of objects presented in front of drivers will draw driver’s visual attention in useful field of view. Driving behavior is the control of a vehicle through a process of drivers’ recognition, judgment and operation based on environmental information input, a visual system of drivers receives massive amounts of information and prioritizes from frontal road signs and markings in traffic environment, so drivers have to switch continually their visual attention between the objects presented in front of drivers, such as shifting from near space to far space. The selection of information from the environment is accomplished by drivers’ visual attention, in order to acquire significant information, drivers allocated selectively their attention, and drivers for driving tasks are required to make a quick response according to the feature information (location, color, shape, orientation etc.) of objects presented beforehand at the targets location. Although it is one of the most important issues to understand the relationship between our visual system and our driving behavior, we can not disclose the characteristics of visual cognition in three-dimensional space and the relationship between visual cognition and our driving behavior in actual situation.
1.1 Research background
1.1.1 Road traffic safety situations
1) Number of motor vehicles increases rapidly: In the past 10 years, with the continuous and rapid development of Chinese economy, the numbers of both motor vehicles and drivers increased sharply. The number of vehicles reached from 31.8 millions in 1995 to 127.3 millions
in 2007 (see Figure 1-1), and with an annual increase rate over 10%, which is remarkably higher than that of the GDP [1].
Figure 1-1 Statistic of motor vehicle numbers during 1995-2007 in China (From China Annual Report on Automobile Industry, 2005, 2006, 2007)
2) The number of vehicle drivers increases rapidly: The number of drivers grew rapidly along with the growth of the vehicle number. Till the end of 2006, there are 1108.9 millions drivers nationwide, and with an annual increase rate over 10%.
3) Road traffic death number increased sharply: The number of traffic accidents kept relatively high over the last years, theroad traffic death number increased sharply also (see Figure 1-2). Traffic accidents mainly occurred on highways in 2004, highway accident death accounts for 76.8% of total traffic accident death, with accidents numbers 1.4 times of that of urban road and death numbers 3.3 times of that of urban.
Figure 1-2 Death numbers of traffic accidents during 1995-2007 in China (From China Annual Report on Automobile Industry, 2005, 2006, 2007)
1.1.2 Human error and road traffic accidents
Let’s consider the factors that contribute to the occurrence of accidents. Those factors that are directly related to people-the so-called “human errors”- has been examined by considering a
car to be a cooperative human-machine system and through the analysis of about 300 road traffic accidents by the Institute for Traffic Accident Research and Data Analysis (ITARDA). When human errors are grouped into three categories, namely, cognitive errors (ex. Errors caused by oversights), judgment errors (ex. wrongly judging that the other vehicle will stop) and operation errors (ex. failing to apply the brakes strongly enough in an emergency), they are found to constitute 47%, 40%, and 13% of the total, respectively, meaning that cognitive errors and judgment constitute about 90% of all human errors. When the reasons for cognitive and judgment errors are analyzed, we find that about half of the cognitive mistakes are caused by “carelessness” and “mistaken assumptions”, while about half of the judgment mistakes are caused by “mistaken assumptions”. Watanabe et al. investigated the visual checks made by drivers to ensure that it was safe to cross an intersection without traffic signals. It was found that, in the case of about half of the 172 observations, the driver failed to check the conditions adequately or was too late. Such drivers seem to assume that there will be no other vehicles in the intersection, so do not confirm that the conditions are safe. Figure 1-3 shows relation among cognition and judgment as well as operation of drivers during driving in traffic environment.
Figure 1-3 Block diagram of a vehicle regarded as a human-machine cooperative system
1.1.3Cause analysis of road traffic accident proneness
There were a lot of reasons for the traffic accidents, such as road status, law-breaking and anti-regulation behaviors of drivers, time of driving and age of drivers etc. Figures1-4 and 1-5 illustrated the status of traffic accident with different age and different time in driving.
distinguished from frontal road signs and markings in various conditions, such as in daytime, twilight, night, foggy day and in rainy day etc., and visual attention of the drivers was under influence of many factors, such as luminance environment, self-visual function, and the location of vision objects etc.. Many of traffic accidents happened in twilight condition. Traffic accidents rate was 22.71% in twilight (18:00 to 20:00 hour) based on the investigations.
208 212 345 306 225 142 155 100 150 200 250 300 350 400 1~15 16-25 26-35 36-45 46-55 56-65 >65Age D e at h number (Per .)
Figure 1-4 Death number with different age during 2000-2003, Henyang City
24 8 18 26 16 33 57 28 10 10 9 12 0 10 20 30 40 50 60 6~8 8~10 10~12 12~14 14~16 16~18 18~20 20~22 22~24 0~2 2~4 4~6Hr. D eat h num ber ( P er .)
Figure 1-5 Death number with different time in2004, Hangzhou City (From Report of Statistic Analysis of Traffic Accidents in Hangzhou City, 2004)
1.2 Connotation of visual attention
Attention has a complex meaning in psychology. In its early history, it was described closely related to subjective awareness of the world around us. As James said [James 1890]: “Everyone
knows what attention is. It is the taking possession of the mind, in clear and vivid form, of one out of what seem several simultaneously possible objects or trains of thought. Focalization, concentration of consciousness are of its essence. ...”
In recent years the concept of attention has refined its meaning in contrast to the idea of a purely automatic processing that occurs without attention. In cognitive neuroscience, it is now probably viewed as a neural system for the selection of information similar in many ways to the visual, auditory, or motor systems (Posner 1994)[2]. According to the evidence from neuroscience, an attention system can be divided into separate subsystems performing independent but
interrelated functions interacting with other domain-specific systems. Attention is carried out by a network of anatomical areas and is therefore neither the property of a single center nor a function of the brain as a whole. Attention mechanism of human vision system has been applied to serve machine visual system for sampling data nonuniformly and utilizing its computational resources efficiently (Ballard 1991) [3]. The fundamental work on and the critical role of attention in vision have been described by Yarbus (1967), Neisser (1967), Richards and Kaufman (1969) and many other researchers. Further work on attention can also be found in (Posner 1980) [4], (Kosslyn 1980) [5] and (Treisman 1980) [6]. The visual attention mechanism may have at least the following basic components (Tsotsos, et. al. 1995) [7]:
(1) the selection of a region of interest in the visual field; (2) the selection of feature dimensions and values of interest;
(3) the control of information flow through the network of neurons that constitutes the visual system;
(4) the shifting from one selected region to the next in time.
There are many ways that can be used to classify the attention system according to its various aspects. In a stimulus' point of view, the stimulus may attract attention by exogenous or endogenous methods. The exogenous components are mainly determined by external stimulus characteristics, whereas the endogenous components mostly depend on the subject's intentions and actions. In a subject's point of view, the subject can actually switch the gaze fixation point to the point being attended to (i.e., overt attention). On the other hand, it can also shift the attentional processing or gaze to a new location in the visual field for foveating without any a fixation shift or motor action (i.e., covert attention). As described by Treisman et al. (1984) [8]
, the features that are attractors of covert visual attention are those parts of an image that differ from all the other parts by a single aspect. And an object's shape, degree of symmetry, and the spatial distribution of objects in a scene are the important features for overt attentional stream. In the view of the route of information processing and attentional control, there are two kinds of execution methods: one is bottom-up or stimulus-driven, such as exogenous attention; another is top-down or goal-directed, such an endogenous attention. Combining some neurological models of attention, Perry and Hodges (1999) [9] have divided attention into three broad categories:
(1) Selective attention and shifting
Its defining characteristics are focusing on single relevant stimulus or processing at one time while ignoring irrelevant or distracting stimuli;
(2) Sustained attention
periods of times; (3) Divided attention
The defining characteristics are sharing of attention by focusing on more than one relevant stimulus or process at one time. However, all the above classifications are interweaved with both active (or voluntary) and passive (or involuntary) attention. The division of active and passive attention switch was proposed by James (1890). The findings from neuroscience indicate that the separate attentional resources exist for different stages of processing and distinct parallel neural pathways (Mishkin 1983, Posner 1994, Michie 1999). The following model (see Figure 1-6), SCAN, was proposed by Postma et.al. (1997) [10]:
Figure 1-6 Attentional model: SCAN
SCAN consists of three main components: an input image, a gating network, and a classifier network. Given an expectation pattern E, the best-matching part of the input image is selected as the attended pattern and channeled by the gating network towards the output which serves as input for the classifier network. The shaded area represents the attentional beam. Another model (see Figure 1-7) SLAM was proposed by Phaf, et.al. (1990) [11]
:
SLAM uses two main procedures to select visual stimuli, within-module competition and precueing of behaviourally relevant attributes.
There are still some other typical models, listed as following: a). A feature-integration theory
b). SERR (Humphreys, et.al. 1993) [12] c). Guided search (Wolfe 1994) [13] d). VIST (Ahmad 1992) [14]
e). Dynamic routing circuits (Olshausen, et.al. 1993) [15] f). What-and-where filter (Carpenter, et.al. 1998) [16]
g). Active vision (Aloimonos 1988[17], Bajcsy 1988, Ballard 1991)
Overt and covert attention: Attention may be differentiated according to its status as “overt” versus “covert”. Overt attention is the act of directing sense organs towards a stimulus source. Covert attention is the act of mentally focusing on one of several possible sensory stimuli. Covert attention is thought to be a neural process that enhances the signal from a particular part of the sensory panorama.
There are studies that suggest the mechanisms of overt and covert attention may not be as separate as previously believed. Though humans and primates can look in one direction but attend in another, there may be an underlying neural circuitry that links shifts in covert attention to plans to shift gaze. For example, if individuals attend to the right hand corner field of view, movement of the eyes in that direction may have to be actively suppressed. The current view is that visual covert attention is a mechanism for quickly scanning the field of view for interesting locations. This shift in covert attention is linked to eye movement circuitry that sets up a slower saccade to that location.
1.3 History of the research of visual attention
1850s to 1900s: In James' time, the method more commonly used to study attention was introspection. However, as early as 1858, Franciscus Donders used mental chronometry to study attention and it was considered a major field of intellectual inquiry by such diverse authors as Sigmund Freud, Walter Benjamin, and Max Nordau. One major debate in this period was whether it was possible to attend to two things at once (split attention). Walter Benjamin described this experience as "reception in a state of distraction." This disagreement could only be resolved through experimentation.
1950s to present: In the 1950s, research psychologists renewed their interest in attention when the dominant epistemology shifted from positivism (i.e., behaviorism) to realism during what has come to be known as the "cognitive revolution" The cognitive revolution admitted unobservable cognitive processes like attention as legitimate objects of scientific study.
Colin Cherry and Donald Broadbent, among others, performed experiments on dichotic listening. In a typical experiment, subjects would use a set of headphones to listen to two streams of words in different ears and selectively attend to one stream. After the task, the experimenter would question the subjects about the content of the unattended stream. During this period, the major debate was between early-selection models and late-selection models. In the early selection models (first proposed by Donald Broadbent and Anne Treisman), attention shuts down or attenuates processing in the unattended ear before the mind can analyze its semantic content. In the late selection models (first proposed by J. Anthony Deutsch and Diana Deutsch), the content in both ears is analyzed semantically, but the words in the unattended ear cannot access consciousness. This debate has still not been resolved.
Anne Treisman developed the highly influential feature integration theory. According to this model, attention binds different features of an object (e.g., color and shape) into consciously experienced wholes. Although this model has received much criticism, it is still widely accepted or held up with modifications as in Jeremy Wolfe's Guided Search Theory.
In the 1960s, Robert Wurtz at the National Institutes of Health began recording electrical signals from the brains of macaques who were trained to perform attentional tasks. These experiments showed for the first time that there was a direct neural correlate of a mental process (namely, enhanced firing in the superior colliculus).
In the 1990s, psychologists began using PET and later fMRI to image the brain in attentive tasks. Because of the highly expensive equipment that was generally only available in hospitals, psychologists sought for cooperation with neurologists. Pioneers of brain imaging studies of selective attention are psychologist Michael I. Posner (then already renown for his seminal work on visual selective attention) and neurologist Marcus Raichle. Their results soon sparked interest from the entire neuroscience community in these psychological studies, which had until then focused on monkey brains. With the development of these technological innovations neuroscientists became interested in this type of research that combines sophisticated experimental paradigms from cognitive psychology with these new brain imaging techniques. Although the older technique of EEG had long been to study the brain activity underlying selective attention by cognitive psychophysiologists, the ability of the newer techniques to actually measure precisely localized activity inside the brain generated renewed interest by a wider community of researchers. The results of these experiments have shown a broad agreement with the psychological, psychophysiological and monkey literature.
1.4 Current researches
Attention remains a major area of investigation within education, psychology and neuroscience. Many of the major debates of James’ time remain unresolved. For example,
although most scientists accept that attention can be split, strong proof has remained elusive. And there is still no widely accepted definition of attention more concrete than that given in the James quote above. This lack of progress has led many observers to speculate that attention refers to many separate processes without a common mechanism.
Areas of active investigation involve determining the source of the signals that generate attention, the effects of these signals on the tuning properties of sensory neurons, and the relationship between attention and other cognitive processes like working memory. A relatively new body of research is investigating the phenomenon of traumatic brain injuries and their effects on attention. TBIs are a fairly common occurrence in a significant segment of the population and often result in diminished attention.
Concerning research of visual attention, the most prominent theories in cognitive psychology see attention as the set of processes enabling and guiding the selection of incoming perceptual information in order to limit the external stimuli processed by our bounded cognitive system and to avoid overloading it (Posner 1980[18]
; Lavie and Tsal 1994[19]
, Chun and Wolfe 2001[20]
). Attention can either be controlled voluntarily by the subject, or it can be captured by some external event. The former type of control mechanism is referred to as endogenous, or top-down, goal driven attention (Posner 1980; Yantis 1998[21]
). The latter type of mechanism is referred to as exogenous, bottom-up, or stimulus-driven and it may have different degrees of power so that certain stimuli become basically impossible to ignore (e.g. sudden luminance changes), whilst others are more controlled by volition. Chun and Wolfe (2001) explain that the endogenous attention is voluntary, effortful, and has a slow (sustained) time course; exogenous attention draws attention automatically and has a rapid, transient time course. However, exogenous and endogenous mechanisms are not independent but interact constantly so that the endogenous mechanism in place (e.g. what one is looking for in a visual field) may determine whether one will automatically be able to ignore certain exogenous stimuli.
1.5 Spatial theories of visual attention
Spotlight theory: An important property of visual processing is the ability to allocate processing resources or attend to locations in the visual field that might contain important information. Considerable research has been conducted to determine the spatial limits of visual attention when subjects are required to attend to information at a specified position in the visual field. B. A. Eriksen and C. W. Eriksen (1974) [22] presented subjects with five simultaneous items in visual displays. The subjects were required to respond to the middle item of each display and to ignore the adjacent noise elements that were present. The response specified by the adjacent set of elements was either compatible or incompatible with the response to the central target. By varying the spatial separation of the noise elements relative to the central target, the size of
focused attention could be measured. If the noise elements fell within the focus of attention, reaction time (RT) would be greater when they were incompatible with the response to the central target than when they were compatible. Using this paradigm, B. A. Eriksen and C. W. Eriksen (1974) found that the interfering effects of the incompatible noise elements decreased with greater spatial separations between the target and noise elements up to 10. In other studies containing similar paradigms, similar limits have also been found (C. W. Eriksen & Hoffman, 1973[23]; Hoffman & Nelson, 1981[24]; Posner, Nissen, & Ogden, 1978[25]). However, other studies have yielded evidence that the spatial limits of attention are greater than the 10 limit. LaBerge (1983) [26] presented subjects with displays containing letters that sometimes formed words. Some subjects were required to attend to single letters; other subjects were required to attend to entire words. The size of the focus of attention, as measured with a response target that varied in horizontal position, was larger for the subjects who were required to attend to words. LaBerge proposed that attention operated like a spotlight in the visual field. Items falling within the beam of this spotlight received processing priority over items not falling within the “beam” of attention.
Zoom lens theory: Since the advent of the initial spotlight theory (B. A. Eriksen and C. W. Eriksen, 1974), the ubiquitous ‘beam of attention’ has existed in several guises. One popular modification to the basic theory allows the previously fixed-width spotlight to vary in diameter according to the amount of attention one wishes to invest at any particular locus (e.g. Eriksen and Yeh, 1985[27]
; Eriksen and Murphy, 1987[28]
). This is often called the zoom lens theory of attention. Several other variants have been suggested in the previous, such as the ‘theatre’ of multiple spotlights (Sperling and Weichselgartner, 1995[29]
), or the concerns over the seeming ability to split focal attention into two separate spotlights. The greatest problem for spotlight theories of attention has come from the ‘object-based attention’ hypothesis. This suggests that we do not attend to an area of space; instead we attend to objects. Since the initial suggestion of object-based attention, a growing number of studies have demonstrated perceptual grouping on the basis of factors other than proximity and have argued against attending to a contiguous area of space.
The zoom lens analogy is the most relevant to the driving studies, as the majority of researchers in this field refer to the narrowing of attention, implying that the field of view of attention contracts according to processing demands at the point of fixation (Miura, 1990[30],
Williams, 1982, 1985, 1988[31], [32], [33]). Many researchers in related fields freely discuss the narrowing effects upon attention that occur under increased levels of demand or anxiety (e.g. Hammond, 2000[34]
), even though recent evidence for an actual shrinkage of spatial visual attention is tenuous at the very least (e.g. Janelle et al., 1999[35]
equal if not greater number of results pointing to a model of degradation that has previously been termed “general interference” (e.g. Crundall et al., 1999[36]
). This is represented by a general degradation that occurs equally for all extra-foveal stimuli regardless of their eccentricity from the point of fixation. The alternative model of a shrinking functional field of view, often termed ‘tunnel vision’ in applied contexts, if it exists at all, seems only to be produced under particular and stringent conditions. Williams (1988) stated that participants needed to be placed under three conditions in order to induce tunnel vision—a highly demanding foveal task, which increases the amount of processing required at the point of fixation; instructions to focus primarily on the central task rather than a peripheral task (despite the peripheral performance being the measure of prime interest); and speed stress on the primary task.
Gradient theory: Another variant of this approach is that the allocation of processing priority might vary according to the position of the items within the focus of attention. According to this view, targets that fall within the central regions of the spotlight would receive the greatest priority for processing, whereas items that are located farther away from this central position, but still fall within the spotlight of attention, would receive less priority for perceptual processing. Thus, the allocation of attention can be viewed as a gradient of processing (LaBerge & Brown, 1989[37]
; Andersen, 1990[38]
; Andersen & Kramer, 1993[39]
). 1.6 A three-dimensional space: Stereoscopic space and real space
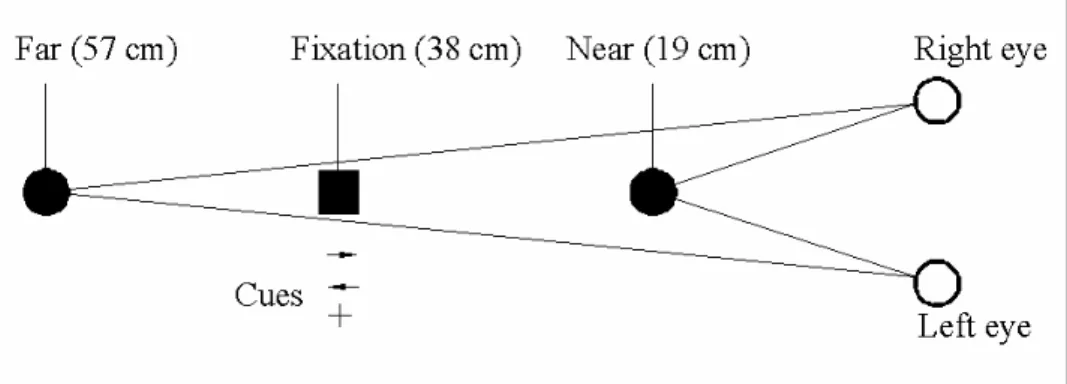
Attention researches in real space: Research on the size of focused attention has involved the investigation of processing limitations when an item at a specific location is attended to in a two-dimensional (2-D) display. Few researches have been designed to investigate the size of focused attention within a three-dimensional (3-D) scene. It should be mentioned that, however, there have been three studies in which the movement of attention (shifting the focus of attention from one location to another location) in a 3-D scene was investigated. Downing and Pinker (1985) (see Figure 1-8) required subjects to attend to the central position within an array of lights in a 3-D scene. The lights were organized along different visual directions in two rows located at different distances from the subject. A cue presented at the central location indicated the visual direction in which a light might appear. Responses were slower for targets positioned farther away than for closer targets. In addition, the cost of attending to farther targets increased with increased retinal eccentricity. They proposed that the mental representation underlying visual attention was similar to the 2½-Dsketch proposed by Nishahara (1978), in which depth and visual angle were important in the underlying representation.
Figure 1-8 Collocation of cue and stimuli in the experiment of Downing & Pinker
Gawryszewski, Riggio, Rizzolatti, and Umiltâ (1987) [40]
also investigated the movement of attention in depth. Subjects were presented with a central stimulus that cued the subject to a position along the same visual direction that was either closer or farther away than the central stimulus (see Figure 1-9). A response target was then presented at either of these two positions. On some of the trials, the central cue was valid, but on other trials, the cue was invalid. Mean RT were greater for invalid cues than for valid cues, suggesting that the subjects could not simultaneously attend to targets positioned at different distances.
Figure 1-9 Collocation of cue and stimuli in the experiment of Gawryszewski et al.
Miura, Shinohara & Kanda (2002) [41]
, base on their previous research on eye movements and useful field of view in real driving, investigated the influence of visual aids (e.g., automobile navigation systems) on driving safety, and mentioned the rapid and efficient switching of attention between the forward environment and the inside display of a car was crucial for safety. The characteristic of shifts of attention in depth for moving and stationary observers was examined by the use of an improved tunnel simulator. In their experiment, subjects moved at apparent speeds of 40 km/h or 80 km/h or were stationary, digital LEDs cue and stimuli were used at fixation point and targets location, the subjects’ task was judgment of the relative distance of targets (farther, nearer, or the same), in comparison with a fixation point (see Figure
1-10). Results demonstrated that reaction times for nearer targets were shorter than those for farther targets in all conditions.
Figure 1-10 Collocation of cue and stimuli in the experiment of Miura et al.
Two experiments were conducted in order to examine top-down and bottom-up controls of attention in three-dimensional space when observers were moving forward by Kimura, Miura, Doi and Yamamoto (2002) [42]
(see Figure 1-11). In their experiments, the cue about the location of a target by means of top-down information and three moving conditions were used, and bottom-up cue by brief change of luminance at target locations was presented in two moving conditions. Observers were required to judge whether the target presented nearer than fixation point or further than it. The results show that both top-down and bottom-up cue have the effect on reaction time, and that shift of attention were faster from far to near than the reverse. These findings suggest that (1) attention in 3-D might be operated with both top-down and bottom-up controls included the depth information, (2) the shift of attention in 3-D has an asymmetric characteristic in depth and it remarkably shown in observers were moving condition. Furthermore, it indicates that bottom-up and top-down controls do not operate independently, and top-down control might modulate bottom-up control.
Attention researches in stereoscopic space: In another type of research involving the effects of depth variations on attention, Nakayama and Silverman (1986)[43]
investigated the usefulness of depth information as a discriminating feature in a visual search task (see Figure 1-12). The target to be identified was embedded within a field of noise items in a stereoscopic display. If the target was located at a different depth plane than the noise items were, then the search for the target proceeded in parallel. This occurred for a variety of combinations of perceptual information used to define the noise items.
Figure 1-12 Collocation of stimuli in the experiment of Nakayama and Silverman
1.7 A few cases on visual attention research simulated traffic environment
Another research, using 39 MPEG hazard-perception clips randomly presented within four counterbalanced blocks by Crundall, Underwood and Chapman (2002) [44], explored the role of experience as a key factor in the potential narrowing of spatial attention, and the possibility of differences in the time course of attentional deployment (see Figure 1-13).
It was predicted that the amount of narrowing due to central processing demands would change as a function of driving experience, with more experienced drivers suffering less narrowing due to their mastery of central processing demands in road scenes. The data did not support the narrowing hypothesis, though they did support the alternative strategic difference between the driver groups in the time-course of attentional deployment. Learners seem to suffer attentional degradation in extra-foveal regions over a longer period of time whereas experienced drivers seem to invest peripheral attention at the hazard location in short but intense bursts.
Figure 1-13 A still from a hazard perception clip with the four target placeholders in the experiment of David Crundall et al.
Andersen & Ni (2005) [45]
examined the limits of spatial attention during driving using a dual-task performance paradigm (see Figure 1-14); drivers were asked to follow a lead vehicle that varied in speed while also detecting a light change in an array located above the roadway. Their results showed reaction time increased and accuracy decreased as a function of the horizontal location of the light change and the distance, from the driver, of the light change. In addition, reaction time error in car following increased immediately following the light change. These results demonstrate that when drivers attend to a centrally located task, their ability to respond to other events varies as a function of horizontal visual angle and distance in the scene, and was a result consistent with previous useful field of view studies as well as studies examining the spatial limitations of visual attention (e.g., Eriksen & Yeh, 1985), however, they found lower accuracy and long reaction time for detecting light changes positioned at greater distances. As distance increased, the spatial separation between the centrally located lead vehicle and the changing light was decreased.
Figure 1-14 Attention measurement systems in front view of the driving scene in the experiment of Andersen and Li
Figure 1-15 Attention search in differential background illuminance in the experiment of Ochiai and Sato
Concerning the effect of peripheral luminance and color of targets on reaction time of drivers’ visual attention in traffic environment, only a few literatures were reported, for example, Ochiai and Sato (2005) [46]
(see Figure 1-15), their results showed that the efficiency in searching for orange targets decreases as the number of distractors under different background luminance levels and illuminance conditions increases, whereas that for red and yellow targets barely decreased, differences in target colors have greater influence on visual search than the luminance contrast between a target and a background.
1.8 Purpose and significance
Although the reaction time of visual attention shifting was measured in many of previous investigations, most previous studies have addressed to measure the reaction time in 2-D space, and characteristics of depth attention in 3-D space remained unclear. The purpose of present study is to reveal characteristics of visual attention of drivers in 3-D space under traffic environment. That is, whether there are also same characteristics of visual attention in 3-D space compared with 2-D space, in particular, the depth visual attention characteristic (e.g., asymmetry in depth). In addition, visual function including depth information of visual attention will be also reveal under different observing conditions and peripheral luminance environment.
In present study, we used a three-dimensional visual attention measurement system which can simulate speeds of car, brightness of traffic environment; color signals etc. (1) Three types of subjects will take part in experiments: young students, young students simulated low-visual and elderly peoples. (2) There are two observing conditions: static and dynamic conditions; (3) There are three cue locations: valid, invalid and neutral locations.
One of purpose of present study is that when peripheral environment illuminance will change, young subjects present the characteristics of attention in depth. The background illuminances are: bright (460-680 lx), twilight (95-135 lx) and dawn (6-8 lx) conditions, respectively. That is, whether background illuminance will influence depth attention. Furthermore, we will discuss whether the direction of attention switching has an asymmetry in real space. Second of purpose is that what are differences of attention of elderly subjects comparing with young subjects.
In addition, third of purpose is to research the importance of prior awareness of location (valid and invalid) and prior feature information (color, shape, orientation) for target.
Study of visual attention in 3-D space is a very important work in which cognitive information processing are clarified in our real life. In order to comprehend the relationship between our behaviors and visual attention in real world, it is necessary to reveal visual attentional principium, for example, attention control and attention shifting as well as allocation of attentional resource etc. Furthermore, which way will influence our visual cognition and judgment performance is also a very importance.
Chapter 2 Experimental Procedure
2.1 Introduction
Eye is like a camera (see Figure 2-1). The external object is seen like the camera takes the picture of any object. Light enters the eye through a small hole called the pupil and is focused on the retina, which is like a camera film. Eye also has a focusing lens, which focuses images from different distances on the retina. The colored ring of the eye, the iris, controls the amount of light entering the eye. It closes when light is bright and opens when light is dim. A tough white sheet called sclera covers the outside of the eye. Front of this sheet (sclera) is transparent in order to allow the light to enter the eye, the cornea. Ciliary muscles in ciliary body control the focusing of lens automatically. Choroid forms the vascular layer of the eye supplying nutrition to the eye structures. Image formed on the retina is transmitted to brain by optic nerve. The image is finally perceived by brain. A jelly like substance called vitreous humor fill the space between lens and retina. The lens, iris and cornea are nourished by clear fluid, aqueous humor, formed by the ciliary body and fill the space between lens and cornea. This space is known as anterior chamber. The fluid flows from ciliary body to the pupil and is absorbed through the channels in the angle of anterior chamber. The delicate balance of aqueous production and absorption controls pressure within the eye.
2.1.1 Adjusting for light and focusing
The eye needs to be able to control the amount of light entering it. In dim conditions, more light is allowed to enter so that a clear image can be formed on the retina. In bright conditions less light is allowed to enter so that the retina is not damaged.
This adjustment is done by two sets of muscles in the iris: its circular muscles contract to close up the iris, making the pupil smaller - while its radial muscles contract to open up the iris, making the pupil larger. You can see how this reflex action works in the animation.
Bright light Radial muscles of iris relaxed Circular muscles of iris contracted. Contracted pupil (less light enters eye)
Dim light Radial muscles of iris contracted Circular muscles of iris relaxed Dilated pupil (more light enters eye) Figure 2-2 Iris reflex in bright conditions Figure 2-3 Iris reflex in dim conditions
2.1.2 Focusing
Light from an object is reflected in all directions. Some of it enters the front of the eye-the transparent cornea - and is refracted as it meets its curved surface. It then goes through the pupil, and enters the lens. At the lens it is refracted again - this time with fine adjustments to ensure the image focused onto the retina is sharp. From the retina the impulses are taken by the optic nerve to the brain for processing. (The image projected onto the retina is actually upside down, but the brain takes care of this so that we 'see' it the right way up.)
When light travels to the eye from a distant object, the rays are almost parallel and need to be bent very little to be brought to a focus. So when viewing a distant object, the lens must be made thinner and less convex. This is done by:
• relaxing the ciliary muscles
• stretching the suspensory ligaments, and
• increasing the muscular tension on the lens.
Figure 2-5 The ability of the lens at far place
When light travels from a near object the rays are going away from each other and need to bend a lot more to be brought to a focus. So when viewing a near object the lens needs to be made fatter and more convex. This is done by:
• contracting the ciliary muscles
• slackening the suspensory ligaments, and
• reducing the muscular tension on the lens.
2.1.3 Accommodation: The ability of the lens to change its shape to focus near and distant objects is called accommodation. The Table 2-1 shows how this is done.
Table 2-1 Reflex action course in near and far places
Object Ciliary muscles Suspensory ligaments Muscle tension on lens Lens shape
near contract slackened low fat distant relax stretched high thin
2.2 Experimental procedure
The visual functions of the subjects in present study must be tested, including two-dimensional (2-D) and three-dimensional (3-D) visual functions. Only subjects with normal visual functions can be selected as the experimental participators in the Experiment 1 to Experiment 4. Figure 2-7 show the visual functions composition of human in 2-D and 3-D space.
Target track
Target attack
Cue: Valid · Invalid · Neutral
Peripheral illuminance: Bright · Twilight · Dawn
Color: Red · Green
Static Visual Acuity (SVA)
Depth Perception (DP) Dynamic Visual Acuity (DVA) Dynamic Visual Check (DVC) Kinetic Visual Acuity (KVA) Characteristics of attention in 2-D space
Characteristics of depth attention in 3-D space
Figure 2-7 Visual functions composition of human attention
2.2.1 Test of visual functions of young subjects in 2-D space
The visual functions of the subjects include ambience adaptability and moving adjustability. Ambience adaptability (a1) is the ratio of mesopic vision to photopic vision; it was tested using
multifunctional sight inspection apparatus STN-04 (see Figure 2-8), mesopic vision and photopic vision of the subjects can be tested using it. Moving adjustability (a2) is the ratio of kinetic visual
acuity to static visual acuity; it was tested using dynamic visual measurement apparatus AS-4D (see Figure 2-9), and dynamic visual check system MMO-DVC-2011 (see Figure 2-10). Kinetic visual acuity and static visual acuity of the subjects can be tested. The sum of a1 and a2 is the
a1 = mesopic vision / photopic vision (1)
a2 = kinetic visual acuity / static visual acuity (2)
a = a1 + a2 (3)
Figure 2-8 Multifunctional sight inspection apparatus Figure 2-9 Kinetic visual measurement apparatus (STN-04) (AS-4D)
Figure 2-10(b) Target track program Figure 2-10 (c) Scene of visual target attack and track testing
MMO-DVC-2011
clude dynamic discrimination (target attack and rget track), ambience adaptability (mesopic vision and photopic vision) and moving
low visual adaptability subjects from high visual adaptability subjects isual high visual adaptability group.
(1)
ested by the use of a dynamic visual
isted of three testing experiments. Subjects
Figure 2-10(a) Target attack program
2.2.1.1 Test method
Testing of visual function of the subjects in ta
adjustability (kinetic visual acuity and static visual acuity), in which the subjects will be divided , that is, low v adaptability group and
Subjects: 15 undergraduate and graduate students of Faculty of Engineering of Kagawa University, whose age vary from 19 to 22 years old.
(2) Apparatus: Using a multifunction sight inspection apparatus (STN-04: Institute of complex medical engineering), mesopic vision and photopic vision of subjects were tested. Kinetic visual acuity and static visual acuity of subjects were t
measurement apparatus (see Figure 2-8 and Figure 2-9). (3) Procedure: The prearrangement experiments cons
were provided with information on display or experimental screen about where targets would present, and reacted accordingly. The subject’s task was to judge the sign (shape) of stimulus