著者
KAMIURA, Masaki
引用
北海学園大学工学部研究報告(38): 1-11
An Improvement Approach for Portable FWD
Masaki K
AMIURA* AbstractThe stiffness of subgrades of roads plays a major role in the structural stability of pavement structures. It has been regarded that the values of stiffness determined by using Portable FWDs is larger than that determined by Plate Bearing Test devices for loading plates of the same size and the same peak value of deflection. The focus of this study is on the investigation of the fac-tors influencing this difference. A rubber plate and a torus-shaped iron plate combining a contact pressure measurement device were developed as a part of this study. The important conclusions and findings of this study are the distribution of contact pressure on the rubber plate was not af-fected by the torus-shaped iron plate, but it was dependent on the loading condition such as static loading or dynamic loading and it was found that the damping of gravel is related to a substantial part of increase in the conversion coefficient due to the use of the PFWD/PBT device from static and dynamic FEM analyses.
1.Instruction
The stiffness of subgradess of roads plays an important role in the structural stability of pavement structures. The recent developments in portable FWD (PFWD), which is similar to LWD and can be used under dynamic loading conditions, have made it possible to directly measure the stiffness of pavement structures during the construction itself. Deflectometer−type devices are dynamic nonde-structive testing tools and are commonly utilized in the in−situ characterization of pavement systems. During testing, an impact load is applied on the pavement surface using these devices, and the in-duced pavement surface motion is monitored. Multiple versions of these devices have been tested in Japan, U.S., and Europe and used for quality control during construction. PFWD and LWD vary de-pending on the manufacturing company and the country of development and production ; however, except for the positioning of sensors (acceleration sensors or geophone sensors), their basic mechani-cal operation remains almost the same. These devices consist of three parts : (a) a base with a loading plate, a load cell, and a displacement sensor and associated elements, (b) a loading weight, and (c) rubber buffers and a guidance rod. Users have the option of selecting loading plates of different
ameters : 100mm, 200mm, or 300mm. An acceleration sensor or a geophone sensor is mounted at the center of the loading plate to measure the surface displacement. A data acquisition system is used to assess the stiffness of the ground by monitoring the surface settlement under the plate and the contact stress.
In Europe and U.S., most of the PFWDs or LWDs are developed on the basis of Boussinesq’s elas-tic theory, and the assumption of stress distribution is used to calculate the elaselas-tic modulus from the measured contact stress and peak deflection under the loading plate. In Japan, the stiffness parameter of subgrades is estimated using K30that is determined from a plate−bearing test (PBT). The K value is utilized by introducing the elastic stiffness modulus in the simple elastic theory ; this elastic stiffness modulus is defined by the contact pressure p (p = P/A, where P = force applied on the loading plate (N) ; A = area of the loading plate (mm2), and d = deflection of the loading plate (mm ; d=1.25mm for a loading plate of diameter 30 cm)). Although the PBT is widely used in Japan, it is increasingly being replaced by PFWD tests because the latter is easier. The subgrade benchmark value KPFWD, de-termined by using PFWD, is estimated from the contact pressure and the deflection of the PFWD loading plate. Since the PFWD loading conditions affect the stiffness evaluation, a conversion coeffi-cient is required for K30(Kamiura 2000). Equation (1) is obtained by statistical analysis.
#"!!#,"%!
! (1)
Where,!(conversion coefficient), !=1 (cray), !=1.5 (sand), !=2 (gravel)
The conversion coefficients for typical examples of soils such as clay, sand, and gravel have been estimated (JSCE2002). Equation (1) implies that the loading force measured by using a PFWD is larger than that measured by a PBT device for loading plates of the same size and the same peak value of deflection. On the basis of this, we obtain equation (2).
$-.&.)'!$(/+&*)'
! (2)
where$-.&.)'= peak value of load applied using the PBT device and$(/+&*)'= peak value of load applied using the PFWD.
Some trials have been carried out to study the factors affecting the conversion coefficient. Hirak-awa (2008) took particular note of the deflection velocity of the loading plate in his study since dy-namic loading affects the contact stress.
2. Focus of this study
The contact pressure between the loading plate and the ground surface depends on the pressure
dis-Masaki KAMIURA
tribution on the loading plate and the stress distribution of the subgrade. The significant differences in the peak vertical stress observed at shallow depths in different soils can be explained by the presence of different contact stress distributions between a rigid plate and clay or sand soil (Bell 2004). Ter-zaghi (1943) theorized that the contact stress distribution between a rigid plate and the soil depends on the soil type. He suggested that the stress distribution of a rigid circular plate has an inverse para-bolic profile. Equation (3) is derived from Terzaghi’s elastic theory.
!###"!!" " $ %""
#"$"% (3)
where!#= gravel modulus (MPa),# = stress distribution factor (−), " = peak value of load (N), $= radius of the loading plate (mm), and "= Poisson’s ratio (−).
The magnitude of#depends on the stress distribution under the rigid plate with respect to that of the underlying medium. According to Boussinesq,###!"for a rigid plate and ##"for a flexible plate for a uniform stress distribution (Gurp 2000). In practice, a plate can be neither completely rigid nor perfectly flexible. Therefore, the average of the two values, 1.8, would be a good approximation (George 2006).
Then, if the peak value of load is considered to be independent of the loading time in Terzaghi’s elastic theory, the gravel modulus estimated using equation (3) is found to be independent of the loading condition (dynamic loading or static loading). However, the peak value of load is found to be dependent on the loading condition from equation (2). Therefore, two concepts are proposed accord-ing to dependence of the peak value of load on the loadaccord-ing condition.
We consider that the peak value of load is dependent on the loading condition. In this study, we fo-cus on the investigation of the factors affecting the conversion coefficient in equation (1).
3. Test equipment
3.1 Rubber plate
It was discussed in the previous section that dynamic loading force measured by a PFWD is larger than the static loading force measured by a PBT for loading plates of the same size and the same peak value of deflection for a gravel subgrade. It is important to study the quasi−velocity of the load-ing plate deflection since dynamic loadload-ing affects the contact stress. In this study, a natural rubber plate (Figure 1) is introduced during the determination of the quasi−velocity of the loading plate de-flection under dynamic loading by using a PFWD and under static loading by using a PBT. This rub-ber plate has an international rubrub-ber hardness degree of 70 and its length, width, thickness, and weight are 1m, 1m, 0.3m, and 700kN, respectively.
3 An Improvement Approach for Portable FWD
Passive Iron
Active Zone Passive
Loading Plate Iron
3.2 Gravel subgrade test pit
The loading tests were performed in the gravel subgrade test pit. The water content, wet density, and dry density of the gravel were 2%, 1.65g/cm3, and 1.3g/cm3, respectively. The length, width, and depth of the gravel subgrade test pit were 1.5m×1.5m×1m. The layer of the gravel soil in the pit was made uniform by using a vibration exciter.
3.3 Torus−shaped iron plate
When a load is applied on the ground soil, the soil layer gets deformed by the well−known Prandtl mechanism, as shown in Figure 2. A circular loading plate forms a boundary for the continuous dis-placement field beneath the plate. The shear distribution in this boundary can be divided into three zones. These regions undergo shearing and deformations compatibly and continuously with no relative sliding of their boundaries. Consequently, the gravel subgrade beneath the wedge is forced down-wards and outdown-wards, with plastic bulging taking place within the regions. The gravel around the load-ing plate is displaced away from the plate, and shear forces propagate outward from the apex of the wedge, as shown by the dashed line in Figure 2. Terzaghi’s elastic theory cannot explain this plastic
Fig.1 Rubber Plate
Fig.2 Prandtl mechanism in soil deformation
Masaki KAMIURA
Fig.3 Torus shaped iron plate
bulging taking place close to the edge of the loading plate. A torus−shaped iron plate (Figure 3 ) is introduced to inhibit the transfer of plastic bulging near the edge of the loading plate. The inner and outer diameters of the torus−shaped iron plate shown in Figure 3 are 30cm and 70cm, respectively. This plate is 3−cm thick and weighs 300N.
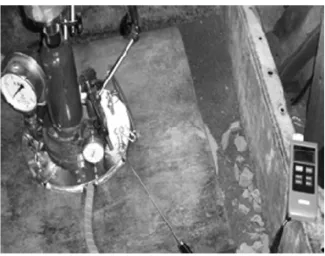
3.4 Contact pressure measurement device and loading devices
The contact pressure distribution on the loading plate was estimated by using 10 pressure sensors with a maximum capacity of 500kPa placed on the contract surface of the loading plate, as shown in Figure 4. The PFWD used in this study is shown in Figure 2 ; a PFWD is used in this study because it is easy to use it for the estimation of the in−situ bearing capacity of subgrades. Since it weighs only 15kg, it is portable as compared to PBT devices ; PBT devices are normally equipped with a 300−mm
Fig.4 Contact pressure measurement device
5 An Improvement Approach for Portable FWD
㩿㫊㫋㪼㫇㩷㪈㪀 㩿㫊㫋㪼㫇㩷㪉㪀 㩿㫊㫋㪼㫇㩷㪊㪀 㩿㫊㫋㪼㫇㩷㪋㪀 㩿㫊㫋㪼㫇㩷㪌㪀 㩿㫊㫋㪼㫇㩷㪍㪀 㩷 㪈㪇㪺㫄 㪈 㪉㪇㪺㫄 㩷 㪊㪇㪺㫄 㪉 㪋㪇㪺㫄 㪌㪇㪺㫄 㪊 㪋 㪌 㪈㪄㪌㪑㩷㪞㪼㫆㫊㫋㪸㫋㫀㪺㩷㫊㫋㫉㪼㫊㫊㩷㫊㪼㫅㫊㫆㫉㫊
Fig.5 Location of Geostatic stress sensors circular loading plate and a 50−kN hydraulic jack (Figure 1).
3.5 Vertical stress measurement system
A stress measurement system with geostatic stress sensors (diameter : 100mm, thickness : 20mm, maximum capacity : 200kPa) was used to monitor the behavior of stress distribution in an in−situ test pit. Theses sensors were located at depths of 10cm, 20cm, 30cm, 40cm, and 50cm. The positions of the measuring devices are shown in Figure 5. No sensors were overlapped in a vertical direction to inhabit an upper gauge acting on the other lower gauges.
4. Test results
4.1 Contact pressure
4.1.1 Rubber plate
A rubber plate, made of a uniform and viscoelastic material, was introduced in the loading tests. The contact pressure values measured using the conventional method (hereafter, called as the N method) and the method using the torus−shaped iron plate (hereafter, called as the T method) were compared. Moreover, two types of loading devices (PBT device and PFWD) were used for the esti-mation of stiffness. Figures 6 and 7 show that there is no marked difference between the results of the N method and the T method. However, it has been confirmed that most of the contact pressure values measured by the PFWD are higher than those measured by the PBT device. The mean loading weight applied using the PFWD is almost twice that applied using the PBT device. This indicates that the distribution of contact pressure is unaffected by the torus−shaped iron plate. However, it is af-fected by the loading condition such as static loading or dynamic loading.
Masaki KAMIURA
㪇 㪌㪇 㪈㪇㪇 㪈㪌㪇 㪉㪇㪇 㪇 㪌 㪈㪇 㪈㪌 㪧㫆㫊㫀㫋㫀㫆㫅㩷㩿㪺㫄㪀 㪚㫆㫅㫋㪸㪺㫋㩷㫇㫉㪼㫊㫊㫌㫉㪼㩷㩿㫂㪧㪸㪀 N methodT method ٤ޓ ٨ޓ 㪇 㪌㪇 㪈㪇㪇 㪈㪌㪇 㪉㪇㪇 㪇 㪌 㪈㪇 㪈㪌 㪧㫆㫊㫀㫋㫀㫆㫅㩷㩿㪺㫄㪀 㪚㫆㫅㫋㪸㪺㫋㩷㫇㫉㪼㫊㫊㫌㫉㪼㩷㩿㫂㪧㪸㪀 N method T method ٤ޓ ٨ޓ 㪇 㪈㪇㪇 㪉㪇㪇 㪊㪇㪇 㪋㪇㪇 㪌㪇㪇 㪇 㪌㪧㫆㫊㫀㫋㫀㫆㫅㩷㩿㪺㫄㪀㪈㪇 㪈㪌 㪚㫆㫅㫋㪸㪺㫋㩷 㫇㫉㪼㫊㫊㫌㫉㪼㩷㩿㫂㪧㪸㪀 N method T method ٤ޓ ٨ޓ 4.1.2 Gravel subgrade
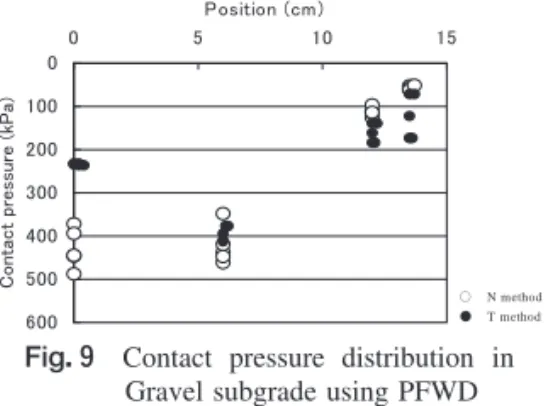
The loading tests using the PBT device and PFWD were performed in the gravel subgrade test pit described in the previous section. As shown in Figure 8, in the N method, the contact pressure de-creases with increasing distance from the center. In the T method, the contact pressure dede-creases with increasing distance from the center up to 12cm and increases beyond this point. On the other hand, Figure 9 shows a completely different behavior. In the N method, the contact pressure remains rela-tively constant from the center to a distance of 6cm. However, in the T method, the contact pressure is maximum at 6cm. These results indicate that the torus−shaped iron plate is effective in distributing
Fig.6 Contact pressure distribution in rubber
plate using PBT
Fig.7 Contact pressure distribution in rubber plate
using PFWD
Fig.8 Contact pressure distribution in Gravel
subgrade using PBT
7 An Improvement Approach for Portable FWD
㪇 㪈㪇㪇 㪉㪇㪇 㪊㪇㪇 㪋㪇㪇 㪌㪇㪇 㪍㪇㪇 㪇 㪌 㪈㪇 㪈㪌 㪧㫆㫊㫀㫋㫀㫆㫅㩷㩿㪺㫄㪀 㪚㫆㫅㫋㪸㪺㫋㩷㫇㫉㪼㫊㫊㫌㫉㪼㩷㩿㫂㪧㪸㪀 N method T method ٤ ޓ ٨ޓ 㪇 㪇㪅㪌 㪈 㪈㪅㪌 㪇 㪌 㪈㪇 㪈㪌 㪧㫆㫊㫀㫋㫀㫆㫅㩷㩿㪺㫄㪀 㪩㪼㪸㪺㫋㫀㫆㫅㩷㪽㫆㫉㪺㪼㪆㫌㫅㫀㫋 㫃㪼㫅㪾㫋㪿㩿㫉㪸㪻㫀㪸㫃㪀㩿㫂㪥㪆㪺㫄㪀 㩷㪥㩷㫄㪼㫋㪿㫆㪻 㩷㪫㩷㫄㪼㫋㪿㫆㪻 㪙㫆㫌㫊㫊㫀㫅㪼㫊㫈
Fig.10 Distribution of reaction force par unit length in
Gravel subgrade using PBT
contact pressure inside the loading plate near its edge.
4.2 Reaction force
As described previously, contact pressure decreases with increasing distance from the center by the use of the PBT device and PFWD. Since it is assumed that the reaction force remains the same along concentric circles, it is important to investigate the main area over which reaction forces are acting for summing the reaction forces over the entire surface.
Figure 10 presents the results of the loading tests performed by using the PBT device. This figure shows the relationship between the reaction force per unit length along the radial direction and the position on the gravel subgrade.
Interestingly, it was found that the reaction forces at distances below 7cm from the center were al-most the same in the N method and the T method. Further, as the distance from the center increased above 7 cm, the reaction force in the N method reduced, while that in the T method increased.
On the other hand, the reaction forces calculated using Boussinesq’s elastic theory were almost similar to those calculated using the T method. This implies that the torus−shaped iron plate is effec-tive in inhibiting the transfer of plastic bulging near the edge of the loading plate.
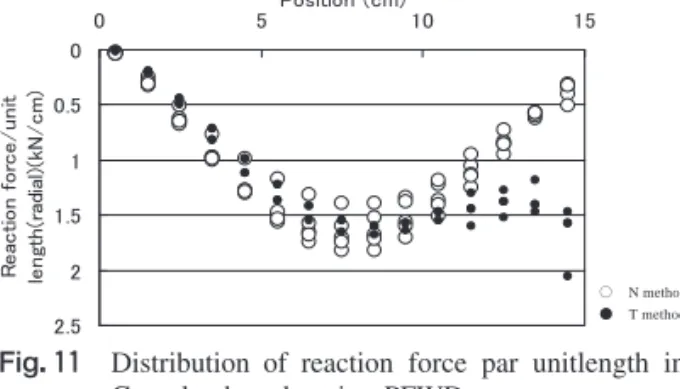
Figure 11 shows the results of the loading tests performed by using the PFWD. The conditions in
Fig.9 Contact pressure distribution in
Gravel subgrade using PFWD
Masaki KAMIURA
㪇 㪇㪅㪌 㪈 㪈㪅㪌 㪉 㪉㪅㪌 㪇 㪌㪧㫆㫊㫀㫋㫀㫆㫅㩷㩿㪺㫄㪀㪈㪇 㪈㪌 㪩 㪼 㪸㪺 㫋㫀 㫆㫅㩷㪽 㫆 㫉㪺㪼㪆 㫌㫅㫀 㫋 㫃㪼㫅㪾 㫋㪿 㩿㫉 㪸㪻 㫀㪸 㫃㪀 㩿㫂 㪥 㪆㪺㫄 㪀 N method T method ٤ޓ ٨ޓ
Rubber Plate Gravel subgrade
N method 8.1 2.2
T method 8.1 1.9
Table1 Conversion coefficient by PFWD/PBT
this figure are the same as those in Figure 9. It was found that the reaction forces at distances below 9 cm were almost the same in the N method and T method. At distances greater than 9cm, the reac-tion force using the N method reduced, while that using the T method increasd. The reacreac-tion force in-creases progressively near the edge of the loading plate. This implies that the torus−shaped iron plate is effective in inhibiting the transfer of plastic bulging near the edge of the loading plate.
4.3 Increase in conversion coefficient by use of PFWD/PBT device
One of the objectives of this study is to investigate the factors that affect the conversion coefficient determined by using a PFWD/PBT device. Table 1 shows the conversion coefficients determined us-ing the PFWD/PBT device, the rubber plate, and the gravel subgrade. The results show that the con-version coefficient decreases by nearly 15% by the use of the torus−shaped iron plate. This indicates that the rate of increase in the conversion coefficient defined by the loading force ratio PFWD/PBT was 15% that deal with the plastic bulging near the edge of loading plate.
5. FEM analysis of viscoelasticity of gravel subgrade
There are two approaches to backcalculate the layer moduli from the PFWD data : a static method that uses peak values of both loading and surface deflection and a dynamic method that uses time his-tories of loading and surface deflection. The dynamic method is usually used to examine the viscoe-lasticity of soils. The FEM used in this study was developed to analyze time−domain viscoelastic is-sues (Dong2003). A two−dimensional axisymmetric model was developed for a homogeneous linear
Fig.11 Distribution of reaction force par unitlength in
Gravel subgrade using PFWD
9 An Improvement Approach for Portable FWD
㪇 㪈㪇 㪉㪇 㪊㪇 㪋㪇 㪌㪇 㪍㪇 㪇 㪉㪇㪇 㪋㪇㪇 㪍㪇㪇 㪏㪇㪇 㪭㪼㫉㫋㫀㪺㪸㫃㩷㫊㫋㫉㪼㫊㫊㩷㩿㫂㪧㪸㪀 㪻㪼 㫇㫋㪿 䇭 㩿㪺 㫄 㪀 㪝㪜㪤㩷㪪㫋㪸㫋㫀㪺 㪝㪜㪤㩷㪛㫐㫅㪸㫄㫀㪺 㪧㪙㪫 㪧㪝㪮㪛
Fig.12 Vertical stress dispersion measurements
and the FEM analysis results
Elastic modulus (MPa) Poison ratio Damping coefficient (kNs/m)
Plate Bearing Test 85.3 0.30 0.04
PFWD 170.5 0.30 0.09
Table2 Sample table elastic half−space.
In this theory, the following equation is adopted:
%&#!#$!"&#!#$!$&!#$"# !#$ (4) &#!#$"! &!#$"!
where%, ", and $ denote the mass, damping, and stiffness matrixes, respectively ; &#!#$, &"!#$, and&!#$denote acceleration, velocity, and displacement variables, respectively ; and # !#$denotes a loading vector. In the finite element analysis under dynamic loading conditions, the relation between the load and the loading time for the PFWD was used for defining the force vector# !#$.
The relationship between the results of the vertical stress distribution measurement and the FEM analysis is shown in Figure 12. It is observed that the results of FEM analysis and the tests using the PFWD are in a fairly good agreement under the dynamic loading condition. Similarly, under the static loading condition, the results of the FEM analysis and the PBT are in a good agreement. Table 2 shows the characteristic data used in the FEM analysis. It is found that damping coefficient in the case of the PFWD is more than twice that in the case of the PBT device. It can be said that the damping of gravel is related to a substantial part of increase in the conversion coefficient by the use of the PFWD/PBT device.
6. Summary and Conclusions
The performance and service life of pavements depend on the stiffness of the subgrades used. The stiffness of subgrades of roads plays a major role in the structural stability of pavement structures.
Masaki KAMIURA
The recent developments in PFWDs have made it possible to directly measure the stiffness of pave-ment structures during the construction itself. It has been regarded that the values of stiffness deter-mined by using PFWDs is larger than that deterdeter-mined by PBT devices for loading plates of the same size and the same peak value of deflection. The focus of this study is on the investigation of the fac-tors influencing this difference.
Two new devices combining a contact pressure measurement device were developed as a part of this study. One of the devices was a rubber plate that is regarding to quasi−velocities since the dy-namic loading affects the contact stress. The other was a torus−shaped iron plate that was introduced to inhibit the transfer of plastic bulging near the edge of the loading plate.
The important conclusions and findings of this study are listed below :
! The distribution of contact pressure on the rubber plate was not affected by the torus−shaped iron plate, but it was dependent on the loading condition such as static loading or dynamic load-ing.
! The torus−shaped iron plate was effective in distributing contact pressure inside the loading plate, near its edge,
! The rate of increase in the conversion coefficient defined by the loading force ratio PFWD/PBT was 15% that deal with the plastic bulging near the edge of loading plate.
! From static and dynamic FEM analyses, it was found that the damping of gravel is related to a substantial part of increase in the conversion coefficient due to the use of the PFWD/PBT device.
References
1. F. G. Bell. (2004). Engineering geology and construction, Spon Press, London and New York.
2. C. v. Gurp, Groenen, J. and Beuving. E., (2000). Experience with various types of foundation tests, Proceedings of
the 5th International Symposium on Unbound aggregates in roads, A. R. Dawson, UK, pp.239−246.
3. K. P. George. (2006). Portable FWD (PRIMA 100) for in−situ subgrade evaluation, Final Report (U. S. DOT FHWA
& MDOT ), The University of Mississippi, Mississippi.
4. Kamiura, M., Sekine, E., Abe, N and Maruyama, T. (2000). Stiffness evaluation of the subgrade and granular aggre-gates using the portable FWD, Unbound Aggreaggre-gates in Road Construction, Proceedings of the5th International
Sym-posium on Unbound aggregates in roads, A. R. Dawson, UK, pp.217−237.
5. Hirakawa. D, Tatsuoka, F. (2008) : Investigation of relationship between sand ground stiffness values from FWD and from plate loading tests Japanese Geotechnical Journal , Vol .3, No.4,. pp307−320 (Japanese)
11 An Improvement Approach for Portable FWD