ABSTRACT
As part of a case study of two adult Japanese learners of English, the present study investigated how they learned to use acoustic cues to differentiate English stressed and unstressed syllables through a pronunciation training program. The acoustic cues included F0, intensity, duration and vowel quality (F2-F1). They received pronunciation training focused on English syllable structure, word and sentence stress, consonants and vowels, coupled with reading and speaking practice with special attention to prosody. The results showed that the Japanese learners were able to learn to use F0 and intensity as the acoustic cues, but that it was much more difficult to learn to use duration and vowel quality. Possible accounts of the results and implications for teaching pronunciation are discussed.
key words; pronunciation training, nonnative speech production, prosody, pitch, stress
1. Introduction
It is well known that learners of a second language (L2) speak with varying degrees of foreign accents, with both segments (e.g., phonemes) and prosody (e.g., rhythm, intonation) affected by their first language (L1). Previous research has indicated that L2 speech processing (i.e., perception and production) is largely constrained by the L1 phonological structure, especially at an initial stage of learning (Best, 1995). In perceiving
A case study: How do Japanese learners of English
learn to use acoustic cues to differentiate stressed
and unstressed syllables in pronunciation training?
speech, for example, L2 listeners fail to attend to phonologically relevant acoustic cues in the L2, and fail to ignore those that are distinctive in their L1 (e.g., Miyawaki, Strange, Verbrugge, Liberman, & Jenkins, 1975). It has been demonstrated, however, that nonnative speech processing can be modified to a certain extent through L2 learning in the environment where the target language is spoken (e.g., Aoyama & Flege, 2011), or through perception and production training (e.g., Tsushima, 2008). It has been found, for example, that some L2 learners can attain pronunciation ability comparable to a native level even when they start learning the target language as adults (e.g., Bongaerts, 1995). The present study attempted to investigate whether and how Japanese learners of English can modify their ability to produce one property of prosody in English, lexical stress, through long-term, individual-based speech training.
Previous research has indicated that prosody has significant impact on degree of accentedness, intelligibility and comprehensibility of L2 speech (Derwing, Munro, & Wiebe, 1998). English is categorized as a stress-timed language where duration between the beginning of the stressed syllable and that of the following one is held constant. Japanese, on the other hand, is categorized as a mora-timed language where duration of each mora is held constant. It has been shown that Japanese learners of English produce stress-related durational patterns of English in a way affected by their L1 mora-timed rhythm (Bond & Fokes, 1985; Mochizuki-Sudo & Kiritani, 1991). Bond & Fokes (1985), for example, found that Japanese speakers tend to produce English syllables with similar duration, regardless of whether the syllables are stressed or unstressed.
One of the major factors associated with the stress-timed rhythm in English is lexical stress where a multi-syllable word consists of alteration of stressed and unstressed syllable. For example, the word, “factor”, is made up of the first stressed syllable, “fac [fæk]”, and the second unstressed syllable, “tor [tər]”. English lexical stress manifests itself through some combination of acoustic properties including fundamental frequency (F0), intensity, vowel duration and vowel quality (Beckman, 1986; Fear, Cutler, & Butterfield, 1995; Sluijter, van Heuven, & Pacilly, 1997). Relative to stressed syllables, unstressed syllables are lower in F0, lower in intensity, shorter in duration and more reduced in vowel quality. Reduced vowels are normally central vowels (i.e., schwa: [ə]), which have mid-frequency values of the first and second formant (F1 and F2), and are subject to coarticulation with neighboring consonants (Browman & Goldstein, 1992). Previous research has reported varying degrees of relative strength as a cue to English lexical stress among the four acoustic parameters (Beckman, 1986; Cooper, Cutler, & Wales,
2002; Fear et al., 1995; Huss, 1978; Sluijter et al., 1997; Yu & Andruski, 2010; Yanhong. Zhang & Francis, 2010).
In English, perception of lexical stress plays an important role in segmentation of speech and location of word boundaries (Cutler, 2005, 2012; Tyler & Cutler, 2009). Nonnative listeners may have difficulty correctly perceiving English stress, with their performance influenced by the acoustic cues utilized in perception of stress in their native language (Cooper et al., 2002; Cutler, 2009; Tyler & Cutler, 2009; Watanabe, 1988). Watanabe (1988), for example, suggested that Japanese listeners primarily use pitch (rather than intensity or duration) as the cue for perception of English stress. It is inferred that their failure to use intensity and duration as the cue might be due to the fact that lexical stress is primarily cued by pitch change in Japanese. In production, nonnative speakers have difficulty in producing English stress with appropriate lexical stress cues, which results in detectable foreign accent (Flege & Bohn, 1989; Fokes & Bond, 1989; Y. Kondo, 2000; Lee, Guion, & Harada, 2006 ; Yanhong. Zhang & Francis, 2010; Y. Zhang, Nissen, & Francis, 2008).
Regarding nonnative production of English lexical stress, Kondo (2000) investigated vowel quality of English unstressed syllables (i.e., schwa) produced by Japanese learners of English (i.e., two groups of more fluent and less fluent learners) and native speakers, acoustically examining the coarticulatory patterns with their neighboring segments. It was found that the coarticulatory pattern of L1 was transferred to production of schwa among the group of less fluent Japanese speakers. Specifically, the distribution of F2 values was not significantly different from that of Japanese vowel, /ɑ/, which is normally substituted in production of English schwa. It was also found that the mean duration of schwa produced by native speakers was significantly longer than that of the Japanese groups. Lee et al. (2006) investigated acoustic characteristics of English unstressed vowels produced by early and late Korean and Japanese bilinguals who were advanced speakers, used English on a daily basis and have attended universities in the USA. Acoustic differences between stressed and unstressed syllables were examined for pitch, intensity, duration and vowel quality (F1 and F2). The results showed that the Japanese speakers were native-like in production of pitch, intensity and duration. It was also found that late Japanese bilinguals showed vowel quality reduction which was deviant from that of native speakers, although early Japanese bilinguals were close to, but not comparable to, native-like.
English lexical stress can be modified through classroom instruction and individual speech training (Binghadeer, 2008; Couper, 2006; Nagamine, 2011; Tsushima, 2014). Tsushima (2014) conducted a case study where two learners of English (the same participants as in the present study) were trained to improve their production of English segments and prosody including lexical stress. It was shown that, over the course of approximately half-a-year’s training, they were able to use a wider pitch range to differentiate stressed and unstressed syllables in a reading and a story telling task. To the best of the author’s knowledge, however, there is little data available as to whether and how L2 learners’ use of F0, intensity, duration and vowel quality change together over the course of speech training. The present study was designed to fill in the gap and attempted to extend Tsushima (2014) by analyzing additional data obtained from the extended period of speech training (i.e., 11.1 months).
The rationale of the present study was the following. First of all, it attempted to examine whether and how the use of the acoustic cues (F0, intensity, duration and vowel quality) to English lexical stress changed in the course of pronunciation training. If they rely largely on F0 change for perceiving stress, as suggested by Watanabe (1988), the other acoustic cues may not show substantial changes. Alternatively, intensity and duration may show some changes in addition to F0, as suggested by Lee (2006), which found that Japanese bilinguals were native-like in producing these acoustic cues. In addition, vowel qualities of unstressed vowels (i.e., schwa) may show some changes toward that of native speakers, as suggested by Kondo (2000), which found that the degree of vowel reduction was larger for more fluent than less fluent learners. Especially, the words targeted for analysis occurred in a non-sentence-final position. For example, the disyllabic word, accent, occurs in a sentence, “If not, your foreign accent may show people that you come from another country”. To a certain extent, it is up to the speaker how much phrasal or sentence accent is placed on the word. In a phrase, “your foreign accent”, each of the three words could receive the highest phrasal accent depending on the focus and contrast the speaker intends to convey. In addition, there is some freedom on the part of the speaker regarding the phrasal intonation at the end of the phrase, “your foreign accent”. The speaker could use one of rising, flat or falling intonation. Despite the variability, the speaker should still mark the first syllable as stressed and the second syllable as unstressed, using one or more of the acoustic cues described above. Thus, the analysis attempted to investigate possible interactions among the use of the acoustic cues within each participant.
Second, the present study examined the productive use of the acoustic cues in a span of approximately eleven months, in which the focus and method of training changed according to each learner’s improvements in different aspects of speech abilities. The training program initially taught the participants knowledge about English syllables, English lexical and sentence stress, and provided them with perception and production practice. Then, the focus of the training shifted to teaching consonants and vowels that each participant had difficulty with. As for the training on stress, the participants were given more applied practice such as reading practice with special attention to prosody and spontaneous speaking practice. The present study attempted to examine whether and how the use of the acoustic cues further improved when more applied practice was introduced and conducted.
Specific research questions asked in the present study were the following.
1) Did each participant learn to use pitch, intensity, duration and vowel quality to differentiate accented and unaccented syllables in the reading task? If yes, how did the improvement occur for each of the acoustic cues?
2) Did the improvements in the use of the acoustic cues interact with each other? If yes, how did they do so?
3) How were the improvements in the use of the acoustic cues related with the content of the training?
2. Method
2-1. Participants
The participants were two juniors in the faculty of business administration at a private university in Tokyo at the time of their participation in this study. One participant (called PA henceforth) was 20-year-old female, and the other, 21-year-old male (called PB henceforth). As demonstrated by their TOEIC score and speaking ability, their English ability was categorized as intermediate. When speaking, they were able to produce utterances with basic sentence structures, but occasionally had to put long pauses between phrases and sentences. They also made occasional grammatical mistakes in terms of tense and agreement. They were highly motivated to improve their English abilities in general and their pronunciation ability in particular.
2-2. Diagnostic Test
Seven diagnostic tests were conducted during a 45.5 weeks of the training. The average interval of the tests was approximately 7.6 weeks for both participants, with a minimum of 6 weeks and a maximum of 9.7 weeks. The diagnostic test consisted of four parts, a reading task, a storytelling task, a short talk and conversation. In the reading task, the participants were asked to read a passage (see Appendix) taken from Teaching Pronunciation (Celce-Murcia, Brinton, & Goodwin, 2010, Appendix 16, p.481). They were given a few minutes to practice reading the passage aloud before recording was conducted. Their utterances were recorded at a resolution of 16 bits with a sampling rate of 44.1 Hz by a PCM recorder through a high-quality microphone placed approximately 20 cm from the mouth of the speaker. On a PC, the recorded sounds were low-pass filtered at 10,000 Hz, normalized and analyzed by sound analysis software, Praat (Boersma & Weenink, 2014).
2-3. Description of Training
Face-to-face pronunciation training was conducted with the author in his office at the university. During the period of training, 43 and 36 training sessions were held for PA and PB, respectively. The length of each training session was approximately 60 minutes for PA and 45 minutes for PB, but varied from 30 to 90 minutes, depending on the content of training and availability of training time. The interval of the sessions was one week for the most part, except during the summer and winter break.
The overall aim of the training was to develop the ability to produce English utterances with an accepted level of intelligibility and comprehensibility in spontaneous production. The basic structure of the training followed “cognitive approach” to teaching pronunciation (Fraser, 2001, 2006). First, the knowledge about a target structure (e.g., English lexical stress) is taught to the learners. Then, practice on the target structure is conducted using a variety of activities in the textbook, which included a listening task (e.g., discrimination, dictation), a repeating task, and a reading task (e.g., a dialogue, a passage) The participants’ utterances were often recorded and were immediately played back so that they could listen to their own utterances. Then, they obtained immediate feedback from the instructor.
In the first 11 sessions of the program, both participants were trained on English stress, using the materials in “Syllable Stress” in American Accent Training (Cook, 2000, pp.19-22) and units 21 to 37 in English Pronunciation in Use, Intermediate (Hewings, 2007).
The topics of these units include 1) introduction of syllables/word/sentence stress, 2) consonant clusters at the beginning and end of words, 3) stress in two-syllable, compound and longer words, and 4) unstressed words. It was specifically stressed that higher pitch, longer duration and higher intensity are used to mark the stressed syllables. Following the training on the syllable and stress, each participant was trained on the consonants and vowels that they had difficulty with. PA was trained on /r/-/l/ and consonant clusters up to the 20th session, and then on vowels (e.g., /ə/, /æ/) until the 39th session. PB was trained on /s/-/ɵ/, /f/-/v/, /r/-/l/ and consonant clusters up to 31st session, and on vowels until the 35th session.
In addition to the training of targeted structure and phonemes, each session included a reading or spontaneous speaking practice. In the reading practice, the participants listened to utterances spoken by a native speaker (e.g., a Penguin book) and read it while attempting to imitate the model speaker s segments and prosody (i.e., stress and intonation) as closely as possible. The reading task was introduced in the 10th session and continued up to the 21st session for PA, and in the 22nd session continued up to the 25th session for PB. In the spontaneous speaking task, the participant read a passage in a book (e.g., Chicken Soup) before the session, and retold a story without reading it. It was introduced to PA in the 29th session and continued up to 40th week. PB practiced his speech for the speech contest he participated in from the 26th session to the 32nd session. In all the activities, they got feedback from the instructor, which focused on prosody (i.e., stress, rhythm, intonation) of their utterances, as well as segments that they were trained on.
2-4. Analyses Procedure
In the reading passage used for the diagnostic test, five disyllabic words (i.e., accent, answer, factor, children, perfect) were chosen for analysis. All of them have a trochaic stress pattern (i.e., strong-weak). Among them, two words (i.e., answer, factor) have a schwa (i.e., /ə/) in unstressed syllables.
All the measurements were conducted using sound analysis software, Praat. First of all, as a measure of F0 (in hertz), the peak F0 of the vowel was recorded for stressed syllables, and the lowest F0 for unstressed syllables (cf. M. Kondo, 2009). It should be noted that, when the vowel is followed by /r/ (i.e., /ə/ in answer, factor, another), the /r/ portion was included in the vowel as it was impossible to separate the vowel from the /r/ portion. The ratio of F0 in the unstressed to the stressed vowel was calculated. Second,
intensity (in decibels: dB) was measured at the peak for both stressed and unstressed syllables. The log ratio of the intensity for the stressed to unstressed vowels was calculated by subtracting the intensity of the unstressed vowel from that of the stressed vowel (cf. Lee et al., 2006). Third, in measuring duration (in milliseconds: ms), the vowel portion of the syllable where distinctive formant structure was observed was measured. The difference in duration was calculated by subtracting the duration of the unstressed vowel from that of the stressed vowel. Finally, vowel quality was evaluated by measuring the first and second formant (F1 and F2) of the vowel. Mean formant values (in hertz: Hz) were measured for the portion where the movement of the two formants was relatively stable. When the two formants did not exhibit any stable portion because of coarticulation, they were measured in the middle portion of the vowel. Then, the difference between F1 and F2 on a log scale was calculated for the unstressed syllables (cf. Fear et al., 1995). Reduced, centralized vowels (e.g., schwa, /ə/) normally exhibit a higher value as compared with back, peripheral vowels (e.g., /ɑ/, /ɔ/) as the difference between F1 and F2 is larger in the former than the latter. On the other hand, reduced, centralized vowels normally show a lower value as compared with front, peripheral vowels (e.g., /i/, /e/).
2-5. Data of native speakers
Two sets of data were obtained as the data of native speakers. First, an adult native speaker from Canada was asked to read the reading passage. His utterances were recorded in the author’s office using the same equipment as described above. Second, a sample recording of the reading passage was used, which is included in the CD of the textbook, Teaching Pronunciation (Celce-Murcia et al., 2010, Appendix 16, p.481). The speaker is an adult female native speaker of English
3. Results
3-1. Fundamental frequency (F0)
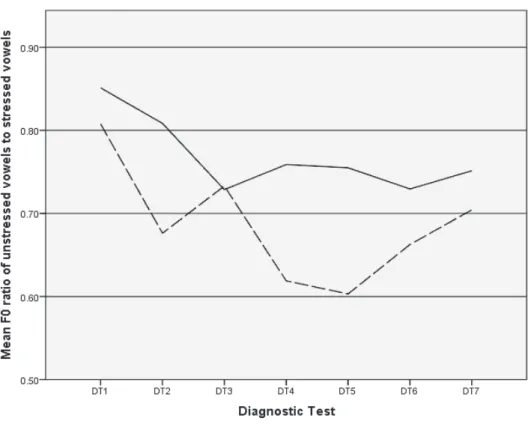
Figure 1. The ratio of F0 in unstressed to stressed vowels averaged over the target words as a function of the participants across the diagnostic tests. The solid and dotted line shows the data of PA and PB, respectively.
Figure 1 shows the mean ratio of F0 in unstressed vowels to stressed vowels averaged over the target words as a function of participants across the diagnostic tests. A lower ratio indicates a wider difference in F0 between the stressed and unstressed vowel. It is shown that the ratios decreased substantially between the first and the last test. Especially, they decreased markedly during the first few diagnostic tests where the training focused on the knowledge of syllable and production of stress. For PA, the mean F0 in the stressed and unstressed vowels at the first diagnostic test were 208.4 Hz and 176.8 Hz, while those of the last test were 245.2 Hz and 184.0 Hz. The difference between the stressed and unstressed vowels increased from 31.6 Hz to 61.2 Hz. For PB, those of
the first test were 133.6 Hz and 107.4 Hz, while those of the last test were 159.8 Hz and 111.6 Hz. The difference rose from 26.3 Hz to 48.2 Hz. It was also found that, for both participants, the increase in the difference in F0 was largely due to the increased in F0 in the stressed, rather than unstressed vowels.
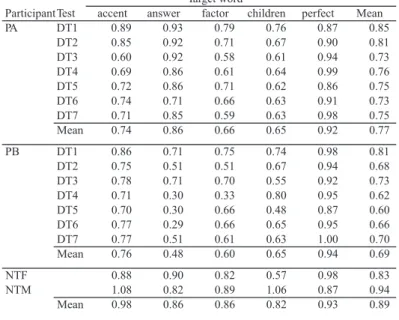
Table 1 shows the F0 ratios as a function of the target words. It is shown that the decrease of the ratio was observed in all the target words except perfect, where the ratio stayed approximately above 0.9 across the diagnostic tests in both participants. Table 1 also shows the data of the native speakers. For the female native speaker (NTF), the mean F0 in stressed and unstressed vowels were 207.6 Hz and 169.2 Hz, while those were 107.2 Hz and 100.4 Hz for the male native speaker (NTM). The difference between stressed and unstressed vowels was 38.4 Hz and 6.8 Hz, respectively. The reason that the difference is relatively low for NTM was that F0 was higher in stressed than unstressed vowels in three of the target words (i.e., answer, factor, perfect;) but lower in the other two (i.e., accent, children). This suggests that the use of pitch as a cue to stress is optional for the native speakers in this environment. It is notable that the Japanese participants produced the F0 difference which was far greater than those produced by the native speakers. In sum, the results indicated that the Japanese participants learned to use a wider range of pitch to differentiate stressed from unstressed syllables through the training.
ParticipantTest accent answer factor children perfect Mean
PA DT1 0.89 0.93 0.79 0.76 0.87 0.85 DT2 0.85 0.92 0.71 0.67 0.90 0.81 DT3 0.60 0.92 0.58 0.61 0.94 0.73 DT4 0.69 0.86 0.61 0.64 0.99 0.76 DT5 0.72 0.86 0.71 0.62 0.86 0.75 DT6 0.74 0.71 0.66 0.63 0.91 0.73 DT7 0.71 0.85 0.59 0.63 0.98 0.75 Mean 0.74 0.86 0.66 0.65 0.92 0.77 PB DT1 0.86 0.71 0.75 0.74 0.98 0.81 DT2 0.75 0.51 0.51 0.67 0.94 0.68 DT3 0.78 0.71 0.70 0.55 0.92 0.73 DT4 0.71 0.30 0.33 0.80 0.95 0.62 DT5 0.70 0.30 0.66 0.48 0.87 0.60 DT6 0.77 0.29 0.66 0.65 0.95 0.66 DT7 0.77 0.51 0.61 0.63 1.00 0.70 Mean 0.76 0.48 0.60 0.65 0.94 0.69 NTF 0.88 0.90 0.82 0.57 0.98 0.83 NTM 1.08 0.82 0.89 1.06 0.87 0.94 Mean 0.98 0.86 0.86 0.82 0.93 0.89 Target word
Table 1. The ratio of F0 in unstressed vowels to stressed vowels as a function of participants and target words across the diagnostic tests.
3-2. Intensity
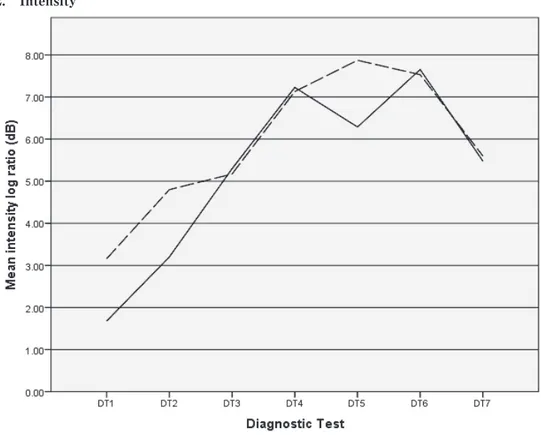
Figure 2. The mean ratio of intensity in stressed vowels to unstressed vowels averaged over the target words as a function of the participants across the diagnostic tests.
Figure 2 shows the mean ratio of intensity in stressed vowels to unstressed vowels averaged over the target words as a function of the participants across the diagnostic tests. A larger ratio indicates a greater difference in intensity between stressed and unstressed vowels. It is shown that, for both participants, the ratio of intensity became substantially larger across the diagnostic tests except between the last two tests. Examination of the intensity values at the initial and sixth diagnostic test showed that the increase in the overall intensity ratio between the two tests was more due to decrease in intensity of unstressed vowels than increase in stressed vowels in both participants. This finding suggested that, in differentiating stressed and unstressed vowel, both participants made unstressed vowels less loud instead of making stressed vowels louder.
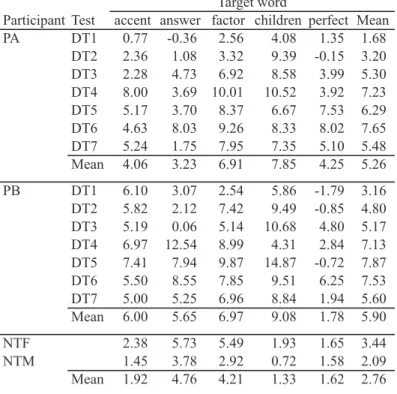
Table 2 shows the mean ratio of intensity as a function of the target words. It is shown that the increase in the mean ratio was observed to varying degrees for all the target words in both participants, except that the ratio of accent in PB was high from the
outset of the training. As for the native speakers, the mean ratio of intensity was 3.34 (range: 1.95-5.73) for NTF and 2.09 (range: 0.72-3.78) for NTM. It is shown that the ratio was high for answer and factor relative to the other words in both native speakers. As observed regarding F0 in 3-1 above, the intensity ratios of native speakers were substantially lower than those of PA and PB. In sum, the Japanese participants learned to use a wider range of intensity to differentiate stressed and unstressed syllables through the training.
Table 2. The ratio of intensity in stressed vowels to unstressed vowels as a function of participants and target words across the diagnostic tests.
Participant Test accent answer factor children perfect Mean PA DT1 0.77 -0.36 2.56 4.08 1.35 1.68 DT2 2.36 1.08 3.32 9.39 -0.15 3.20 DT3 2.28 4.73 6.92 8.58 3.99 5.30 DT4 8.00 3.69 10.01 10.52 3.92 7.23 DT5 5.17 3.70 8.37 6.67 7.53 6.29 DT6 4.63 8.03 9.26 8.33 8.02 7.65 DT7 5.24 1.75 7.95 7.35 5.10 5.48 Mean 4.06 3.23 6.91 7.85 4.25 5.26 PB DT1 6.10 3.07 2.54 5.86 -1.79 3.16 DT2 5.82 2.12 7.42 9.49 -0.85 4.80 DT3 5.19 0.06 5.14 10.68 4.80 5.17 DT4 6.97 12.54 8.99 4.31 2.84 7.13 DT5 7.41 7.94 9.87 14.87 -0.72 7.87 DT6 5.50 8.55 7.85 9.51 6.25 7.53 DT7 5.00 5.25 6.96 8.84 1.94 5.60 Mean 6.00 5.65 6.97 9.08 1.78 5.90 NTF 2.38 5.73 5.49 1.93 1.65 3.44 NTM 1.45 3.78 2.92 0.72 1.58 2.09 Mean 1.92 4.76 4.21 1.33 1.62 2.76 Target word
3-3. Duration
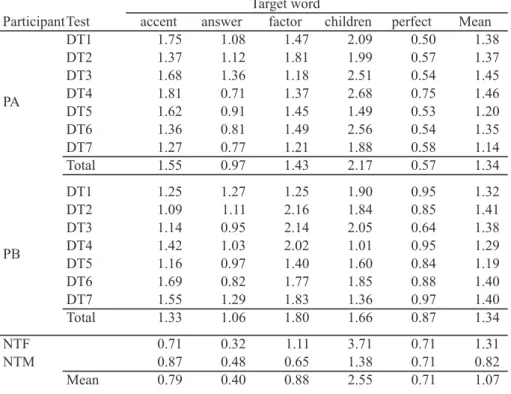
Table 3. The ratio of vowel duration in unstressed vowels to stressed vowels as a function of participants and target words across the diagnostic tests.
ParticipantTest accent answer factor children perfect Mean
DT1 1.75 1.08 1.47 2.09 0.50 1.38 DT2 1.37 1.12 1.81 1.99 0.57 1.37 DT3 1.68 1.36 1.18 2.51 0.54 1.45 DT4 1.81 0.71 1.37 2.68 0.75 1.46 DT5 1.62 0.91 1.45 1.49 0.53 1.20 DT6 1.36 0.81 1.49 2.56 0.54 1.35 DT7 1.27 0.77 1.21 1.88 0.58 1.14 Total 1.55 0.97 1.43 2.17 0.57 1.34 DT1 1.25 1.27 1.25 1.90 0.95 1.32 DT2 1.09 1.11 2.16 1.84 0.85 1.41 DT3 1.14 0.95 2.14 2.05 0.64 1.38 DT4 1.42 1.03 2.02 1.01 0.95 1.29 DT5 1.16 0.97 1.40 1.60 0.84 1.19 DT6 1.69 0.82 1.77 1.85 0.88 1.40 DT7 1.55 1.29 1.83 1.36 0.97 1.40 Total 1.33 1.06 1.80 1.66 0.87 1.34 NTF 0.71 0.32 1.11 3.71 0.71 1.31 NTM 0.87 0.48 0.65 1.38 0.71 0.82 Mean 0.79 0.40 0.88 2.55 0.71 1.07 PA PB Target word
Table 3 shows the ratio of vowel duration in unstressed vowels to stressed vowels as a function of the participants and the target words across the diagnostic tests. A smaller ratio indicates a larger difference in duration between stressed and unstressed vowels. PA’s data show that the ratio clearly decreased in accent and answer, but not for factor, children or perfect. The duration of answer in the accented and unaccented vowel was 169 ms and 183 ms (ratio=1.08) at the initial test, while that of the final test was 195 ms and 151 ms (ratio=0.77). In this example, the duration of the accented vowel became longer and that of the unaccented vowel became shorter. The duration of factor in the accented and unaccented vowel was 89 ms and 131 ms (ratio=1.47) at the initial test, while that of the final test was 118 ms and 143 ms (ratio=1.21). It should be pointed out, however, that the way the ratio changed across the tests was not as consistent as what was observed in F0 and intensity described above.
For PB, the ratios tended to decrease in answer from the initial to the 6th test, but not in the other words. The duration of answer in the accented and unaccented vowel was
132 ms and 167 ms (ratio=1.27) at the initial test, while that of the 6th test was 141 ms and 116 ms (ratio=0.82). It should be noted, however, that the ratio returned to the initial level in the final test, suggesting that his production regarding this acoustic cue was not stable. The native speakers showed duration ratios which were far lower than those of the nonnative speakers, except for perfect in PA. Unlike what was observed in PA and PB, duration of unstressed vowels is mostly shorter than that of stressed vowels (i.e., ratios<1.0), except in children. The results were in stark contrast with F0 and intensity where the degree of differentiation far exceeded that of the native speakers. In sum, it was indicated that PA and PB didn’t adequately learn to use duration to differentiate stressed and unstressed syllables through the training.
3-4. Vowel quality
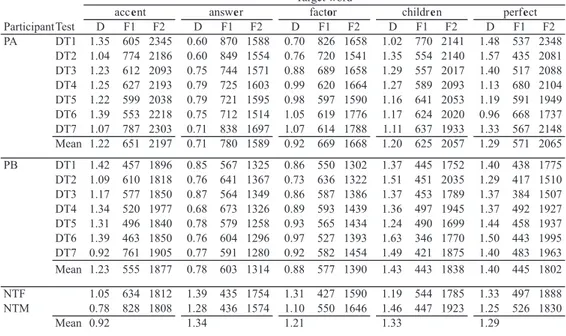
Table 4. Log F2–log F1 difference (D) in unstressed vowels, and F1 and F2 values (in Hertz) in unstressed vowels as a function of participants, target words and the diagnostic tests. ParticipantTest D F1 F2 D F1 F2 D F1 F2 D F1 F2 D F1 F2 PA DT1 1.35 605 2345 0.60 870 1588 0.70 826 1658 1.02 770 2141 1.48 537 2348 DT2 1.04 774 2186 0.60 849 1554 0.76 720 1541 1.35 554 2140 1.57 435 2081 DT3 1.23 612 2093 0.75 744 1571 0.88 689 1658 1.29 557 2017 1.40 517 2088 DT4 1.25 627 2193 0.79 725 1603 0.99 620 1664 1.27 589 2093 1.13 680 2104 DT5 1.22 599 2038 0.79 721 1595 0.98 597 1590 1.16 641 2053 1.19 591 1949 DT6 1.39 553 2218 0.75 712 1514 1.05 619 1776 1.17 624 2020 0.96 668 1737 DT7 1.07 787 2303 0.71 838 1697 1.07 614 1788 1.11 637 1933 1.33 567 2148 Mean 1.22 651 2197 0.71 780 1589 0.92 669 1668 1.20 625 2057 1.29 571 2065 PB DT1 1.42 457 1896 0.85 567 1325 0.86 550 1302 1.37 445 1752 1.40 438 1775 DT2 1.09 610 1818 0.76 641 1367 0.73 636 1322 1.51 451 2035 1.29 417 1510 DT3 1.17 577 1850 0.87 564 1349 0.86 587 1386 1.37 453 1789 1.37 384 1507 DT4 1.34 520 1977 0.68 673 1326 0.89 593 1439 1.36 497 1945 1.37 492 1927 DT5 1.31 496 1840 0.78 579 1258 0.93 565 1434 1.24 490 1699 1.44 458 1937 DT6 1.39 463 1850 0.76 604 1296 0.97 527 1393 1.63 346 1770 1.50 443 1995 DT7 0.92 761 1905 0.77 591 1280 0.92 582 1454 1.49 421 1875 1.40 483 1963 Mean 1.23 555 1877 0.78 603 1314 0.88 577 1390 1.43 443 1838 1.40 445 1802 NTF 1.05 634 1812 1.39 435 1754 1.31 427 1590 1.19 544 1785 1.33 497 1888 NTM 0.78 828 1808 1.28 436 1574 1.10 550 1646 1.46 447 1923 1.25 526 1830 Mean 0.92 1.34 1.21 1.33 1.29 Target word
accent answer factor children perfect
Table 4 shows the difference in log F2 and log F1 in unstressed vowels as well as F1 and F2 values in unstressed vowels. For the target words, answer and factor, the differences between the two formants in PA and PB were lower than those of the native speakers. Specifically, F1 was higher and F2 was lower in the former than the latter,
which shows that the vowels were produced in a relatively peripheral region in a vowel space. Perceptively, these peripheral vowels were categorized as a low-back vowel, /ɑ/. In contrast, the vowels were produced in a relatively central region of the vowel space for the native speakers. Perceptively, they were categorized as a schwa, /ə/.
Examination of the data across the tests showed that, in PA, the difference between the F1 and F2 became larger in both answer and factor. In answer, F1 became lower from 870 Hz in the initial test to 712 Hz in the 6th test. In factor, F1 decreased from 826 Hz in the initial test to 614 Hz in the final test. In PB, there was a slight increase in the difference between F1 and F2 for factor in the last three tests, as compared with the first three tests. Specifically, F2 increased from 1302 Hz in the initial test to 1454 Hz in the final test. The findings suggested that their productions of the vowels shifted from a more peripheral toward a more reduced vowel to a moderate degree for these words. It should be noted, however, that the differences were still smaller than those of the native speakers, suggesting that the vowels produced by PA and PB were not reduced enough as compared with those of the native speakers.
For accent, the differences between F1 and F2 were generally larger in PA and PB than the native speakers. Generally, F1 was lower and F2 was higher for the former than the latter. Perceptively, their production was close to a front vowel, /e/, while those of the native speakers were closer to a central region of the vowel space. Across the tests, there appeared to be little notable developmental trend for either PA or PB.
For children, the differences between F1 and F2 were mostly within the range of those of the native speakers. For perfect, the differences between F1 and F2 for PB were slightly larger than those of the native speakers, suggesting that his productions of the vowels were relatively closer to the peripheral, /e/ than those of the native speakers. For PA, there was a trend for decrease in the difference, with F2 going down from 2348 Hz in the initial test to 1737 Hz in the sixth test. This suggested that her productions of the vowel moved away from the peripheral region across the test.
In sum, PA showed some shift in vowel quality toward a schwa in answer and factor, while PB showed only a slight change in factor. In either of them, the produced vowels were not reduced enough even at the end of the training sessions. These findings indicated that PA and PB only partially learned to use duration as a cue to lexical stress through the training.
3-4. Relations among F0, intensity, duration and vowel quality
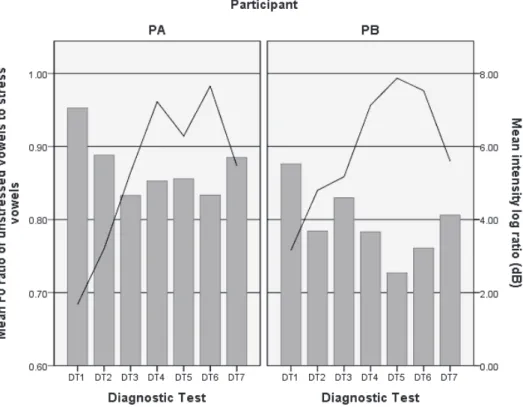
Figure 3. The mean F0 ratio of unstressed vowels to stressed vowels (indicated by bars) and the mean intensity log ratio (indicated by lines) averaged over the target words as a function of the participants across the diagnostic tests.
Figure 3 shows the mean F0 ratio of unstressed vowels to stressed vowels (bars) and the mean intensity log ratio (lines) averaged over the target words as a function of the participants across the diagnostic tests. It is shown that a major change in the F0 ratio and the intensity ratio occurred around the former half of the training. It is also shown that the F0 ratio and the intensity ratio were inversely related in a majority of the cases, showing that when the difference in one acoustic cue between a stressed and unstressed vowel is higher, that of the other cue is also higher. This indicates that the degree of difference between a stressed and unstressed vowel due to F0 and intensity concurrently changed through the training sessions.
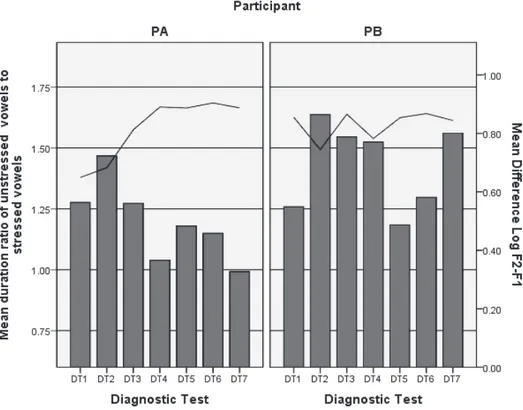
Figure 4. The mean duration ratio of unstressed vowels to stressed vowels (indicated by bars) and the mean difference log F2-F1 (indicated by lines) averaged over the target words, answer and factor, as a function of the participants across the diagnostic tests.
Figure 4 shows the mean duration ratio of unstressed vowels to stressed vowels (bars) and the mean difference log F2-F1 (lines) averaged over the target words, answer and factor, as a function of the participants across the diagnostic tests. In PA, the vowel quality changed toward a schwa during the first half of the training sessions as observed for F0 and intensity, while a major change did not occur until the 4th test in terms of duration. In PB, no notable relation with other acoustic cues was observed in either duration or vowel quality.
In sum, the data indicated that the ability to use F0 and intensity as acoustic cues to English stress improved almost simultaneously through the training in both participants. In PA, the ability to use vowel quality improved together with that of F0 and intensity.
4. Discussion and Conclusion
4-1. Summary of the present findings
The present study attempted to investigate whether and how the Japanese participants learned to use pitch, intensity, duration and vowel quality to differentiate accented and unaccented syllables through pronunciation training. It specifically examined 1) how the use of each acoustic cue changed through the training, 2) how the changes interacted with each other, and 3) how the changes were related to the content of the training.
Both participants showed a substantial decrease in the F0 ratio of unstressed to stressed vowels in the former half of the training when it focused on practice of English stress, indicating that they learned to use a wider range of F0 to differentiate unstressed and stressed syllables. They also showed a substantial drop in the intensity ratio of unstressed to stressed vowels during approximately the same period, indicating that they learned to use wider intensity difference to mark unstressed and stressed syllables. As for duration, PA and PB showed some decrease in the duration ratio of unstressed to stressed vowels in a few, or only one, target words, respectively. But the ratios still turned out to be much larger than that of the native speakers, indicating that they didn’t sufficiently learn to use duration to differentiate stressed and unstressed syllables. Finally, the vowel quality of unstressed syllables in PA’s productions shifted to some degree to that of a schwa in answer and factor, but the difference between F2 and F1 was much lower than that of the native speakers. It was indicated that PA only moderately learned to use vowel quality to mark unstressed syllables. Little change in vowel quality was observed for PB.
4-2. Discussion on the use of the acoustic cues to English stress
These findings indicated, first of all, that F0 may be the easiest acoustic cue to learn to manipulate to differentiate stressed and unstressed syllables through pronunciation training. The finding is compatible with the results of Nagamine (2011), which found that one-year training using “Hyper-Pronunciation Training method” successfully modified the ability of Japanese learners of English to use a wider range of pitch to mark English stress. The present results are also compatible with the notion that the use of acoustic cues to English stress is influenced by how the cues are used in the native language of
the learners. In Japanese, lexical stressed is cued solely by pitch (i.e., physically F0). The learners are reasonably accustomed to manipulating F0 in their first language. This might have allowed the learners to apply the ability to learning to produce English lexical stress. Yu & Andruski (2011) also found that Chinese learners of English use F0 as a primary cue to stressed syllables in English, while native speakers of English used duration as the primary and consistent cue.
Second, the present results indicated that both participants learned to use intensity during the former half of the training when they also learned to use F0. In Japanese, intensity is scarcely used to differentiate stressed and unstressed syllables. However, the Japanese participants relatively quickly learned to use intensity during the training. It was found that the increase in the degree of differentiation was attributed more to the decrease in intensity in unstressed syllables than to the increase in intensity in stressed syllables. It might be the case that lowering F0 and decreasing intensity simultaneously might not be physiologically demanding for the nonnative speakers. The present results clearly indicated that pronunciation training can relatively easily modify the ability to use intensity to mark English stress.
Third, the present results found that it is relatively difficult for the participants to learn to use duration as an acoustic cue to English stress. In Japanese, duration is used to make lexical distinction. For example, kita (north) and kiita (listened) are distinguished on the basis of the duration of the vowel, “i”. However, phonological use of duration in their native language apparently did not help much to use it as an acoustic cue to English stress. Another factor that appears to be operative is a language-specific rhythm of Japanese. Mochizuki-Sudo & Kiritani (1991) found that production of English by Japanese learners of English is heavily influenced by mora-timed rhythm. The vowel portion of stressed syllable in accent, answer and factor is normally counted as one mora by Japanese learners of English. It might be the case that Japanese speakers have difficulty with breaking away from the rhythmic unit. The target word, perfect, showed the duration ratio which was comparable to that of the native speakers. In fact, the vowel portion of stressed syllable is normally counted as two morae by Japanese speakers, which might have made it easy to produce a vowel with relatively longer duration.
In addition to lengthening stressed vowels, it is important to learn to shorten unstressed vowels. In a target word, accent, for example, the duration of the unstressed vowel, “e”, at the final test was 145 ms and 154 ms for PA and PB respectively, while that of the native speakers was 51 ms and 79 ms. Although the difference in speaking rate
might account for the difference to some degree, the difference in duration appears to be still substantial. Given the evidence that late bilinguals of English and Japanese produce duration which was not different from that of native speakers (Lee et al., 2006), further pronunciation training will probably be able to modify the use of duration as an acoustic cue to English stress in Japanese learners of English.
Finally, the present results indicated that it is relatively difficult to modify the ability to differentiate stressed and unstressed syllables on the basis of vowel quality. Japanese has a five-vowel system where vowels are relatively close to periphery of a vowel space (except for /u/: [ɯ] in certain contexts). For example, the English schwa, /ə/, in factor and answer, is perceptually assimilated to Japanese /ɑ/ in normal conditions. Lee et al. (2006) found that even Japanese bilinguals of English produce vowel quality which is less reduced than that of native speakers of English. This problem is shared with speakers of other languages. Previous research has found, for example, that native speakers of Spanish, which have a five-vowel system, also have difficulty sufficiently reducing unstressed vowels (Flege & Bohn, 1989). The present results, however, indicated that the vowel quality of unstressed vowels in at least some target words shifted toward that of schwa in PA. This finding is compatible with that of Kondo (2009), which found that the vowel quality of unstressed vowels in more fluent learners of English was closer to that of native speakers than in less fluent ones. These results indicate that, given appropriate training, Japanese learners of English can learn to modify vowel quality through pronunciation training.
4-3. Implications for teaching pronunciation
The present study provides some implications for teaching pronunciation. First of all, the present results clearly indicate that pronunciation training focused on English stress is effective in modifying the ability to differentiate stressed and unstressed syllables using some combination of available acoustic cues. Between the initial and third diagnostic test where substantial learning occurred, ten weekly training sessions were held, which included introducing the notion of syllable and English stress and a variety of perception and production practice. It is indicated that this amount of training is sufficient to allow learners to produce disyllabic English words with distinctive stress pattern, using at least F0 and intensity. Second, the present results suggest that reading practice with special attention to English prosody may be effective in maintaining the ability to differentiate stressed and unstressed syllables. The level of differentiation between stressed and
unstressed vowels achieved during the first half of the overall training period was generally maintained after the main focus of production training shifted to practice of consonants and vowels. Of course, it is an empirical question whether the ability to differentiate stressed and unstressed syllables may remain intact or deteriorate in the absence of the reading practice. However, given the strong influence of the native language phonology on production of nonnative lexical stress, it appears reasonable that some kind of practice including reading practice should be conducted to maintain the ability.
Finally, the present results strongly indicate that it is of great importance to teach learners how to use duration and vowel quality as an acoustic cue to English stress. As for duration, it appears important to choose words for practice which has a stressed syllable that is counted as one mora by Japanese learners (e.g., accent). Learners should be taught to deliberately lengthen the stressed syllable and shorten the unstressed syllable at the same time. It might be helpful to use sound editing software (e.g., Praat) to monitor duration of the produced vowels. As for vowel quality, the present training sessions actually included a few sessions where the participants were taught about unstressed syllables. Apparently, these sessions were not sufficient to adequately modify their ability to produce reduced vowels. It seems important to conduct perceptual training on differentiating peripheral vowels and central vowels (e.g., /ɑ/-/ə/). It is also important to teach how to appropriately produce a schwa vowel. Using sound software might help learners to match the position of the tongue and the resultant acoustic and perceptual properties of the produced sound. Then, perceptual and productive practice with lexical items might be introduced. It is an empirical question whether training focused on duration and vowel quality of unstressed syllables should be introduced from the beginning of the training or should be delayed after the use of F0 and intensity has improved to a certain degree. This issue might be investigated in future research.
4-4. Limitations of the study
First, the present data are obtained as part of a case study where a variety of aspects of linguistic data were obtained from the two participants. As a result, the present results may not be generalizable to a larger population of Japanese learners of English. Second, the target words for the present analysis were five words arbitrarily chosen from the reading text. A possibility remains that a choice of a different set of words may produce
different results. Finally, the present analysis focused on the data obtained from the reading task. The ultimate goal of the pronunciation training was to improve the ability to produce English in spontaneous speech. It is expected that production of lexical stress is much more difficult to learn and teach in a spontaneous task than in a reading task. It is also possible that the way learners use the acoustic cues might differ between the reading and speaking task. These issues should be investigated in future study.
4-5. Concluding remarks
With these limitations, the present study demonstrated that the Japanese participants were able to improve the ability to differentiate English accented and unaccented syllables through the pronunciation training. It was specifically found that they were able to learn to use F0 and intensity, but that it was much more difficult for them to modify the ability to use duration and vowel quality. Further research may focus on finding effective teaching methods to help learners to learn how to produce unaccented vowels with shorter duration and reduced vowel quality.
Acknowledgement
The author would like to express sincere gratitude to Gary Auger for providing speech data for the present study.
References
Aoyama, K., & Flege, J. E. (2011). Effects of L2 experience on perception of English /r/ and /l/ by native Japanese speakers. Journal of the Phonetic Society of Japan, 15(3), 5-13.
Beckman, M. E. (1986). Stress and non-stress accent (Vol. 7). Dordrecht, Riverton: Foris Publications.
Best, C. T. (1995). A direct realist view of cross-language speech perception. In W. Strange (Ed.), Speech perception and linguistic experience: Issues in cross-language research (pp. 171-204).
Timonium, MD: York Press.
Binghadeer, N. (2008). An acoustic analysis of pitch range in the production of native and nonnative speakers of English. Asian EFL Jounal, 10(4), 96-113.
Boersma, P., & Weenink, D. (2014). Praat: doing phoetics by compter [Computer program]. Version 5.4, retrieved 4 October 2014 from http://www.praat.org/.
Bond, Z. S., & Fokes, J. (1985). Nonnative patterns of English syllable timing. Journal of Phonetics, 13, 407-420.
Bongaerts, T., Planken, B., & Schils, E. (1995). Can late starters attain a native accent in a foreign language? A test of the critical period hypothesis. In D. Singleton, & Lengyel, Z. (Ed.), The age factor in second language acquisition: A criticcal look at the critical period hypothesis (pp. 30-50). Clevedon, England: Multilingual Matters.
Browman, C. P., & Goldstein, L. (1992). Targetless schwa: An articulatory analysis. In G. J. Docherty & D. R. Ladd (Eds.), Papers in laboratory phonology II: Gesture, segment, prosody (pp. 26-36). New York: Cambridge University Press.
Celce-Murcia, M., Brinton, D., & Goodwin, J. M. (2010). Teaching pronunciation : a course book and reference guide (2nd ed.). New York: Cambridge University Press.
Cook, A. (2000). American Accent Training (2nd ed.). Hauppauge, NY: Barron’s.
Cooper, N., Cutler, A., & Wales, R. (2002). Constraints of lexical stress on lexical access in English: evidence from native and non-native listeners. Language and Speech, 45(Pt 3), 207-228. Couper, G. (2006). The short and long-term effects of pronunciation instruction. Prospect, 21,
46-66.
Cutler, A. (2005). Lexical stress. In D. B. Pisoni & R. E. Remez (Eds.), The Handbook of Speech Perception (pp. 264-289). Malden, MA: Blackwell Publishing.
Cutler, A. (2009). Greater sensitivity to prosodic goodness in non-native than in native listeners (L). J Acoust Soc Am, 125(6), 3522-3525. doi: 10.1121/1.3117434
Cutler, A. (2012). Native listening : language experience and the recognition of spoken words. Cambridge, Mass.: MIT Press.
Derwing, T. M., Munro, M. J., & Wiebe, G. (1998). Evidence in favor of a broad framework for pronunciation instruction. Language Learning, 48(3), 393-410. doi: 10.1111/0023-8333.00047 Fear, B. D., Cutler, A., & Butterfield, S. (1995). The strong/weak syllable distinction in English. J
Acoust Soc Am, 97(3), 1893-1904.
Flege, J. E., & Bohn, O.-S. (1989). An instrumental study of vowel reduction and stress placement in Spanish-accented English. Studies in Second Language Acquisition, 11(01), 35-62. doi: doi:10.1017/S0272263100007828
Fokes, J., & Bond, Z. S. (1989). The vowels of stressed and unstressed syllables in non-native English. Language Learning, 39, 341-373.
Fraser, H. (2001). Teaching pronunciation: a handbook for teachers and trainers: Department of Education Training and Youth Affairs (DETYA).
Fraser, H. (2006). Helping teachers help students with pronunciation: a cognitive approach. Prospect, 21(1), 80-96.
Hewings, M. (2007). English Pronunciation in Use: Advanced. Cambridge: Cambridge University Press.
Huss, V. (1978). English word stress in the post-nuclear position. Phonetica, 35, 86-105.
Kondo, M. (2009). Is acquisition of L2 phonemes difficult? Production of English stress by Japanese speakers. Paper presented at the the 10th Generative Approaches to Second Language Acquisition Conference, University of Illinois at Urbana-Chanpaign.
Pierrehumbert (Eds.), Laboratory Phonology V: Acquisition and the Lexicon (pp. 29-39). Cambridge: Cambridge University Press.
Lee, B., Guion, S. G., & Harada, T. (2006). Acoustic analysis of the production of unstressed English vowels by early and late Korean and Japanese bilinguals. Studies in Second Language Acquisition, 28(03), 487-513. doi: doi:10.1017/S0272263106060207
Miyawaki, K., Strange, W., Verbrugge, R., Liberman, A. M., & Jenkins, J. J. (1975). An effect of linguistic experience: The discrimination of [r] and [l] by native speakers of Japanese and English. Perception and Psychophysics, 18(5), 331-340.
Mochizuki-Sudo, M., & Kiritani, S. (1991). Production and perception of stress-related durational patterns in Japanese learners of English. Journal of Phonetics, 19, 231-248.
Nagamine, T. (2011). Effects of hyper-pronunciation training method on Japanese university students’ pronunciation. Asian EFL Journal Professional Teaching Articles, 53, 35-50. Sluijter, A. M., van Heuven, V. J., & Pacilly, J. J. (1997). Spectral balance as a cue in the
perception of linguistic stress. J Acoust Soc Am, 101(1), 503-513.
Tsushima, T. (2008). How are nonnative perception and production ability related during perception and production training? Journal of the Japan Society for Speech Sciences, 9, 29-47.
Tsushima, T. (2014). A case study: a preliminary report on the effects of English pronunciation training on the use of pitch in the reading and the story telling task. Journal of Humanities & Natural Sciences, 135, 71-110.
Tyler, M. D., & Cutler, A. (2009). Cross-language differences in cue use for speech segmentation. J Acoust Soc Am, 126(1), 367-376. doi: 10.1121/1.3129127
Watanabe, K. (1988). Sentence stress perception by Japanese students. Journal of Phonetics, 16, 181-186.
Yu, V. Y., & Andruski, J. E. (2010). A cross-language study of perception of lexical stress in English. Journal of Psycholinguistic Research, 39(4), 323-344. doi: 10.1007/s10936-009-9142-2 Zhang, Y., & Francis, A. (2010). The weighting of vowel quality in native and non-native listeners’
perception of English lexical stress. Journal of Phonetics, 38, 260-271.
Zhang, Y., Nissen, S. L., & Francis, A. L. (2008). Acoustic characteristics of English lexical stress produced by native Mandarin speakers. J Acoust Soc Am, 123(6), 4498-4513. doi: 10.1121/1.2902165.
Appendix. The reading passage used in the reading task, taken from Teaching Pronunciation (Celce-Murcia et al., 2010, Appendix 16, p.481). The italicized words were those analyzed.
Diagnostic Passage
Is English your native language? If not, your foreign accent may show people that you come from another country. Why is it difficult to speak a foreign language without an accent? There are a couple of answers to this question. First, age is an important factor in learning to pronounce.
We know that young children can learn a second language with perfect pronunciation. We also know that older learners usually have an accent, though some older individuals also have learned to speak without an accent.
Another factor that influences your pronunciation is your first language. English speakers can, for example, recognize people from France by their French accents. They can also identity Spanish or Arabic speakers over the telephone, just by listening carefully to them. Does this mean that accents can t be changed? Not at all!! But you can t change your pronunciation without a lot of hard work. In the end, improving appears to be a combination of three things: concentrated hard work, good ear, and a strong ambition to sound like a native speaker.
You also need accurate information about English sounds, effective strategies for practice, lots of exposure to spoken English, and patience. Will you make progress, or will you give up? Only time will tell, I m afraid. But it s your decision. You can improve! Good luck and don t forget to work hard.