D24
Susceptibility assessment of landslides in a tectonically active mountainous environment by
logistical regression analysis
〇Fanyu ZHANG, Wenwu CHEN, Gonghui WANG, Toshitaka KAMAI
1 Introduction
Landslide geo-hazards frequently result in numerous losses of human lives and properties, especially in mountainous area. It is essential to assess the landside susceptibility for the developing plans on mountainous environment. Although great progress had been made in the landslide susceptibility assessment, it still lacks clearly defined criterions, such as how to decide the affecting factors.
The aim of the study is to examine and then to decide the particular set of factors affecting landslide for the selected area. The factors analyzed were selected by expert experiment analysis and principal component analysis (PCA). Those two scenarios were assessed by logical regression analysis (LR). The success rate (SR) curve and the cumulative area (CA) curve were used to validate and compare the results.
2 Materials and methods
The landslide distribution and thematic layers in the assessment of landslide susceptibility were prepared by sensing image interpretation, basic map digitization and extensive field investigation.
Expert experiment analysis was conducted to decide the preliminary scenario based on the field investigation and simply spatial analysis between factors and landslide.
PCA was carried out to examine the factors, which were decided by expert experiment analysis. A new scenario was decided by four main factors, such as slope, elevation, fault and land cover.
LR was conducted to two scenarios for producing the landslide susceptibility maps of the study area.
3 Results
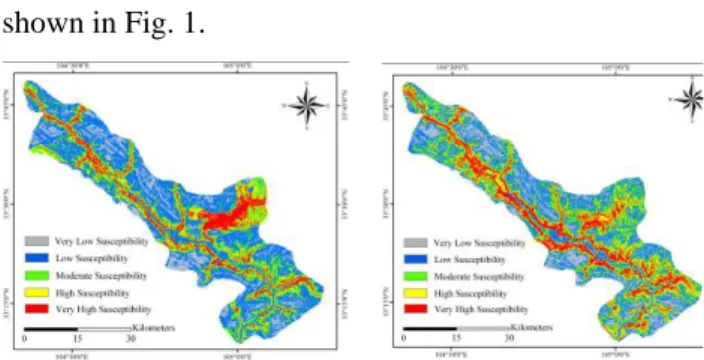
The landslide susceptibility maps were divided into five classes based on the normal distribution law as shown in Fig. 1.
Fig. 1 landslide susceptibility maps for two scenarios by LR 4 Validation and comparison
To validate and compare the performance and difference of two scenarios, SR curve and CA curve were plotted and the respective cumulative area under the curve were concluded for the two landslides susceptibility maps. The results are shown in Fig. 2.
Fig.2 Success rates curve and cumulative area curve 5 Conclusions
The validated results show that the new scenario has better performance than the preliminary one. The result reveals that PCA is a good method to decide the reasonable factors for the assessment of landslide susceptibility or hazard.