Dual roles of the plasma membrane calcium ATPases for presynaptic Ca2+ homeostasis and the modulation of H+ gradient in synaptic vesicles
著者(英) Yoshiyasu Ono
学位名(英) Doctor of Philosophy in Science 学位授与機関(英) Doshisha University
学位授与年月日 2019‑09‑20
学位授与番号 34310甲第1046号
URL http://doi.org/10.14988/di.2020.0000000066
Dual roles of the plasma membrane calcium ATPases for presynaptic Ca
2+homeostasis and the modulation
of H
+gradient in synaptic vesicles
DOCTORAL DISSERTATION
A thesis submitted in partial fulfillment of the requirements for the degree of Doctor of Philosophy
By:
Yoshiyasu Ono
Supervisor:
Shigeo Takamori
Graduate School of Brain Science Doshisha University
September 2019 Kyoto, Japan
Table of contents
Abbreviations………iii
List of Figures and a Table………..v
Abstract………..……….1
1. Introduction………...3
1.1 Synaptic transmission………...3
1.2 Quantal hypothesis of neurotransmitter release………...5
1.3 Synaptic vesicle recycling………...6
1.3.1 Exocytosis………...….8
1.3.2 Endocytosis………...12
1.3.3 Neurotransmitter uptake………...14
1.4 Regulation of the µH+………....17
1.5 The candidates of Ca2+ transporters on SVs………....19
1.6 The aim of this thesis work………...23
2. Material and methods……….……...25
2.1 Study approval………25
2.2 Animals………...25
2.3 One-cell embryo microinjection……….26
2.4 One-step generation of double gene knockouts of SV2A/2B and SV2B/2C………….26
2.5 Synaptic vesicle isolation………....27
2.6 Measurement of vesicle acidification with acridine orange………....28
2.7 Calculation of free calcium concentrations……….………31
2.8 Measurement of calcium uptake……….………32
2.9 Western blot analysis………..……….33
2.10 Molecular cloning of PMCA1-SEP, Syntaxin-1a–SEP and SypHy………..33
2.11 Neuronal cultures………...34
2.12 Immunostaining………....34
2.13 Live imaging of SEP………... ...35
3. Results………...…….……….39
3.1 A Ca2+/H+ exchanger in SVs operates at neutral pH….……….….39
3.2 The vesicular Ca2+/H+ exchanger exhibits high affinity to Ca2+...42
3.3 SV2s are not responsible for Ca2+/H+ exchange in SVs…………...………47
3.4 The plasma membrane Ca2+ ATPases (PMCAs) mediate Ca2+/H+ exchange in SVs…....51
3.5 The PMCAs, but not SV2s, are responsible for the majority of Ca2+ transport into SVs at neutral pH………...55
3.6 PMCA1-pHluorin localizes in acidic compartments at presynaptic terminals………...57
3.7 PMCA1-SEP recycles at presynaptic terminals………..…61
4. Discussion………..……...65
5. Appendix………..………...71
6. Bibliography……… ………...…...77
7. Acknowledgements………...…………...…...88
Abbreviations
AO Acridine orange AP Action potential Baf Bafilomycin CCP Clathrin-coated pits
CME Clathrin-mediated endocytosis CPA Cyclopiazonic acid
CSP Cysteine string protein DC Divalent cation
ΔpH pH gradient across the synaptic vesicle membrane
Δψ Membrane potential across the synaptic vesicle membrane ΔμH+ Proton electrochemical gradient
G-protein GTP-binding protein K & R Kiss-and-run IR Ionotropic receptor LEV Levetiracetam
LP2 Crude SV fraction, lysate pellet 2 NT Neurotransmitter
Q10 Temperature co-efficient RIM Rab3-interacting molecule PMCA Plasma membrane Ca2+ ATPase SERCA Sarcoplasmic endoplasmic reticulum SEP Super-ecliptic pHluorin
SNARE Soluble NSF attachment protein receptor
SV Synaptic vesicle
SV2 Synaptic vesicle-associated glycoprotein 2 SypHy Synaptophysin-super-ecliptic pHluorin TeNT Tetanus toxin
VAChT Vesicular acetylcholine transporter
VAMP vesicle-associated membrane protein, synaptobrevin V-ATPase Vacuolar-type H+-ATPase
VGAT Vesicular GABA transporter VGLUT Vesicular glutamate transporter VMAT Vesicular monoamine transporter VNT Vesicular neurotransmitter transporter VNUT Vesicular nucleotide transporter
List of Figures and a Table
Figure 1-1 Characteristics of the chemical synapse.
Figure 1-2 The synaptic vesicle cycle.
Figure 1-3 Molecular organization of the presynaptic release machinery.
Figure 1-4 A molecular model of an average synaptic vesicle.
Figure 1-5 Four proposed modes of SV endocytosis at synapses.
Figure 1-6 Vesicular neurotransmitter uptake.
Figure 1-7 Electrogenic property of the V-ATPase.
Figure 1-8 Effects of Ca2+ uptake on ΔpH of isolated SVs at pH 8.5.
Figure 1-9 Absence of SV2B is associated with elevated resting presynaptic Ca2+. Figure 2-1 Purification of SVs from rat or mouse brains.
Figure 2-2 The characteristics of acridine orange and its response to acidification.
Figure 2-3 The synapto-pHluorin (spH) assay.
Figure 3-1 Ca2+/H+ exchange activity attenuates pH in synaptic vesicles at neutral pH.
Figure 3-2 Contaminated Ca2+ in experimental solutions was determined using a fura-2 assay.
Figure 3-3 Apparent affinity of the Ca2+/H+ exchanger on SVs.
Figure 3-4 Selectivity of the Ca2+/H+ exchanger for other divalent cations.
Figure 3-5 Selectivity of the Ca2+/H+ exchanger of VGLUT-containing SVs for other divalent cations.
Figure 3-6 SV2s do not confer Ca2+/H+ exchange.
Figure 3-7 The raw data of the western blotting of Figure 3-6a.
Figure 3-8 PMCAs predominantly contribute to Ca2+/H+ exchange.
Figure 3-9 Contribution of PMCAs to divalent cations/H+ exchange.
Figure 3-10 PMCAs predominantly contribute to Ca2+ uptake into SVs independent of H+
electrochemical gradient generated by V-ATPase.
Figure 3-11 Localization of PMCA1-pHluorin in acidic compartments at presynaptic terminals of cultured hippocampal neurons.
Figure 3-12 Localization of PMCA1-pHluorin, SypHy and Syntaxin-1a-SEP in acidic compartments at presynaptic terminals of cultured hippocampal neurons.
Figure 3-13 Activity-dependent recycling of PMCA1-pHluorin at presynaptic terminals.
Figure 3-14 Activity-dependent recycling of PMCA1-pHluorin at presynaptic terminals with or without TeNT.
Figure 4-1 Ca2+ clearance model mediated by SVs at presynaptic bouton.
Table 5-1 Published association constants for BAPTA and ATP, as well as the ΔH values for BAPTA and ATP.
Abstract
Ca2+ transport into synaptic vesicles (SVs) at the presynaptic terminals has been proposed to be an important process for regulating presynaptic [Ca2+] during stimulation as well as at rest.
However, the molecular identity of the transport system remains elusive. Previous studies have demonstrated that isolated SVs exhibit two distinct Ca2+ transport systems depending on extra- vesicular (cytosolic) pH; one is mediated by a high affinity Ca2+ transporter which is active at neutral pH and the other is mediated by a low affinity Ca2+/H+ antiporter which is maximally active at alkaline pH of 8.5. In addition, synaptic vesicle glycoprotein 2s (SV2s), one of the major SV components, have also been proposed to contribute to Ca2+ clearance from the presynaptic cytoplasm, although Ca2+ transport activity conferred by SV2s has never been demonstrated directly.
In this thesis, I show that, at physiological pH, the plasma membrane Ca2+ ATPases (PMCAs) are responsible for both the Ca2+/H+ exchange activity and Ca2+ uptake into SVs. The Ca2+/H+ exchange activity monitored by acidification assay exhibited high affinity for Ca2+ (Km ~ 400 nM) and characteristic divalent cation selectivity for the PMCAs. Both activities were remarkably reduced by PMCA blockers, but not by a blocker of the ATPase that transfers Ca2+ from the cytosol to the lumen of sarcoplasmic endoplasmic reticulum (SERCA) at physiological pH.
Furthermore, I rule out the contribution of SV2s, putative Ca2+ transporters on SVs, since both Ca2+/H+ exchange activity and Ca2+ transport were unaffected in isolated vesicles derived from SV2-deficient brains.
Finally, using a PMCA1-pHluorin construct that enabled us to monitor cellular distribution
and recycling properties in living neurons, I demonstrated that PMCA1-pHluorin localized to intracellular acidic compartments and recycled at presynaptic terminals in an activity-dependent manner. In addition to the well-known function of plasma membrane PMCAs for Ca2+
homeostasis in the presynaptic cytoplasm, my results collectively imply that vesicular PMCAs may play pivotal roles in both presynaptic Ca2+ homeostasis and the modulation of H+ gradient in SVs.
1. Introduction
1.1 Synaptic transmission
Neural networks consisting of neurons govern all brain functions such as sensory cognition, motor control, emotion, learning and memory. A single neuron is composed of three major compartments: a cell body, where the nucleus, protein synthesis machinery and several other organelles are located, dendrites, which provide a large surface to receive synaptic inputs from other nerve cells by forming extensive branches called ‘dendritic trees’, and axons, which are long processes built to conduct nerve impulses from the cell body to the other nerve cells. Axonal branches possess morphologically distinct regions called boutons, which are club-shaped enlargements attached very close to the cell bodies or to the dendrites of other neurons. The place of close contact between two neurons where the neuronal signals are transmitted is called
“synapse”, and the narrow space between the two neurons is called the synaptic cleft. Synapses are classified broadly into two types based on their mechanism of transmission: electrical synapses and chemical synapses. At the electrical synapses, the two communicating neurons are linked together by gap junctions, which consist of precisely aligned channels of the two neurons
1. On the other hand, at chemical synapses, the information is transmitted via release of chemical signals called neurotransmitters from the presynaptic neuron to postsynaptic neurons through the synaptic clefts (Figure 1-1a). Prior to release, the neurotransmitter molecules are stored in spherical, membrane-bound organelles called synaptic vesicles (SVs) (Figure 1-1). The principal feature of chemical synapses, which are the most abundant type of synapse in the nervous system, is the accumulation of synaptic vesicles near the presynaptic membrane (Figure 1-1b).
Figure 1-1 Characteristics of the chemical synapse.
(a) Schematic representation of the mechanism of the synaptic transmission. The red part of the left picture shows the synapse, and the right picture is the enlarged figure of the synapse.
The neurotransmitters (NTs) are loaded into synaptic vesicles (SVs), and are released to the synaptic cleft upon the arrival of an action potential (AP). Then, the ionotropic receptors (IR) at the postsynaptic cells are activated by the neurotransmitters, leading to alterations of the postsynaptic membrane potential.
(b) An electron micrograph of a synapse. The small black particles at the presynaptic cell are synaptic vesicles. Modified from the picture of the website:
http://whitney.med.yale.edu/gsdl/cgi-bin/library?c=palade&a=d&d=DpaladeNerJ.
The sequence of events involved in synaptic transmission at a chemical synapse occurs as follows: First, a nerve impulse in the form of a brief electrical discharge, called an action potential (AP), invades the presynaptic bouton, and depolarizes the presynaptic membrane. The membrane
Synapse AP
Pre Post SV
NT
IR
a b
depolarization causes an opening of voltage-dependent Ca2+ channels at the presynaptic plasma membrane, resulting in an elevation of presynaptic Ca2+ concentrations by an influx of extracellular Ca2+. This triggers SVs to fuse with the presynaptic membrane, a process called exocytosis, which leads to release of their neurotransmitter contents into the synaptic cleft. Then, the neurotransmitter molecules diffuse across the synaptic cleft and bind to specific receptors at the postsynaptic membrane (Figure 1-1). There are two types of postsynaptic receptors, which differ in their structures and mechanisms by which neurotransmitter biding is translated into the postsynaptic responses. One type is the ionotropic receptors, which contain membrane-spanning domains that form an ion channel (Figure 1-1). The other type is the metabotropic receptors, which do not have an ion channel structure. Instead, neurotransmitter binding to these receptors activates intermediate molecules called G-proteins (GTP-binding proteins), which interact either directly with ion channels or with other effector proteins, such as phospholipase C, that regulate ion channels or other signaling pathways.
1.2 Quantal hypothesis of neurotransmitter release
One of the most prominent features in neurotransmitter release is their quantal nature.
Pioneering work by Katz and colleagues in early 1950s, accompanied by the realization
of clusters of homogeneously sized membrane sacs at the presynaptic terminals (Figure
1-1b)
2, proposed that neurotransmitters are released as a shape of quantal packets of
neurotransmitters that are stored in synaptic vesicles
3,4. The amount of neurotransmitter
released from a presynaptic terminal is determined by the number of available vesicles,
the probability of the available vesicles to be released and the amount of neurotransmitters
in a vesicle. The strength of neurotransmission, which can be measured electrophysiologically as postsynaptic currents (PSCs), can be therefore described as the product of these parameters;
PSCs = N × Pr× q
where N, Pr, and q represent the number of release sites (or number of vesicles available for release), release probability and quantal size, respectively. The quantal size is essentially defined by both the amount of neurotransmitters from a single vesicle and the sensitivity of postsynaptic receptors. Although the original quantal hypothesis predicted that the amount of neurotransmitters in a single vesicle is constant, various presynaptic factors are currently known to modulate the amount of neurotransmitters
5(see 1.3.3 for detail).
1.3 Synaptic vesicle recycling
At presynaptic terminals, Ca2+-triggered SV exocytosis is followed by recapture and reuse of presynaptic membranes to form new SVs, which is called endocytosis. The newly formed SVs are then re-acidified by the activity of the vacuolar-type H+-ATPase (V-ATPase) and are loaded with neurotransmitters for the next round of exocytosis. This trafficking cycle is called synaptic vesicle recycling, which enables the synapse to sustain neurotransmission particularly in response to high-intensity synaptic inputs 6. As described, one complete round of SV recycling has three steps: exocytosis, endocytosis, and neurotransmitter loading (Figure 1-2). To fulfill the complete synaptic vesicle recycling, SVs must be equipped with variety of proteins, including proteins required for membrane trafficking and fusion, a Ca2+ sensor that triggers Ca2+-dependent rapid
fusion of SVs to the plasma membrane, and proteins required for neurotransmitter uptake. Since SVs are the smallest organelle with limited space (approximately 40 nm in diameter) and it is feasible to obtain biochemically amenable amount from native mammalian brains, SVs are one of the best-characterized organelle at molecular levels 7. Since late 1980s, intensive work has been made to identify key components in SV functions. Biochemical analysis of each component as well as interactions with other components has revealed protein complexes that are required for particular processes. Furthermore, identification of genes encoding SV proteins allowed us to generate animal models which essentially lacked individual genes. Morphological, biochemical and physiological assessments of neural preparations or SV preparations from such animals have deepened our knowledge on molecular mechanisms of neurotransmitter release.
In the following sections, I will briefly describe our current knowledge of each step and underlying molecular mechanisms.
Figure 1-2 The synaptic vesicle cycle.
The information is transferred via release of neurotransmitter molecules (NT; red dots) stored in SVs (green circles) at the presynaptic terminal. The neurotransmitters are loaded into SVs by cooperation of several SV proteins among which the V-ATPase and the vesicular neurotransmitter transporters play the main role. SVs filled with the neurotransmitters are translocated to the active zones (the blue thick region) where SV docking and priming occur.
Upon arrival of an AP, voltage-dependent Ca2+ channels open, which in turn results in an increase in the concentration of Ca2+ at the active zones. Then, the Ca2+ increment triggers fusion of the SV membrane with the presynaptic membrane, causing the release of their contents. The release occurs via either a transient fusion pore (kiss and run) or a full collapse of SVs into the presynaptic membrane. After exocytosis, SV membranes and their constituents are recaptured from the presynaptic membrane via clathrin (dashed pink line)- mediated endocytosis. After clathrin uncoating, SVs are regenerated in the nerve terminal, which probably involves membrane trafficking through a presynaptic endosomal compartment. Red arrows indicate processes to achieve exocytosis, whereas yellow arrows show multiple modes of endocytosis and the subsequent vesicle regeneration process. . Modified from Südhof and Rizo, 2011 8.
1.3.1 Exocytosis
Exocytosis is composed of three distinct steps: vesicle docking, vesicle priming, and vesicle fusion. Vesicle docking is a process in which synaptic vesicles are physically docked with plasma membranes. In this process, RIMs (Rab3-interacting molecules) localized at active zones 9 are thought to play a key role (Figure 1-3). These proteins also bind to small GTPases, such as Rab3 and Rab27, which are localized on SVs 10 as indicated in Figure 1-3 and Figure 1-4, thereby tethering SVs to the active zone.
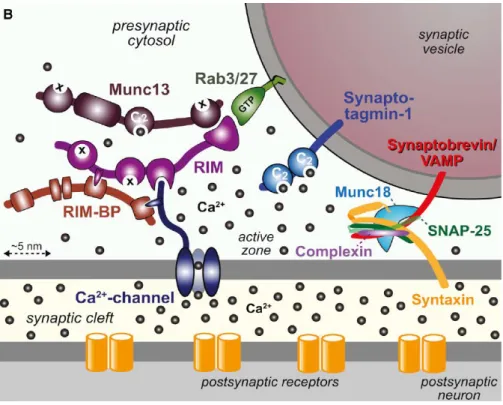
Figure 1-3 Molecular organization of the presynaptic release machinery.
A schematic drawing of the molecular machinery mediating Ca2+-triggered SV exocytosis.
The drawing depicts a part of a docked synaptic vesicle on the top right and the presynaptic active zone in the middle. The three functional elements of the neurotransmitter release machinery are depicted from right to left. On the right, the core fusion machine composed of the SNARE/Munc 18 protein complex is shown; this machine comprises the SNARE proteins synaptobrevin/VAMP, syntaxin-1, and SNAP-25 and Munc18-1. The Ca2+ sensor synaptotagmin-1 is depicted in the middle; it is composed of a short intravesicular sequence, a single transmembrane region, and two cytoplasmic C2 domains that bind Ca2+, and it functions using complexin (bound to the SNARE complex) as its cofactor. On the left, the active zone protein complex containing RIM, RIM-BP, and Munc13 and a Ca2+ channel in the presynaptic plasma membrane is shown. In this protein complex, RIM binding to specific target proteins coordinates all three functions of the active zone: RIM binding to vesicular rab proteins (Rab3 and Rab27) mediates vesicle docking; and RIM binding to the central priming factor Munc13 activates vesicle priming; and RIM binding to the Ca2+ channel, both directly and indirectly via RIM-BP, recruits the Ca2+ channels within 100 nm of the docked vesicles for fast excitation-secretion coupling. The overall design of the neurotransmitter release
machinery depicted here enables in a single nanodevice fast and efficient triggering of release in response to action potentials by combing a fusion machine with a Ca2+ trigger and an active zone protein complex that positions all elements into appropriate proximity.
Modified from Südhof, 2013 10.
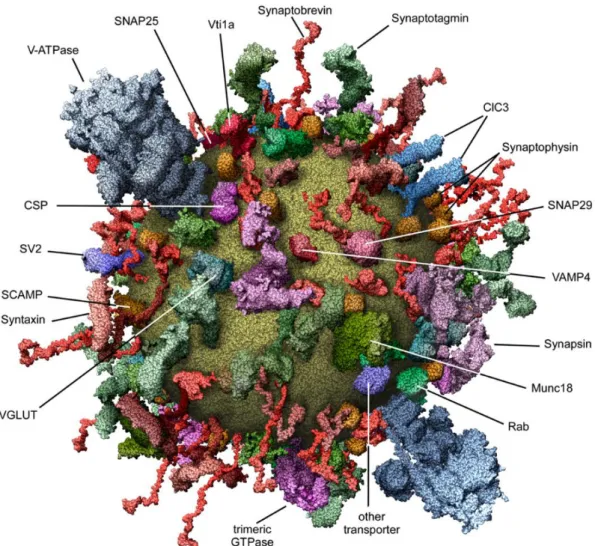
Figure 1-4 A molecular model of an average synaptic vesicle.
A scaled, schematic representation of an average synaptic vesicle based on the quantitative analysis of the major synaptic vesicle components including the lipids and proteins. The major synaptic vesicle residents are Synaptobrevin (~70 copies), Synaptophysin (~30-40 copies), Synaptotagmin (~15 copies), VGLUT (for a glutamatergic vesicle: ~10 copies) and the V-ATPase (~1-2 copies). The radius of a synaptic vesicle is ~20 nm. Taken from Takamori et al., 2006 7.
The vesicle docking is followed by vesicle priming. The vesicle priming is a process where synaptic vesicle fusion machinery is primed into the energized form for setting the stage for fast Ca2+ triggering of neurotransmitter release. In this process, SNARE (soluble NSF attachment protein receptor) complexes are formed partially. SNARE complexes are composed of three SNARE proteins: synaptobrevin 2 (also known as VAMP-2), which is indicated in Figure 1-3 and Figure 1-4, localized at synaptic vesicle membranes, syntaxin-1 and SNAP-25 localized at plasma membranes 10. Before the complexes are formed, syantaxin-1 is transformed from a closed conformation into an open conformation by Munc13 10, as indicated in Figure 1-3 and Figure 1- 4. In addition, Munc18-1 binds to the synataxin-1 and regulates the formation of the SNARE complexes 10 as indicated in Figure 1-3 and Figure 1-4. In addition, cysteine string proteins (CSPs) as well as synucleins are known to modulate the SNARE complex assembly by direct binding to SNAP-25 or synaptobrevin 2, respectively 11,12.
After the vesicle priming, the vesicle fusion occurs. Upon SV fusion, SNARE complexes are fully assembled, which forces the fusing synaptic vesicle membranes and plasma membranes into close proximity. As a result, the SNARE complexes open fusion pores, which cause release of neurotransmitters from the vesicle lumen into the synaptic cleft. After the fusion, the SNARE complexes reside in the plasma membranes are disassembled by the action of AAA+-ATPase NSFs and its adaptors, SNAPs 13.
A final step of SV exocytosis is triggered by Ca2+. Intracellular free Ca2+ concentration in a presynaptic terminal ([Ca2+]pre) is maintained as low as 0.05 – 0.1 µM mainly by the activity of the plasma membrane Ca2+-ATPases (PMCAs) 14,15. An opening of Ca2+ channels clustered at the active zones causes a rapid increase of [Ca2+]pre to ~ 0.5 µM, and 10 APs at 100 Hz increased
[Ca2+]pre further to ~2 µM 14.
Synaptotagmin 1 is a type I integral membrane protein preferentially expressed on SV membrane and exhibits low binding affinity to Ca2+16. A large body of evidence has indicated that it is synaptotagmin 1 that synchronizes Ca2+ influx through the presynaptic Ca2+ channels to the rapid SV exocytosis. Although the mechanism of synaptotagmin 1 in Ca2+-dependent SV exocytosis has not been completely understood, it has been proposed that its interaction with both SNAREs and acidic phospholipids is critically involved in this process.
Other than SNAREs and Synaptotagmin 1, multiple proteins including complexin and munc- 18 are involved in Ca2+-dependent SV exocytosis, and serve as regulatory elements in this series of molecular cascades (Figure 1-3) 10.
1.3.2 Endocytosis
Until recently, clathrin-mediated endocytosis (CME) (Figure 1-5) has long been thought to be a dominant endocytic pathway at synaptic boutons because previous work using clathrin- knockdown appeared to cause severe impairment of SV endocytosis 17. The initial step of the CME pathway is formation of a clathrin-coated pits (CCP) with narrow necks at the synaptic membranes, which is followed by fission of this neck due to membrane scission mediated by dynamin, one of the GTPases 18. After the fission, the vesicle sheds all the components of the coats.
In addition to the CME, other modes of endocytosis have also been proposed: kiss-and-run (K&R) endocytosis, bulk endocytosis, and ultrafast endocytosis (Figure 1-5). K & R is endocytosis likely coupled with exocytosis at the same site. An SV fuses with the plasma
membrane and is pinched off at the same location, while the SV retains its gross shape without undergoing full integration into the planar membrane 19.
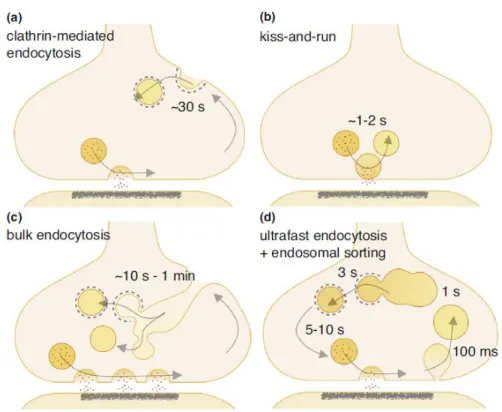
Figure 1-5 Four proposed modes of SV endocytosis at synapses.
(a) Full fusion of SVs followed by diffusion of SV constituents and endocytosis via CME at distal sites. (b) K & R: SV fusion pore opening and closing at the active zone which does not require full fusion of the SV membrane with the plasma membrane. (c) Intense stimulation- mediated fusion of multiple SVs followed by activity-dependent bulk endocytosis from distal sites. SVs may be reformed from cisternae using clathrin-dependent or clathrin-independent mechanisms. (d) Full fusion of SVs followed by ultrafast endocytosis and reformation of SVs by clathrin coats budding from endosomes. Note that time required for each mode of endocytosis substantially varies, ranging from ~100 ms for ultrafast endocytosis to ~1m min for bulk endocytosis. Taken from Watanabe et al., 2017 20.
Bulk endocytosis occurs mainly during high neural activity 21, which is independent of clathrin 22. Vacuoles retrieved by this endocytosis display large sizes (~80 -300 nm in diameter)
22-24, as compared to the size of a SV (~40 nm in diameter) 25. Capacity of cargo selectivity of bulk endocytosis is poor compared to that of CME (Miller and Heuser, 1984; Nicholson-Fish et al., 2015). On the other hand, bulk endocytosis possesses high capacity to retrieve plasma membranes compared to CME 26-28. Therefore, bulk endocytosis likely serves as an emergency endocytosis route for synapses to avert their surface expansion during periods of intense synaptic vesicle exocytosis.
Very recently, by combining optogenetic neural stimulation and a rapid freezing technique for sample processing for electron microscopy, ultrafast endocytosis that occurs at 200 times the speed of CME 29 has been proposed. Unlike CME, vesicles generated by this rapid endocytosis are not decorated by clathrin coats and their size is relatively larger than those generated by CME (~82 nm in diameter, ~2 fold larger than SVs) 29. It is currently under intense debate which mode of endocytosis, CME or ultrafast endocytosis, is the predominant form of SV endocytosis at the presynaptic terminals.
1.3.3 Neurotransmitter uptake
Irrespective of the modes of endocytosis, newly regenerated SVs are empty and have to be reloaded with neurotransmitter molecules for the next round of exocytosis. Since classical neurotransmitters such as glutamate, GABA, biogenic monoamines and acetylcholine are locally generated or supplied at the presynaptic cytoplasm, SVs can be loaded with them immediately after their generation. Neurotransmitter transporters of synaptic vesicles (vesicular
neurotransmitter transporters; VNTs) are secondary transporters and, therefore, require a driving force generated by a concentration gradient of other ions. Unlike plasma membrane neurotransmitter transporters that utilize Na+ concentration gradient across the plasma membrane, VNTs use a proton gradient across the SV membrane generated by the V-ATPases. Since proton has a positive charge, the entry of protons into SVs creates both a H+ chemical gradient (pH) and an electrical gradient (inside positive; also referred to as ), a sum of which is called a proton electrochemical gradient (µH+). Neurotransmitters are transported by using either ,
pH or both depending on physical properties of neurotransmitters and the respective transporters
(see also below).
So far, five distinct families of VNTs have been molecularly identified. Three vesicular glutamate transporters (VGLUT1~3) 30-36, one vesicular GABA transporter 37 which is also referred to as vesicular inhibitory amino acid transporter, VIAAT 38 (since it also transports glycine), two vesicular monoamine transporters (VMAT1 and VMAT2) 39,40 which transport several biogenic amines such dopamine, histamine, serotonin with different affinities 41, vesicular acetylcholine transporter (VAChT) 42 and vesicular nucleotide transporter (VNUT) 43. Consistent with their distant amino acid sequence homologies, these transporters utilize pH and to different extents (Figure 1-6). Although the detail mechanisms are still under intense debate, it is currently proposed (mainly from biochemical experiments using native SVs or reconstituted transporters) that transport of negatively charged substances such as glutamate and nucleotide depends primarily on , whereas that of positively charged substances such as monoamines and ACh depends on pH. Uptake of zwitter-ionic substances such as GABA depends equally on both gradients 44. Therefore, alteration of the balance between pH and has strong impact on the
rate of transport as well as the net amount of neurotransmitters accumulated into the SV lumen.
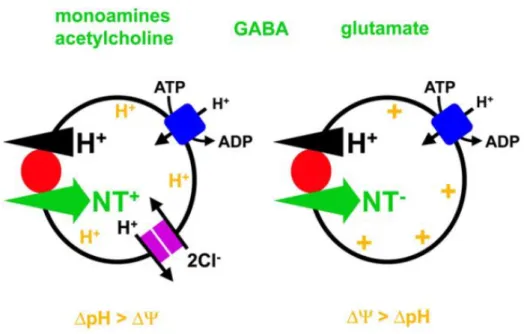
Figure 1-6 Vesicular neurotransmitter uptake.
The V-ATPase (blue) generates ΔμH+ that drives the accumulation of classical neurotransmitters (NT) into SVs. The movement of H+ down their electrochemical gradient is coupled to the transport of transmitter in the opposite direction. Despite this common H+ exchange mechanism, different vesicular neurotransmitter transporters (red) rely to differing extents on the two components of ΔμH+, the chemical gradient ΔpH and the electrical gradient Δψ. Vesicular monoamine and ACh transport, which involves the exchange of protonated cytosolic transmitter for two luminal H+, involves more H+ than charge movement and hence depends more on ΔpH than Δψ. On the other hand, transport of negatively charged glutamate depends more on Δψ than ΔpH. In the case of the zwitterion GABA, the transport equally depends on both ΔpH and Δψ. Intracellular chloride carriers such as ClCs (violoet) would promote vesicle acidification by dissipating the charge developed by the V-ATPase, secondarily activating the H+ pump to make a larger ΔpH. Taken from Edwards, 2007 44.
In addition to alteration of the µH+, multiple factors, which can potentially affect quantal
size, have been proposed. First, alteration of cytosolic neurotransmitter concentrations may cause the alterations of quantal size. Biochemical assays using isolated SVs have indicated that higher the cytosolic concentrations of neurotransmitters are, more transmitters are transported into SVs with faster rates, although the transport system for neurotransmitters exhibits saturable nature 45,46. This notion was substantiated by the fact that injection of exogenous glutamate into the presynaptic terminals of the calyx of Held synapses increased the amplitudes of excitatory postsynaptic currents 47-49. Furthermore, expression of the vesicular transporters affects quantal sizes in multiple preparations. This was particularly supported by the experiments where VGLUTs were overexpressed either in rodent hippocampal neurons 50 or in neuromuscular junctions of drosophila lavae 51. Since postsynaptic receptors are often not saturated by the amount of neurotransmitters released from a single synaptic vesicle, changes in quantal sizes by these mechanisms may have profound impact on the efficacy of neurotransmission.
1.4 Regulation of the µH+
How is the balance between pH and controlled? Since the V-ATPase is an electrogenic pump, entry of few protons already creates large , and this (inside positive) may repel the entry of further protons. Therefore, relatively large rather than pH is built up in the absence of counter-ion movements. In turn, when counter-ions, such as inward movement of anions or outward movement of cations, were present, more protons could enter into SVs, thereby building up a larger pH at the expense of (Figure 1-7). Thus, the balance between pH and is regulated by the permeability of the SV membrane to various charged substances (e.g. ions) and their concentration gradients.
Figure 1-7 Electrogenic property of the V-ATPase.
V-ATPase (blue) utilizes an energy produced by ATP hydrolysis and generate proton gradient (ΔµH+) consisting of two components (Δψ and ΔpH). Since the V-ATPase is electrogenic, H+ influx is critically restricted by Δψ, and either accompanying anion influx or cation efflux is necessary to facilitate proton transport into the SV lumen. SV contain a putative Cl– channel (pink; VGLUTs or ClC-3 may confer this activity). (A) In the presence of low Cl– (or scant Cl– permeability), H+ influx is small and larger Δψ is generated. (B) In the presence of high Cl–, Cl– influx would dissipate Δψ, and more H+ can flow into SVs. As a result, largerΔpH is built up. (C) The relationship between Δψ and ΔpH as a function of external Cl– concentrations.
Both components can be monitored by fluorescent indicators such as acridine orange (for ΔpH) or oxonol (forΔψ). Modified from Takamori, 2012 52.
In fact, SVs contain various transporters or channels for ions that directly or indirectly modulate H+ flux across SVs. For instance, it has been firmly demonstrated that SVs exhibit a Cl– conductance that serves as a shunting current for H+, resulting in an increase in net proton influx and thus a generation of larger pH. CLC-type chloride channel family, ClC-3, was originally proposed as a prime candidate 53. However, subsequent studies have demonstrated that, at least for glutamate-containing SVs, VGLUTs are responsible for Cl–-dependent facilitation of pH.
Importantly, the Cl– conductance in VGLUTs has substantial impact on glutamate loading 54, although precise mechanisms of Cl– action on glutamate transport is still elusive 55.
More recently, cation/H+ exchange activity conferred by either Na+/H+ exchangers (NHEs) or VGLUTs (in the case of glutamate-containing vesicles) were shown to decrease pH and consequently facilitate . Which isoform(s) of NHEs are involved, the cation specificities of the exchangers (Na+ versus K+), and their transport stoichiometry are currently under intense debate 56,57.
In stark contrast, the contribution of divalent cations such as Ca2+ and Zn2+ to the regulation of µH+ has received less attention. To date, the mechanism and molecular entity of the transporting molecule(s) remain elusive. In the next chapter, I will explain current knowledge of the Ca2+ carriers on SVs, which is the main topic of this thesis work.
1.5 The candidates of Ca2+ transporters on SVs
Classical studies using SV fraction isolated from the electric organ of Torpedo marmorata revealed that SVs exhibited an ATP-dependent active Ca2+ transport activity 58-60. Consistent with this, a transient increase of Ca2+ in the SV lumen was observed after stimulation at the cholinergic
synapse of the electric organ of Torpedo marmorata 61, suggesting that SVs can function as a Ca2+
store at presynaptic terminals in a physiological context.
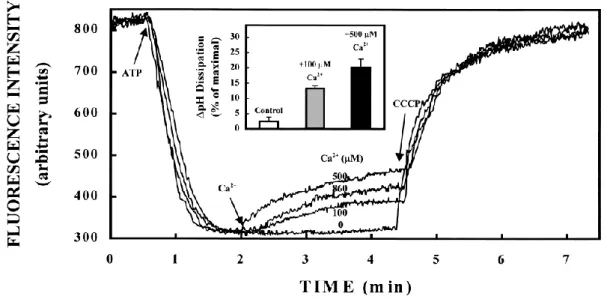
Efforts to decipher the Ca2+-transporting protein(s) in mammalian SVs have revealed, at least, two distinct activities. One is the vanadate-sensitive P-type Calcium ATPases, which were fully active at neutral pH, and whose activity was potently inhibited by vanadate (a broad inhibitor of P-type ATPases)62. In fact, two P-type ATPases, plasma membrane Ca2+ ATPases (PMCAs) and sarcoplasmic endoplasmic reticulum Ca2+ ATPases (SERCAs) have been identified in the SV proteome 7, although there are no evidence to demonstrate that these ATPases are generally functioning in native SVs. In addition to these primary ATPases well characterized in different organelles, purified SVs also exhibited a Ca2+/H+ exchange activity conferred by a hitherto molecularly-unidentified protein optimally operational at pH 8.5 62,63 (Figure 1-8). Not only characteristic responses to specific inhibitors, these two transport systems also exhibited substantial differences in their affinities for Ca2+. While Km of the vanadate-sensitive Ca2+ ATPase lies in the order of several hundred nM, Km of the Ca2+/H+ antiporter exceeds 300 μM, which far surpasses physiological calcium concentrations at presynaptic terminals 14. Moreover, these transport systems exhibit characteristic dependence on Ca2+ concentrations. Notably, Ca2+ ATPase activity increases with Ca2+ concentration in the medium, reaching a maximum at ~25 μM, whereas its activity is inhibited at higher Ca2+ concentration and is completely abolished at ~500 μM Ca2+62.
Figure 1-8 Effects of Ca2+ uptake on ΔpH of isolated SVs at pH 8.5.
The ΔpH of SVs isolated from sheep brain cortex was monitored using acridine orange (AO), a fluorescent ΔpH indicator. The decrease in AO fluorescence indicated acidification of the SV lumen. The reaction was started by adding ATP which activated V-ATPase, resulting in SV acidification monitored by quenching of AO fluorescence as described. At 2 min of the reaction, additions of Ca2+ reversed the AO fluorescence, extend of which depended on Ca2+
concentration, implying that H+ efflux from SVs was induced upon Ca2+ entry. The protonophore CCCP (10 μM) was used to confirm that the pH gradient was formed by the V- ATPase. An inset represents the percentage of ΔpH reduction by Ca2+ relative to the control experiment in the absence of Ca2+. Taken from Gonҫalves et al., 1998 63.
Aside from these two SV Ca2+ transport systems, it has been conjectured that one of the major SV proteins, SV2s (Synaptic Vesicle Glycoprotein 2s), may function as Ca2+ transporters in SVs 64. SV2 was originally identified from the electric organ of Torpedo in 1985 65, and the three different mammalian orthologs (SV2A, SV2B, and SV2C) were later identified 66-68. According to their predicted structures with 12 transmembrane regions and their high
homologies with bacterial sugar transporters, transport functions have been proposed for SV2s.
Interestingly, the genetic deletion of SV2 revealed synaptic phenotypes that could be well- explained by the increase in cytoplasmic [Ca2+] 69,70 (Figure 1-9), leading to a plausible hypothesis that SVs may function as vesicular Ca2+ transporters. On the other hand, it was also reported that deletion of SV2A/SV2B produced decreased evoked synaptic responses without causing any changes in frequencies and amplitudes of the miniature excitatory synaptic currents (EPSCs), the size of readily releasable pool of vesicles, or the apparent Ca2+ sensitivity of vesicle fusion 71, which strongly argued against the hypothesis that SV2 functions as the Ca2+ transporter.
Therefore, due to the lack of direct experimental proofs, the contribution of SV2s to the Ca2+
uptake into SVs has been enigmatic.
a b
Figure 1-9 Absence of SV2B is associated with elevated resting presynaptic Ca2+. (a) An acutely isolated rod bipolar neuron is shown with a patch pipette on its soma. The dotted square over the terminal denotes the region from which the emitted bis-fura-2 fluorescence signal, which is a calcium indicator, was collected.
(b) The average resting Ca2+ concentration in synaptic terminals held at -70 mV is significantly higher in neurons from SV2B-/- mice (KO) than those from WT littermates.
Error bars represent SEM. **p < 0.01. The internal Ca2+ concentration was determined from the ratio of fluorescence signals. Taken from Wan et al., 2010 70.
1.6 The aim of this thesis work
A primary goal of this thesis work is to identify molecules responsible for Ca2+ transport into SVs, and to clarify uncertainties and controversial hypothesis related to the transport systems. To this end, I first set up experiments to reconcile the low affinity Ca2+/H+ antiport activity, which was shown to be maximal at alkaline pH of 8.5 and exhibited low affinity for Ca2+. Although the previous data was largely reproducible, I further found that the Ca2+/H+ exchange activity exhibited much higher affinity than anticipated at neutral pH.
Second, I intended to identify which molecules, among the candidates for the vesicular Ca2+
transporter, were responsible for the high affinity Ca2+/H+ antiport. For this purpose, specific inhibitors for the P-type ATPases, as well as SV fraction derived from SV2-deficient mice, were used. These experiments revealed that PMCAs, instead of SV2s or SERCAs, are the prime candidate for the vesicular Ca2+ transporter, which was responsible for both Ca2+ uptake as well as regulation of pH gradient across the SV membrane.
Finally, since the PMCAs have been characterized as plasma membrane residents, I
examined if PMCAs could reside also on SVs and possibly recycle within presynaptic terminals in vivo. For this purpose, a DNA construct encoding a PMCA1, one of the PMCA isoforms, in which a pH sensitive green fluorescent protein (SEP) was fused to the luminal portion, was transfected in cultured hippocampal neurons for live fluorescent imaging.
2. Material and Methods
2.1 Study approval
All experiments in this study were carried out under the approval of Doshisha University Animal Committee and Recombinant DNA Experiments Committee, and of the Institutional Animal Care and Use Committee of the RIKEN Kobe branch (approval number: QA2013-04-6).
All experiments were performed in accordance with the guidelines and regulations of the respective institutions.
2.2 Animals
C57BL/6NJcl mice were purchased from CLEA or from Shimizu Laboratory Supplies, Japan.
ICR mice were purchased from SLC, Japan. All mice were given food and water ad libitum.
Animals were kept in an SPF facility with a 12-hour light and 12-hour dark cycle. The ambient temperature was maintained around 21˚C with a relative humidity of 50%. ICR mice (12 to 20 weeks old) were used as recipients. A combination anesthetic (0.75 mg/kg of medetomidine, 4.0 mg/kg of midazolam, and 5.0 mg/kg of butorphanol) was used for surgery. The anesthetics were administered to recipient mice by intraperitoneal injection. All animal experiments were approved by the Institutional Animal Care and Use Committee of the RIKEN Kobe branch (approval number: QA2013-04-6) and the Institutional Animal Care and Use Committee of Doshisha University.
2.3 One-cell embryo microinjection
C57BL/6N females (4–6 weeks old) were superovulated and mated with C57BL/6N males.
Fertilized eggs were collected from the ampulla of the oviduct of plugged C57BL/6N females by micro-dissection and kept in KSOM medium (Merck Millipore) in a 5% CO2 incubator at 37 ˚C.
Cas9 mRNA (100 ng/µL) and six gRNAs (50 ng/µL each, 300 ng/µL total) were co-injected into the cytoplasm of fertilized eggs in M2 medium (Merck Millipore) at room temperature. Details of the cytoplasmic injection procedure have been described previously 72. After microinjection, the injected embryos were cultured for 1 hr in KSOM medium (Merck Millipore) in a 5% CO2
incubator at 37˚C, then 15–30 embryos were transferred to the oviducts of recipient ICR female mice.
2.4 One-step generation of double gene knockouts of SV2A/2B and SV2B/2C
Double gene knockout (DKO) mice of SV2A/2B and SV2B/2C were generated by the triple- target CRISPR method 73. Briefly, Cas9 mRNA and sgRNAs were synthesized according to the protocol reported previously 73. All gRNAs were selected from pre-made design in Database (http://crispr.riken.jp). Cas9 mRNA (100 ng/µL) and six gRNAs (50 ng/µL each, 300 ng/µL total) were injected into the cytoplasm of fertilized eggs of C57BL/6NJcl mice. For SV2A/2B DKO, six gRNA targets were used (Sv2a_8 5’-AAGGCGAACGCATGGCAGAT-3’, Sv2a_9 5’- GCGTAAAGATCGGGAAGAAT-3’, Sv2a_25 5’-GGCAGCCTTCCTTATTGTGC-3’, Sv2b_28 5’-CTGGCAATCGAAGGGCAATC-3’, Sv2b_38 5’-GTGGACCCTCTTCTTCGTCT-3’, Sv2b_41 5’-AGGTATCGGGACAACTATGA-3’). For SV2B/2C DKO, six gRNA targets were used (Sv2b_28, Sv2b_38, Sv2b_41, Sv2c_56 5’-ACTGGAATGGAATACGAGAA-3’, Sv2c_77
5’-AGACCTATGCATACCAAATT-3’, Sv2c_78 5’-CACAAACACCTCCACGCCAT-3’).
2.5 Synaptic vesicle isolation
Crude synaptic vesicle fraction (LP2) was isolated from mouse whole brain with slight modifications 74. Briefly, whole brains from C57BL/6 (B6N) mice were homogenized in homogenization buffer (320 mM sucrose, 4 mM MgSO4, 4 mM HEPES-NaOH, pH 7.3), and applied a series of centrifugation steps as indicated in Figure 2-1. The final membrane pellet (LP2) was resuspended in standard acidification buffer (300 mM sucrose, 4 mM MgSO4, 10 or 20 mM MOPS-KOH, pH 7.2), and stored at –80˚C until use. Essentially, all fluorometric assays, unless indicated otherwise, were performed with this fraction. For determination of apparent affinity of Ca2+/H+ exchange activity and radioactive 45Ca2+ uptake, LP2 obtained from Wistar rat or B6N mouse brains was further purified as indicated in Figure 2-1. The further purified pellet (SV) was resuspended in acidification buffer and stored at –80˚C until use.
1,000 x g, 10 min
33,000 x g, 20 min 260,000 x g, 2 h Homogenate (H)
of rat or mouse whole brain
12,000 x g, 15 min S1
P1 P2
(Synaptosome)
S2 S2’
P2’
LS1
LP1
LS2
LP2 SV (LP3)
13,000 x g, 15 min
Osmotic shock
260,000 x g, 90 min
65,000 x g, 4 h Sucrose density gradient
Figure 2-1 Purification of SVs from rat or mouse brains.
A flow diagram of purification of SVs from rat or mouse brains. The homogenate was centrifuged for 10 min at 1,000 x g, and the resulting supernatant (S1) was centrifuged for 15 min at 12,000 x g. The resulting pellet (P2) was washed with homogenization buffer and re-centrifuged for 15 min at 13,000 x g to obtain crude synaptosomes (P2’). To release SVs from the synaptosomes, P2’ fraction was subjected to an osmotic shock by the addition of 9 volume of ice-cold water and the subsequent homogenization. The resulting suspension was centrifuged for 20 min at 33,000 x g. After the centrifugation, the supernatant (LS1; lysate supernatant) was centrifuged for 2 hours at 260,000 x g. The final membrane pellet (LP2) was resuspended in standard acidification buffer. In addition, as necessary LP2 was further purified by sucrose gradient centrifugation (50 – 800 mM continuous gradient). After centrifugation at 65,000 × gmax for 4 hours, turbid materials visible in the middle of the gradient (in the range of 200 to 400 mM sucrose) were pooled and sedimented by centrifugation at 260,000 × gmax for 90 min (SV fraction).The resulting pellet (SV) was resuspended in acidification buffer.
2.6 Measurement of vesicle acidification with acridine orange
Acidification measurements were performed according to previous publications using acridine orange (AO, Molecular Probes), which is permeant weak base dye, as a pH reporter 54. The pKa (~10) of this probe is higher compared to the optimum pKa (5 – 8) for reporting acidification of SVs, which cause poor signal noise ratio due to high background. On the other hand, AO provides adequate signal in response to acidification of SVs.
When AO is diluted in aqueous solutions, it is mainly monomeric, whereas upon increase in concentration will form dimers, trimers or higher order oligomers. The equilibrium between monomeric and dimeric/oligomeric AO is also affected by pH of its surrounding environment.
While at neutral pH monomeric AO (mAO) is the dominating form, a decrease in pH shifts the
equilibrium towards dimers/oligomers 75. Therefore, when AO is in the lumen of an organelle which acidifies, aggregated AO will be formed in the lumen, which cannot permeate the bilayer membranes unlike monomers. This leads to an increase in the population of aggregated AO, and in turn a decrease in the number of monomers 76 as indicated in Figure 2-2a. Since these forms of AO have distinct excitation and emission maxima, the acidification process can be monitored by measuring the optical response of either of these forms as indicated in Figure 2-2b. In conventional bulk acidification assays, emission 77 or absorbance 57,78 of mAO is monitored.
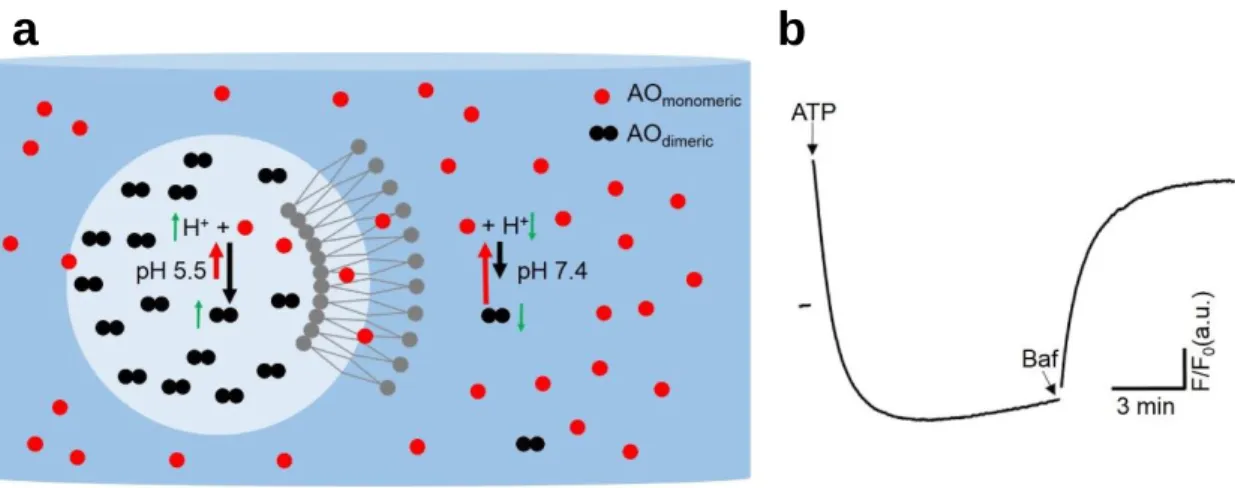
Figure 2-2 The characteristics of acridine orange and its response to acidification.
(a) Schematic representation of the proposed mechanism by which AO reports acidification of the lumen of SVs. As depicted, AOmonomeric (red circle) is membrane-permeable and highly abundant at alkaline pH of 7.4. On the other hand, AOdimeric (black double circles), which is the dominant form of AO at low luminal pH of 5.5 cannot, cannt pass the lipid bilayer of the SVs and is trapped in the acidified lumen. Upon acidification of SVs, the number of AOmonomeric molecules in the solution decreases while the number of AOdimeric in the vesicular lumen will increase.
(b) A typical trace of acidification assay with 20 μg LP2 with 1.5 μM AO in MOPS-based assay buffer containing 100 mM KCl. Addition of 2 mM ATP dramatically decreased AO
b
a
fluorescence, indicating that the lumens of SVs were acidified. Subsequent addition of 500 nM bafilomycin A1 (Baf) recovered the fluorescence signal indicating alkalization of the vesicular lumen.
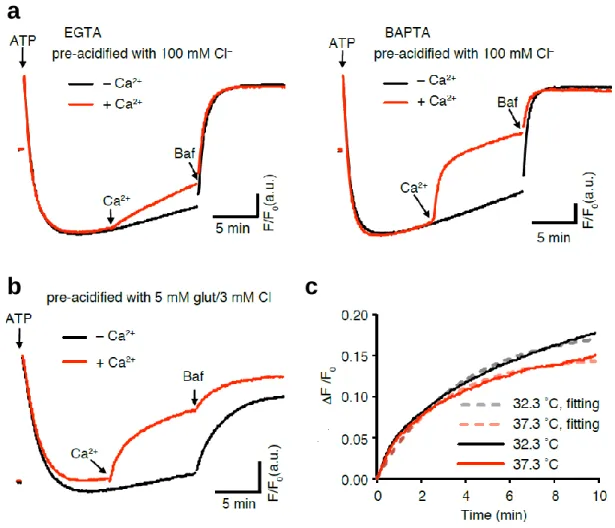
In my research, changes in AO fluorescence (excitation at 492 nm and emission at 530 nm with slit length of 2.5 nm, HMT 700V) was monitored in a Hitachi F2500 fluorometer (Hitachi, Japan) at 32˚C, unless otherwise stated 54. Typically, 20 µg of LP2 or SV fraction was preincubated in 1 ml of assay buffer (300 mM sucrose, 4 mM MgSO4, 1.5 µM AO, 10 or 20 mM MOPS, pH 7.2) with varying composition of 5 mM K-glutamate, 3 mM or 100 mM KCl, 50 µM EGTA, and 50 µM BAPTA as indicated in the figures or figure legends. After a stable baseline was achieved (usually within 10 min), 2 mM ATP was added to start acidification. Various concentrations of CaCl2 or 50 µM other divalent cations were added 10 min after the start of the acidification. At the end of recordings, a V-ATPase inhibitor, bafilomycin A1 (500 nM) was added to ensure that quenching of AO was due to proton translocation by the V-ATPase. In experiments in Figure 3-6, 3-8, and 3-9, 15 µM cyclopiazonic acid, 500 µM vanadate, or 30 µM levetiracetam was pre-incubated for 10 min before measurements. Representative traces from multiple measurements are shown in the figures. For estimation of temperature co-efficient (Q10) for the Ca2+-dependent AO de-quenching, acidification assays were performed at two different temperatures. The Q10 was calculated from an equation:
Q10=(ττ1
2)^(T10
2-T1),
in which τ1 and τ2 are time constants of recovery rates of acridine orange fluorescence after the addition of Ca2+ at temperature T1 and T2. Τ1 and τ2 were obtained by a first order exponential fitting using a Solver function in Excel software. T1 and T2 (T2 > T1) are 32.3 and 37.3 ˚C, respectively.
2.7 Calculation of free calcium concentrations
Free calcium concentration was calculated by solving simultaneous equations in four unknowns: concentration of Ca2+ binding with BAPTA ([CaBAPTA]), that of Mg2+ binding with BAPTA ([MgBAPTA]), that of Mg2+ binding with ATP ([MgATP]) and that of Ca2+ binding with ATP ([CaATP]) as follows.
KCaBAPTA' = [CaBAPTA]
([Ca2+]T–[CaBAPTA]–[CaATP])([BAPTA]T–[CaBAPTA]–[MgBAPTA])
KMgBAPTA' = [MgBAPTA]
([Mg2+]T–[MgBAPTA]–[MgATP])([BAPTA]T–[CaBAPTA]–[MgBAPTA])
KCaATP' = [CaATP]
([Ca2+]T–[CaBAPTA]–[CaATP])([ATP]T–[CaATP]–[MgATP])
KMgATP' = [MgATP]
([Mg2+]T–[MgBAPTA]–[MgATP])([ATP]T–[CaATP]–[MgATP])
[Ca2+]T, [Mg2+]T, [BAPTA]T and [ATP]T are the total concentrations of each substance. [Ca2+]T is calculated from an equation [Ca2+]T= [Ca2+]add+ [Ca2+]ctm, where [Ca2+]add and [Ca2+]ctm are concentrations of added CaCl2 and of contaminated Ca2+ determined routinely by fura-2 assay,
respectively. K’CaBAPTA, K’MgBAPTA, K’CaATP and K’MgATP are the overall apparent association constants. Microsoft Excel Solver was used to solve the equations.
To set up the equations above, the overall apparent association constants, K’s (K’CaBAPTA, K’MgBAPTA, K’MgATP and K’CaATP) were converted from the absolute association constants, Ks, which were determined for standard conditions (see details in Appendixes and in Marks and Maxfield
79). Table 5-1 lists the published association constants for BAPTA and ATP, as well as the ΔH values for BAPTA and ATP. ΔH values were necessary for the conversions from the absolute association constants to the overall apparent association constants (see details in Appendixes).
2.8 Measurement of Ca2+ uptake
The concentrations of SV or LP2 fractions were adjusted to 0.2 mg/mL in sucrose buffer.
100 µL aliquots were preincubated for 10 min at 32°C. The reaction was started by addition of 10 µM (final concentration) 45Ca2+ dissolved in sucrose buffer containing ATP (2 mM), vanadate (500 µM), EosinY (10 µM), cyclopiazonic acid (15 µM) and levetiracetam (30 µM) when indicated. All incubations contained 0.125% (v/v) DMSO and 0.167% (v/v) ethanol in a final volume of 150 µL. After incubation for 10 min at 32°C, the reaction was stopped by addition of 3 mL of ice-cold buffer, followed by filtration through nitrocellulose filters. The incubation tubes were washed out with 3 mL of ice-cold buffer, and the wash out buffer was poured through the filter. The filters were washed out twice with 2.5 mL of ice-cold buffer. Radioactivities retained on filters were measured by liquid scintillation counting using an ALOKA LSC-6100 liquid scintillation counter (ALOKA, Japan).
2.9 Western blot analysis
SDS-PAGE was used to separate 20 µg of LP2 fractions from wild-type or SV2-DKO mice.
Proteins were transferred to a PVDF membrane. The resulting blots were probed with isoform specific antibodies for SV2s (Synaptic Systems, Germany) or with a pan-SV2 monoclonal antibody (a kind gift from Reinhard Jahn, Göttingen, Germany). For detection, the appropriate secondary antibodies conjugated to horseradish peroxidase were used. After washing steps, the horseradish peroxidase was detected by enhanced chemiluminescence using a commercially available kit (Perkin Elmer, Inc., MA). As loading controls, anti-synaptophysin monoclonal antibody (Cl7.2, Synaptic Systems, Germany) was used.
2.10 Molecular cloning of PMCA1-SEP, Syntaxin-1a-SEP and SypHy
To construct PMCA1-SEP, a full length mouse PMCA1 (accession no. NM_001359506.1) was amplified by PCR from mouse adult brain cDNA generated using SuperScript RT-PCR system (Invitrogen) and subcloned into a StuI site of pCR-Blunt vector (Thermo Fisher Scientific).
A DNA fragment encoding the N-terminal region of PMCA1 (a.a. 1-139) with linker sequence (STSGGSGGTGGS) and a fragment of super-ecliptic pHluorin (SEP) amplified from SypHy plasmid17,80 (a kind gift from Leon Lagnado) were amplified by PCR and cloned into an EcoRV site of pcDNA3.1(+) using In-Fusion Cloning Kit (Clontech). A DNA fragment encoding the C- terminal region of PMCA1 (a.a. 140-1,220) was PCR-amplified and cloned into a NotI site of pcDNA3.1(+) which contained the N-terminal region of PMCA1 and SEP using In-Fusion Cloning Kit. To construct Syntaxin1a-SEP, a full length mouse Syntaxin-1a (accession no.
NM_016801.3) without the stop codon and a fragment of SEP were amplified by PCR and simultaneously cloned into a NheI/EcoRV site of pcDNA3.1(+). A DNA fragment encoding SypHy 17 was amplified by PCR and subcloned into a NheI/XbaI site of pcDNA3.1(+).
2.11 Neuronal cultures
Primary hippocampal cultures were prepared from embryonic day 16 ICR mice as described previously 81 with slight modifications. Briefly, hippocampi were dissected and were incubated with papain (90 units/mL, Worthington) for 20 min at 37˚C. After digestion, hippocampal cells were plated onto poly-D-lysine-coated coverslips in 24- or 12-well plates (Falcon) at a density of 20,000 cells/cm2 and kept in a 5% CO2 humidified incubator. At 2-4 days in vitro (DIV), 40 μM FUDR (Sigma) and 100 μM uridine (Sigma) were added to inhibit the growth of glial cells. One- fifth of the culture medium was replaced with fresh medium every 2-4 days. Cultures were transfected with plasmids encoding either PMCA1-SEP, SypHy, or Syntaxin-1a-SEP at 5-7 DIV using CalPhosTM mammalian transfection kit (Clontech) in accordance with a calcium phosphate transfection method which is optimized for neuronal cultures 82, and were subjected to experiments at 12-14 DIV. Animals for the primary neuron cultures were treated according to our institutional guidelines for the care and use of animals (Doshisha University).
2.12 Immunostaining
At DIV12, neural cells were fixed with 4% (wt/vol) paraformaldehyde in phosphate buffer (Wako) for 10 min at room temperature (RT). After washing with phosphate buffered saline (PBS), the neurons were permeabilized with PBS containing 0.1% Triton X-100 for 20 min at RT, and
incubated with PBS containing 10% (vol/vol) fetal bovine serum (FBS) and 0.1% Triton X-100 for 30 min at RT. The cells were incubated with rabbit polyclonal anti-GFP antiserum (1:1,000) and mouse monoclonal anti-Synaptophysin antibody (1:1,000; C17.2) (both were kind gifts from Reinhard Jahn) for 1 hour at RT. The cells were rinsed three times with PBS, and further incubated with Alexa-488-conjugated anti-rabbit IgG (1:1,500; Invitrogen) and Alexa-555-conjugated anti- mouse IgG (1:1,500; Invitrogen) for 30 min at RT. After washing steps, Alexa-488 or Alexa-555 fluorescence was acquired with 470/22 nm excitation and 514/30 nm emission filters or 556-to 570-nm excitation and 600- to 650-nm emission filters, respectively.
2.13 Live imaging of SEP
To examine the localization and the recycling behavior of PMCAs in living neurons, I took an advantage of a pH-sensitive green fluorescent protein variant, super-ecliptic pHluorin (SEP) with an apparent pKa of ~ 7.1. When the SEP molecule is fused to a luminal region of synaptic vesicle protein, such as synaptobrevin 2 (VAMP2), it is quenched (dim) due to the acidic vesicular pH (Figure 2-3a). When SVs fuse with the plasma membrane, the SEP molecule is exposed to an extracellular solution at pH 7.4, thereby increasing its fluorescence. In this way, the SEP imaging allows us to monitor the recycling behavior of proteins of interest tagged with SEP. In addition, by measuring SEP fluorescence intensities upon sequential application of an acidic solution and a NH4Cl solution, vesicular pH in which the SEP probe is located as well as the surface fraction of the SEP probe can be estimated (Figure 2-3b).
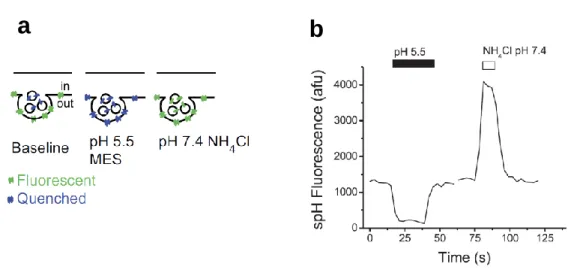
Figure 2-3 The synapto-pHluorin (spH) assay.
The spH is a fusion protein in which a variant of pH-sensitive green fluorescent protein (ecliptic pHluorin: SEP) is fused to the luminal domain of synaptobrevin2 (VAMP2). Exposure to pH 5.5 quenches the spH fluorescence on the axon surface, and application of NH4Cl raises the intra-vesicular pH to ~7.4, thereby dequenching vesicular the spH fluorescence, as shown graphically in (a). (b) A representative trace of the spH fluorescence at presynaptic terminal upon exposure to buffer containing 25 mM MES at pH 5.5 and 50 mM NH4Cl at pH 7.4. Modified from Mani and Ryan, 2009 83.
Cells cultured on a glass coverslip were placed in a custom-made imaging chamber on a movable stage and continuously perfused with standard extracellular solution containing (in mM):
140 NaCl, 2.4 KCl, 10 HEPES, 10 glucose, 2 CaCl2, 1 MgCl2, 0.02 CNQX, and 0.025 D-APV (pH 7.4). A solution containing 50 mM NH4Cl (pH 7.4) was applied directly onto the area of interest with a combination of a fast flow exchange microperfusion device and a bulb controller, both of which were controlled by Clampex 10.2. To estimate luminal pH and surface fraction of the SEP probes, a MES-buffered solution at pH 5.5 and 50 mM NH4Cl (pH 7.4) were successively