九州大学学術情報リポジトリ
Kyushu University Institutional Repository
悪性リンパ腫の骨髄浸潤の診断に有用な検査項目の 検討
西村, 和徳
https://doi.org/10.15017/1931768
出版情報:Kyushu University, 2017, 博士(保健学), 課程博士 バージョン:
権利関係:
博 士 学 位 論 文
Useful laboratory markers for the diagnosis of bone marrow involvement by malignant lymphoma
九州大学大学院 医学系学府 保健学専攻 博士後期課程
西村 和徳
CONTENTS
ABSTRACT ・・・ 3
INTRODUCTION ・・・ 4
PATIENTS and METHODS ・・・ 5
RESULTS ・・・ 7
DISCUSSION ・・・ 8
CONFLICT OF INTEREST ・・・ 11
REFERENCES ・・・ 11
TABLES and FIGURES ・・・ 16
ABSTRACT
Introduction: This study aimed to investigate the effect of bone marrow involvement by malignant lymphoma (BMI) on laboratory data and to determine the useful laboratory markers for diagnosing BMI.
Methods: We compared laboratory data between patients with and without BMI. We performed multivariate logistic regression and receiver operating characteristic (ROC) analyses to evaluate the diagnostic values of independent predictors.
Results: In the BMI group, platelets in peripheral blood (PLT) and megakaryocyte count in bone marrow (MgK) were significantly lower than those in the non-BMI group (PLT, p < 0.0001; MgK, p = 0.0384). The rate of peripheral blood involvement by malignant lymphoma (PBI), red blood cell distribution width (RDW), D-dimer (DD), soluble interleukin-2 receptor (sIL2R), aspartate aminotransferase (AST), and lactate dehydrogenase (LDH) were significantly higher in the BMI group than in the non-BMI group (PBI, p < 0.0001; RDW, p = 0.0190; DD, p = 0.0006; sIL2R, p < 0.0001; AST, p = 0.0256; LDH, p = 0.0002).
In multivariate analysis, PBI, PLT, sIL2R and MgK levels were independent predictors of BMI.
Conclusion: PBI, PLT, sIL2R and MgK may be useful laboratory markers for BMI diagnosis.
Keywords: bone marrow involvement, diagnostic value, laboratory marker, lymphoma, receiver operating characteristic
INTRODUCTION
Malignant lymphoma is a group of blood cell tumors that originate in the lymph tissues.
Lymphoma cells often spread through the lymphatic system to the whole body, such as the bone marrow, lung, and liver.1,2 Some studies have reported that patients with bone marrow involvement by malignant lymphoma (BMI) have a poor prognosis.3,4 In clinical practice, the diagnosis of BMI is performed by bone marrow examinations consisting of aspiration, biopsy, and flow cytometry. However, the morphological method is often difficult for identifying lymphoma cells because various differentiated cells, such as lymphoid, erythroid, and myeloid cells, are shown in bone marrow smears, and the immunohistological method is time-consuming and expensive. Therefore, it is important to predict the presence of BMI by using laboratory data at the first diagnosis.
Some laboratory markers are known to be useful for the diagnosis of malignant lymphoma. For example, soluble interleukin-2 receptor (sIL2R) has been recognized as a tumor marker of malignant lymphoma. Recent studies have revealed that the sIL2R level is a prognostic predictor in lymphoma.5-7 The lactate dehydrogenase (LDH) level is also commonly elevated in lymphoma, and is one of the prognostic factors in the International Prognostic Index.8 In contrast, hemoglobin (Hb) and platelet (PLT) levels are often below normal in patients with lymphoma.9 There are some studies on useful laboratory markers for the diagnosis and prognostic prediction of malignant lymphoma. However, useful laboratory markers for the diagnosis of BMI remain unknown. Investigating the effect of BMI on laboratory data may be helpful for the diagnosis of BMI in clinical practice. The aim of this study was to investigate the effect of BMI on laboratory data and to determine useful laboratory markers for BMI diagnosis.
PATIENTS and METHODS
Patients
We analyzed data from 196 lymphoma patients with BMI (the BMI group) or without BMI (the non-BMI group) between 2010 and 2016 at the Hamanomachi Hospital in Fukuoka, Japan. These patients exhibited various histological types (Table 1). Our study was approved by the Institutional Review Board of Hamanomachi Hospital. This retrospective study was limited to the use of laboratory data. Therefore, the Institutional Review Board exempted the need for obtaining an informed consent from the patients.
Evaluation of BMI by bone marrow examination
All patients underwent bone marrow examinations for lymphoma staging. Bone marrow aspiration and biopsy were obtained from the posterior iliac crest. The final diagnosis of BMI was determined based on immunohistochemical stains, flow cytometry, and morphological examinations in all patients. In patients with peripheral blood involvement by malignant lymphoma (PBI), BMI diagnosis should be regarded as contamination of the tumor cells from peripheral blood to bone marrow aspirate. Therefore, in patients with PBI, BMI diagnosis was determined by immunohistochemical staining of tissues obtained using bone marrow biopsy and not bone marrow aspirate. The quantification of nuclear cells and megakaryocytes was conducted by the direct counting method using a Fuchs-Rosenthal and a Burker-Turk counting chamber. The classification of bone marrow cells were performed using May-Grunwald-Giemsa-stained slides.
Collection of data
We analyzed laboratory data at the first diagnosis, which included complete blood count, peripheral blood smear examination, coagulation test, biochemical test, and bone marrow examination.
Complete blood count consisted of white blood cells (WBCs), hemoglobin (Hb), red blood cell
distribution width (RDW), platelets (PLT), platelet distribution width (PDW), and percentage of lymphocytes (Ly). Peripheral blood smear examination was used for the diagnosis of PBI. We investigated the presence or absence of morphologically abnormal lymphocyte in peripheral blood using May-Grunwald-Giemsa-stained slides. The blood coagulation test consisted of D-dimer (DD). The biochemical test consisted of soluble interleukin-2 receptor (sIL2R), C-reactive protein (CRP), aspartate aminotransferase (AST), alanine aminotransferase (ALT), lactate dehydrogenase (LDH), creatinine (CRE), and blood urea nitrogen (BUN). The bone marrow examination consisted of nuclear cell count (NCC), myeloid/erythroid ratio (M/E ratio), megakaryocyte count (MgK), percentage of lymphocytes (BM-Ly), and percentage of monocytes and reticulum in bone marrow (mono + reticulum). These blood markers were measured by a Sysmex XE5000 hematology analyzer (Sysmex, Japan), a Sysmex CS5100 automated blood coagulation analyzer (Sysmex, Japan), and a Hitachi Labospect 008 automated chemistry analyzer (Hitachi, Japan). sIL2R was measured using chemiluminescent enzyme immunoassay.
Statistical analysis
Statistical analyses were carried out using JMP pro 12 (SAS Institute, Cary, NC, USA). The Mann-Whitney U test, the chi-squared test, and the Fisher’s exact test were flexibly used as appropriate.
A P value of <0.05 was considered to indicate statistical significance. P values were adjusted using Steel-Dwass test. To investigate the effect of BMI on laboratory data, we compared laboratory data between the two groups. In addition, we performed logistic analysis after binarizing the quantitative data using appropriate cutoff values. To determine the appropriate cutoff values of each significant marker, we performed the ROC curve analysis and determined the cutoff values to be the points that maximize the sum of sensitivity and specificity. To determine the cutoff values of each non-significant marker, we used the medians of sample data. First, we performed a univariate logistic regression analysis. In addition, we included the markers with statistical significance (p < 0.05) in univariate analysis into the multivariate logistic analysis. At this time, DD was not included into the multivariate
analysis because the marker contained missing values in approximately half of the patients. The diagnostic values of independent predictors were analyzed by ROC analysis.
RESULTS
Characteristics of patients
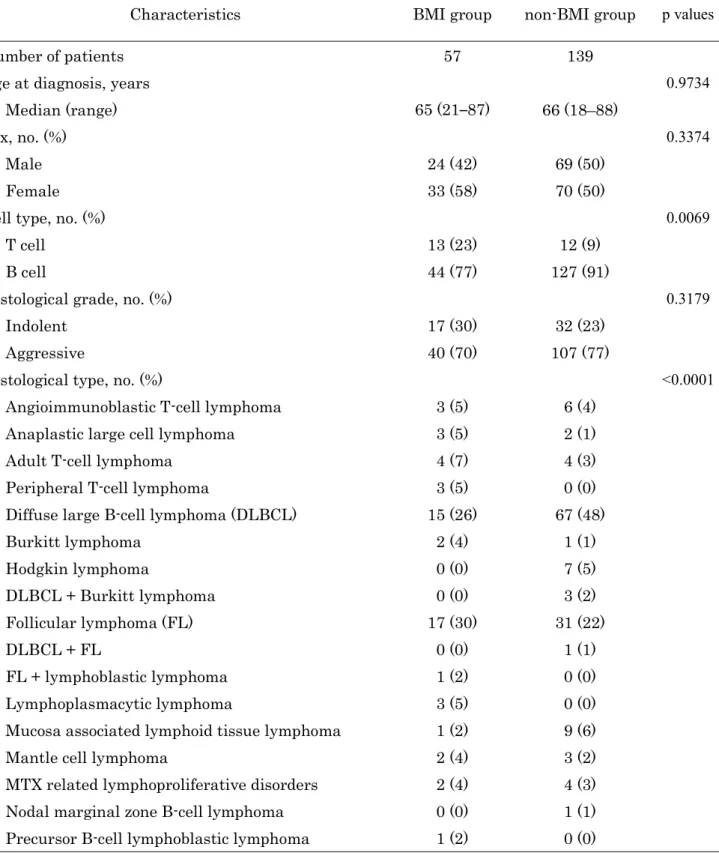
We analyzed data of 57 patients in the BMI group and 139 patients in the non-BMI group (Table 1).
Age, male ratio and histological grade were balanced between the two groups, and there were no significant differences between the two groups (age, p = 0.9734; male ratio, p = 0.3374; histological grade, p = 0.3179). In contrast, cell type and histological type were different between the two groups (cell type, p = 0.0069; histological type, p < 0.0001).
Comparison of laboratory data between the two groups
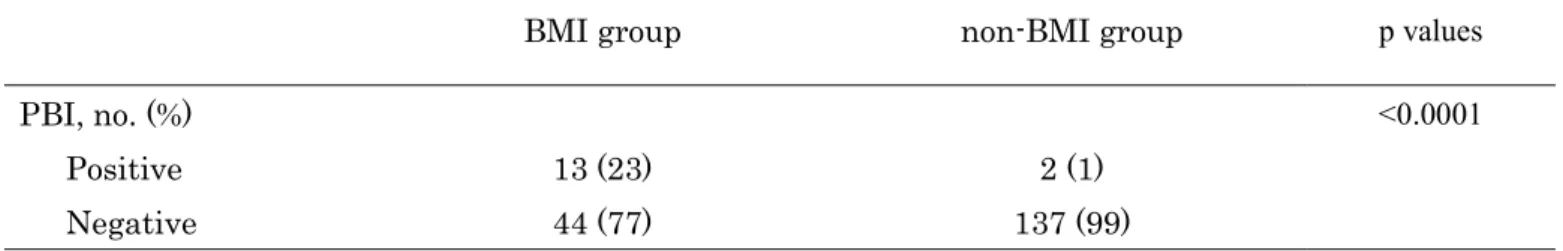
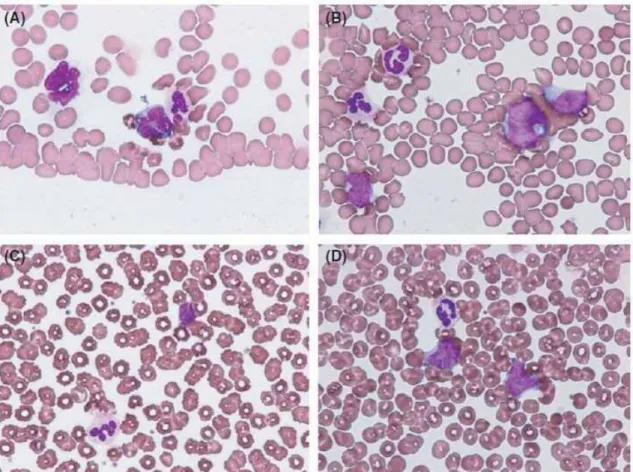
In the BMI group, the rate of PBI was significantly higher than that in the non-BMI group (Table 2). In the peripheral blood smears, abnormal lymphocytes showed a wide variety of morphologic appearance (Figure 1).
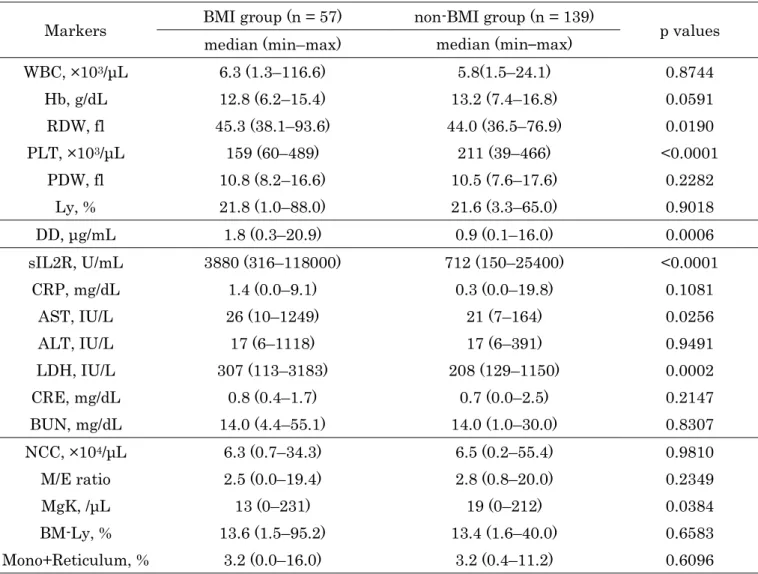
In the BMI group, PLT and MgK were significantly lower than those in the non-BMI group (PLT, p
< 0.0001; MgK, p = 0.0384; Table 3). RDW, DD, sIL2R, AST, and LDH were significantly higher in the BMI group than in the non-BMI group (RDW, p = 0.0190; DD, p = 0.0006; sIL2R, p < 0.0001; AST, p = 0.0256; LDH, p = 0.0002). Other markers were not different between the two groups (WBC, p = 0.8744;
Hb, p = 0.0591; PDW, p = 0.2282; Ly, p = 0.9018; CRP, p = 0.1081; ALT, p = 0.9491; CRE, p = 0.2147; BUN, p = 0.8307; NCC, p = 0.9810; M/E ratio, p = 0.2349; BM-Ly, p = 0.6583; mono + reticulum, p = 0.6096).
Univariate and multivariate analyses of BMI predictors
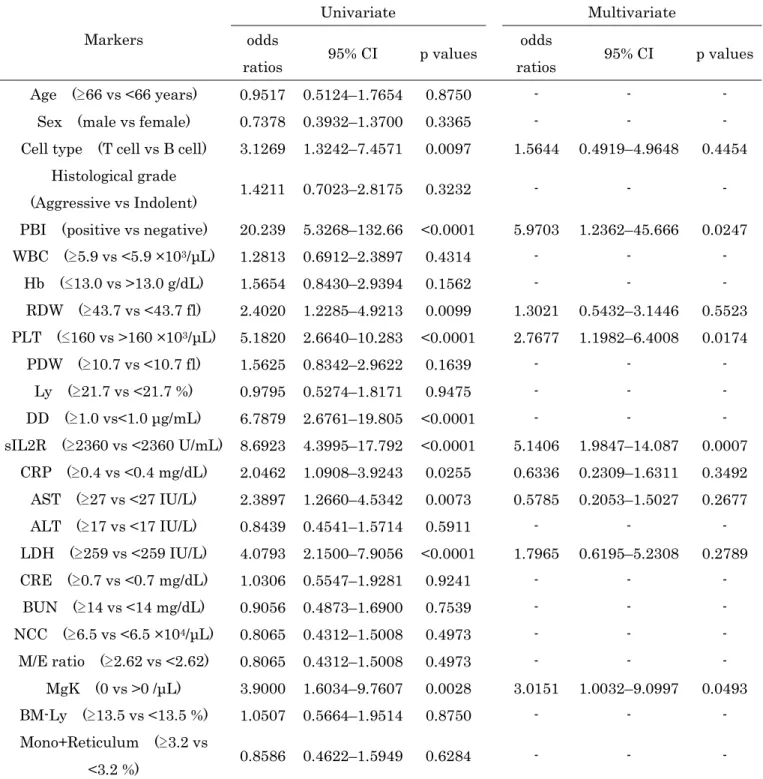
In the univariate analysis, T-cell type, PBI, RDW, PLT, DD, sIL2R, CRP, AST, LDH, MgK were
significantly associated with BMI (T-cell type, p = 0.0097; PBI, p < 0.0001; RDW, p = 0.0099; PLT, p <
0.0001; DD, p < 0.0001; sIL2R, p < 0.0001; CRP, p = 0.0255; AST, p = 0.0073; LDH, p < 0.0001; MgK, p = 0.0028; Table 4). The multivariate analysis also demonstrated that PBI, PLT, sIL2R, and MgK were independent predictors of BMI (PBI, odds ratio = 5.9703, p = 0.0247; PLT, odds ratio = 2.7677, p = 0.0174; sIL2R, odds ratio = 5.1406, p = 0. 0007; MgK, odds ratio = 3.0151, p = 0.0493).
Diagnostic values of independent predictors of BMI
The diagnostic cutoff values for total cases were 160 × 103/μL for PLT, 2360 U/mL for sIL2R, and 0 /μL for MgK (Table 5). AUCs were 0.7100 (95% CI, 0.6218–0.7848) for PLT, 0.7941 (95% CI, 0.7146–0.8559) for sIL2R, 0.5940 (95% CI, 0.5000–0.6817) for MgK, 0.6068 (0.5498–0.6611) for PBI, and 0.8058 (95% CI, 0.7281–0.8653) for the combination. In each cell type of lymphoma, the AUCs of the combination were 0.8189 for B-cell lymphoma, 0.7436 for T-cell lymphoma. In FL, a combination of these markers exhibited the highest sensitivity (88.2%) and AUC (0.8596).
DISCUSSION
In this study, we investigated the effect of BMI on laboratory data and determined the useful laboratory markers for BMI diagnosis.
First, we compared the BMI and non-BMI groups to investigate the effect of BMI on laboratory data. Some studies indicated that PBI is a poor prognostic factor in lymphoma;10,11 however, the correlation between PBI and BMI remains unknown. In this study, the rate of PBI in BMI group was significantly higher than that in the non-BMI group. This suggests that PBI may have a direct relation with BMI. However, we used the morphological method for PBI diagnosis. Therefore, we need to investigate PBI by flow cytometric immunophenotyping method. The PLT level in the BMI group was significantly lower than that in the non-BMI group. Some studies reported that PLT levels decrease by
bone marrow invasion of various malignant tumors such as lung, gastric, and breast cancers.12,13 We suspect that lymphoma cells invading bone marrow injure hematopoietic cells in bone marrow and affect the PLT level. Interestingly, MgK levels in the BMI group were significantly lower than those in the non-BMI group, which might have caused low PLT levels in the peripheral blood. In this study, the median level of megakaryocytes in the non-BMI group was less than normal because this study included patients with dry tap and bloody tap on aspiration. NCC and MgK levels may be affected by the sensitivity and specificity of bone marrow aspiration. To accurately measure NCC and MgK, we should estimate these cells using histocytological preparations. In contrast, RDW and DD levels in the BMI group were significantly higher than those in the non-BMI group. Some studies have suggested that RDW is a potentially useful marker for the diagnosis of various diseases.14,15 On the other hand, Diao et al.16 found that the DD level is not just an indicator of venous thrombosis but also a predictor of asymptomatic hematogenous metastasis in cancer patients. Geenen, Delaere, and Van Wersch17 also reported that high DD levels are found in patients with bone marrow metastases of carcinoma. Recent studies have indicated that high levels of RDW and DD are predictors of poor overall survival in patients with various cancers,18,19 and that they are also found in patients with advanced clinical stages of cancer.20,21
With regard to the biochemical findings, sIL2R, AST, and LDH levels were significantly higher in the BMI group than in the non-BMI group. sIL2R has been recognized as a tumor marker of lymphoma and indicates the extent of the disease. Recent studies have revealed that the sIL2R level is correlated with the clinical stage.22,23 In addition, some studies have reported that the sIL2R level is a prognostic predictor in lymphoma.5,7 The LDH level is also commonly elevated in lymphoma and reflects the number of tumor cells. Tomita et al.24 indicated that the LDH level is a useful prognostic predictor in lymphoma, and that its level is used as one of the prognostic factors in the International Prognostic Index.8 On the other hand, AST levels are increased by liver damage and hemolysis. Lymphoma cells often spread to the liver and injure hepatic cells,1,2 which might induce a high AST level in the peripheral blood. Based on these investigations, high levels of sIL2R, LDH, and AST in the BMI group
may reflect the spread of the disease and the increased number of lymphoma cells.
Next, we performed multivariate logistic regression and ROC analyses to determine the useful laboratory markers for BMI diagnosis. In the multivariate analysis, PBI, PLT, sIL2R and MgK were independent predictors of BMI. Among these markers, AUCs were high for sIL2R, PLT, PBI and MgK (0.7941, 0.7100, 0.6068 and 0.5940, respectively). These results indicated that the sIL2R level is the most useful predictor of BMI. In addition, it is a new finding that low PLT levels are useful for BMI diagnosis. Furthermore, PBI exhibited high specificity (98.6%), which indicates that bone marrow examination may not be necessary for patients with PBI. On the other hand, the cell types of lymphoma may affect laboratory markers. For example, it is known that the sIL2R level is higher in T-cell lymphoma than in B-cell lymphoma.25 Therefore, we divided the analyzed cases into some groups based on cell types in AUC evaluation. In each cell type of lymphoma, the AUCs of combination were 0.8189 for B-cell lymphoma and 0.7436 for T-cell lymphoma. In particular, the combination of these markers exhibited the highest sensitivity (88.2%) and AUC (0.8596) in FL. Following these results, we should investigate the effect of BMI on laboratory markers according to subtypes, such as HL and ALCL, in further studies.
In routine practice for BMI, bone marrow examination is still a popular method. Current studies have reported on the utility of PET/CT for BMI. PET/CT is noninvasive and rapid. Several studies have reported that PET/CT is highly accurate for detecting BMI in DLBCL and HL.26-28 In addition, El Karak et al.29 reported that BMI diagnosis by PET, but not bone marrow biopsies, has a prognostic value with strong correlation with progression-free survival and overall survival. These studies support the omission of bone marrow biopsies for DLBCL and HL. However, its disadvantage is that the sensitivity of BMI diagnosis in FL by PET is low, ranging between 20.3% and 28.9%.30 Perry et al.31 also reported that diffuse marrow uptake is nonspecific with a relatively high false-positive rate by PET/CT, although focal increase in uptake indicates BMI in patients with FL. Thus, there are still some problems in the diagnosis of BMI by PET/CT alone. On the other hand, our study indicated that a combination of the selected markers exhibited relatively high sensitivity and AUC for detecting BMI in FL (88.2% and
0.8596, respectively). This result suggested that the selected markers are more useful than PET/CT for BMI diagnosis in FL. Laboratory data would be affected by histological types, such as DLBCL, HL, and FL. In addition, laboratory data would differ between the patients with diffuse BMI and focal BMI, but the analyzed patients did not undergo PET/CT examination for BMI diagnosis. To clarify these questions, we should investigate the association between laboratory data and PET/CT using patients with diffuse and focal BMI.
This is the first report on the effect of BMI on laboratory data and the useful laboratory markers for BMI diagnosis. Collectively, PBI, PLT, sIL2R and MgK are suggested to be useful diagnostic markers for BMI. These findings may be helpful for the diagnosis of BMI in clinical practice.
CONFLICT OF INTEREST
The authors have no competing interests.
REFERENCES
1. Li ZM, Zhu YJ, Xia Y, Huang JJ, Jiang WQ. Clinical characteristics of the patients with Hodgkin's lymphoma involving extranodal sites. Chin J Cancer. 2012;31:342-347.
2. Takahashi H, Tomita N, Yokoyama M, Tsunoda S, Yano T, Murayama K, Hashimoto C, Tamura K, Sato K, Ishigatsubo Y. Prognostic impact of extranodal involvement in diffuse large B-cell lymphoma in the rituximab era. Cancer. 2012;118:4166-4172.
3. Kao HW, Lin TL, Shih LY, Dunn P, Kuo MC, Hung YS, Wu JH, Tang TC, Chang H1, Kuo TT, Ou CW, Wang PN. Clinical features, outcome and prognostic factors of 87 patients with angioimmunoblastic T-cell lymphoma in Taiwan. Int J Hematol 2016;104:256-265.
4. Tong H, Ren Y, Qian W, Xiao F, Mai W, Meng H, Jin J Clinicopathological study on peripheral T-cell non-Hodgkin lymphoma with bone marrow involvement: a retrospective analysis from China. Int J Hematol. 2009;90: 303-310.
5. Ennishi D, Yokoyama M, Terui Y, Asai H, Sakajiri S, Mishima Y, Takahashi S, Komatsu H, Ikeda K, Takeuchi K, Tanimoto M, Hatake K. Soluble interleukin-2 receptor retains prognostic value in patients with diffuse large B-cell lymphoma receiving rituximab plus CHOP RCHOP therapy. Ann Oncol.
2009;20:526-533.
6. Wang L, Liao DZ, Zhang J, Xia ZJ, Peng XW, Lu Y. Clinical significance of serum soluble interleukin-2 receptor-a in extranodal natural killer/T-cell lymphoma (ENKTL): a predictive biomarker for treatment efficacy and valuable prognostic factor. Med Oncol. 2013;30:723.
7. Yoshida N, Oda M, Kuroda Y, Katayama Y, Okikawa Y, Masunari T, Fujiwara M, Nishisaka T, Sasaki N, Sadahira Y, Mihara K, Asaoku H, Matsui H, Seto M, Kimura A, Arihiro K, Sakai A. Clinical significance of sIL-2R levels in B-cell lymphomas. PLoS ONE. 2013;8:e78730.
8. Armitage JO. Staging non-Hodgkin lymphoma. CA Cancer J Clin. 2005;55:368-376.
9. Montalbán C, Abraira V, Arcaini L, Domingo-Domenech E, Guisado-Vasco P, Iannitto E, Mollejo M, Matutes E, Ferreri A, Salar A, Rattotti S, Carpaneto A, Pérez Fernández R, Bello JL, Hernández M, Caballero D, Carbonell F, Piris MA, Splenic Marginal Zone Lymphoma Study Group. Risk stratification for Splenic Marginal Zone Lymphoma based on haemoglobin concentration, platelet count, high lactate dehydrogenase level and extrahilar lymphadenopathy: development and validation on 593 cases. Br J Haematol. 2012;159:164-171.
10. Hiorns LR, Nicholls J, Sloane JP, Horwich A, Ashley S, Brada M. Peripheral blood involvement in non-Hodgkin's lymphoma detected by clonal gene rearrangement as a biological prognostic marker. Br J Cancer. 1994;69:347.
11. Sarkozy C, Baseggio L, Feugier P, Callet-Bauchu E, Karlin L, Seymour JF, Lebras L, Michallet AS, Offner F, Dumas O, Traverse-Glehen A. Peripheral blood involvement in patients with follicular lymphoma: a rare disease manifestation associated with poor prognosis. Br J Haematol.
2014;164:659-667.
12. Ozkan M, Eser B, Er O, Coskun S, Ozturk A, Sari I, Canoz O, Altinbas M. Bone marrow involvement in small cell lung cancer: Prognostic significance and correlation with hematological and biochemical parameters. Asia Pac J Clin Oncol. 2006;2:32-48.
13. Xiao L, Luxi S, Ying T, Yizhi L, Lingyun W, Quan P. Diagnosis of unknown nonhematological tumors by bone marrow biopsy: a retrospective analysis of 10,112 samples. J Cancer Res Clin Oncol.
2009;135:687-693.
14. Koma Y, Onishi A, Matsuoka H, Oda N, Yokota N, Matsumoto Y, Koyama M, Okada N, Nakashima N, Masuya D, Yoshimatsu H, Suzuki Y. Increased red blood cell distribution width associates with cancer stage and prognosis in patients with lung cancer. PLoS ONE. 2013;8:e80240.
15. Lee HB, Kim J, Oh SH, Kim SH, Kim HS, Kim WC, Kim S, Kim OJ. Red blood cell distribution width is associated with severity of leukoaraiosis. PLoS ONE. 2016;11:e0150308.
16. Diao D, Wang Z, Cheng Y, Zhang H, Guo Q, Song Y, Zhn K, Li K, Liu D, Dang C. D-Dimer: Not just an indicator of venous thrombosis but a predictor of asymptomatic hematogenous metastasis in gastric cancer patients. PLoS ONE. 2014;9:e101125.
17. Geenen RW, Delaere KP, van Wersch JW. Coagulation and fibrinolysis activation markers in prostatic carcinoma patients. Eur J Clin Chem Clin Biochem. 1997;35:69-72.
18. Patel KV, Semba RD, Ferrucci L, Newman AB, Fried LP, Wallace RB, Bandinelli S, Philips CS, Yu B, Connelly S, Shlipak MG, Chaves PH, Launer LJ, Ershler WB, Harris TB, Longo DL, Guralnik JM. Red cell distribution width and mortality in older adults: a meta-analysis. J Gerontol A Biol Sci Med Sci.
2010;65:258-265.
19. Ay C, Dunkler D, Pirker R, Thaler J, Quehenberger P, Wagner O, Zielinski C, Pabinger I. High D-dimer livels are associated with poor prognosis in cancer patients. Haematologica. 2012;97:1158-1164.
20. Periša V, Zibar L, Sinčić-Petričević J, Knezović A, Periša I, Barbić J. Red blood cell distribution width as a simple negative prognostic factor in patients with diffuse large B-cell lymphoma: a retrospective study. Croat Med J. 2015;56:334-343.
21. Wrobel T, Poreba M, Mazur G, Poreba R, Pyszel A, Beck B, Steinmetz-Beck A, Andrzejak R, Kuliczkowski K. Angiogenic and coagulation-fibrinolysis factors in non Hodgkin’s lymphoma.
Neoplasma. 2006;53:253-258.
22. Goto N, Tsurumi H, Goto H, Ino-Shimomura Y, Kasahara S, Hara T, Yasuda I, Shimizu M, Murakami N, Yoshikawa T, Fukuno K, Takahashi T, Kito Y, Takami T, Moriwaki H. Serum soluble interleukin-2 receptor (sIL-2R) level is associated with the outcome of patients with diffuse large B cell lymphoma treated with R-CHOP regimens. Ann Hematol. 2012;91:705-714.
23. Jo SA, Hwang SH, Chang CL, Kim SY, Shin HJ, Chung JS, Sol MY, Lee EY. Clinical relevance of elevated levels of serum soluble interleukin-2 receptor alpha (sIL-2Rα) in patients with non-Hodgkin's lymphoma. Korean J Lab Med. 2010;30:600-605.
24. Tomita N, Sakai R, Fujisawa S, Fujimaki K, Taguchi J, Hashimoto C, Ogawa K, Yamazaki E, Ishigatsubo Y. SIL index, comprising stage, soluble interleukin-2 receptor, and lactate dehydrogenase, is a useful prognostic predictor in diffuse large B-cell lymphoma. Cancer Sci. 2012;103:1518-1523.
25. Goto H, Tsurumi H, Takemura M, Ino-Shimomura Y, Kasahara S, Sawada M, Yamada T, Hara T, Fukuno K, Goto N, Okuno M. Serum-soluble interleukin-2 receptor (sIL-2R) level determines clinical outcome in patients with aggressive non-Hodgkin’s lymphoma: in combination with the International Prognostic Index. J Cancer Res Clin Oncol. 2005;131:73-79.
26. Cheson BD, Fisher RI, Barrington SF, Cavalli F, Schwartz LH, Zucca E, Lister TA.
Recommendations for initial evaluation, staging, and response assessment of Hodgkin and non-Hodgkin lymphoma: the Lugano classification. J Clin Oncol. 2014;32:3059-3067.
27. Ujjani CS, Hill EM, Wang H, Nassif S, Esposito G, Ozdemirli M, Cordova C, Cheson BD. 18F-FDG PET-CT and trephine biopsy assessment of bone marrow involvement in lymphoma. Br J Haematol.
2016;174:410-416.
28. Khan AB, Barrington SF, Mikhaeel NG, Hunt AA, Cameron L, Morris T, Carr R. PET-CT staging of DLBCL accurately identifies and provides new insight into the clinical significance of bone marrow involvement. Blood. 2013;122:61-67.
29. El Karak F, Bou-Orm IR, Ghosn M, Kattan J, Farhat F, Ibrahim T, Jreige M, El Cheikh J, Haidar M.
PET/CT Scanner and Bone Marrow Biopsy in Detection of Bone Marrow Involvement in Diffuse Large B-Cell Lymphoma. PLoS ONE. 2017;12:e0170299.
30. Adams HJ, Nievelstein RA, Kwee TC. Opportunities and limitations of bone marrow biopsy and bone marrow FDG-PET in lymphoma. Blood Rev. 2015;29:417-425.
31. Perry C, Lerman H, Joffe E, Sarid N, Amit O, Avivi I, Kesler M, Ben-Ezra J, Even-Sapir E, Herishanu Y. The value of PET/CT in detecting bone marrow involvement in patients with follicular lymphoma. Medicine. 2016;95:e2910.
TABLES and FIGURES
Table 1 Clinical characteristics of patients in the BMI and non-BMI groups
Characteristics BMI group non-BMI group p values
Number of patients 57 139
Age at diagnosis, years 0.9734
Median (range) 65 (21–87) 66 (18–88)
Sex, no. (%) 0.3374
Male 24 (42) 69 (50)
Female 33 (58) 70 (50)
Cell type, no. (%) 0.0069
T cell 13 (23) 12 (9)
B cell 44 (77) 127 (91)
Histological grade, no. (%) 0.3179
Indolent 17 (30) 32 (23)
Aggressive 40 (70) 107 (77)
Histological type, no. (%) <0.0001
Angioimmunoblastic T-cell lymphoma 3 (5) 6 (4)
Anaplastic large cell lymphoma 3 (5) 2 (1)
Adult T-cell lymphoma 4 (7) 4 (3)
Peripheral T-cell lymphoma 3 (5) 0 (0)
Diffuse large B-cell lymphoma (DLBCL) 15 (26) 67 (48)
Burkitt lymphoma 2 (4) 1 (1)
Hodgkin lymphoma 0 (0) 7 (5)
DLBCL + Burkitt lymphoma 0 (0) 3 (2)
Follicular lymphoma (FL) 17 (30) 31 (22)
DLBCL + FL 0 (0) 1 (1)
FL + lymphoblastic lymphoma 1 (2) 0 (0)
Lymphoplasmacytic lymphoma 3 (5) 0 (0)
Mucosa associated lymphoid tissue lymphoma 1 (2) 9 (6)
Mantle cell lymphoma 2 (4) 3 (2)
MTX related lymphoproliferative disorders 2 (4) 4 (3) Nodal marginal zone B-cell lymphoma 0 (0) 1 (1) Precursor B-cell lymphoblastic lymphoma 1 (2) 0 (0)
Table 2 Comparison of the rate of PBI between the BMI and non-BMI groups
BMI group non-BMI group p values
PBI, no. (%) <0.0001
Positive 13 (23) 2 (1)
Negative 44 (77) 137 (99)
BMI, bone marrow involvement; PBI, peripheral blood involvement
Table 3 Comparison of the laboratory markers between the BMI and non-BMI groups
Markers BMI group (n = 57) non-BMI group (n = 139)
p values median (min–max) median (min–max)
WBC, ×103/μL 6.3 (1.3–116.6) 5.8(1.5–24.1) 0.8744
Hb, g/dL 12.8 (6.2–15.4) 13.2 (7.4–16.8) 0.0591
RDW, fl 45.3 (38.1–93.6) 44.0 (36.5–76.9) 0.0190
PLT, ×103/μL 159 (60–489) 211 (39–466) <0.0001
PDW, fl 10.8 (8.2–16.6) 10.5 (7.6–17.6) 0.2282
Ly, % 21.8 (1.0–88.0) 21.6 (3.3–65.0) 0.9018
DD, μg/mL 1.8 (0.3–20.9) 0.9 (0.1–16.0) 0.0006
sIL2R, U/mL 3880 (316–118000) 712 (150–25400) <0.0001
CRP, mg/dL 1.4 (0.0–9.1) 0.3 (0.0–19.8) 0.1081
AST, IU/L 26 (10–1249) 21 (7–164) 0.0256
ALT, IU/L 17 (6–1118) 17 (6–391) 0.9491
LDH, IU/L 307 (113–3183) 208 (129–1150) 0.0002
CRE, mg/dL 0.8 (0.4–1.7) 0.7 (0.0–2.5) 0.2147
BUN, mg/dL 14.0 (4.4–55.1) 14.0 (1.0–30.0) 0.8307
NCC, ×104/μL 6.3 (0.7–34.3) 6.5 (0.2–55.4) 0.9810
M/E ratio 2.5 (0.0–19.4) 2.8 (0.8–20.0) 0.2349
MgK, /μL 13 (0–231) 19 (0–212) 0.0384
BM-Ly, % 13.6 (1.5–95.2) 13.4 (1.6–40.0) 0.6583
Mono+Reticulum, % 3.2 (0.0–16.0) 3.2 (0.4–11.2) 0.6096
BMI, bone marrow involvement; WBC, white blood cell; Hb, hemoglobin; RDW, red blood cell
distribution width; PLT, platelet; PDW, platelet distribution width; Ly, the percentage of lymphocyte;
DD, D-dimer; sIL2R, soluble interleukin-2 receptor; CRP, C-reactive protein; AST, aspartate aminotransferase; ALT, alanine aminotransferase; LDH, lactate dehydrogenase; CRE, creatinine;
BUN, blood urea nitrogen; NCC, nuclear cell count; M/E ratio, Myeroid/Erythroid ratio; MgK, megakaryocyte count; BM-Ly, the percentage of lymphocyte in bone marrow; Mono+Reticulum, the percentage of Monocyte and Reticulum in bone marrow
Table 4 Univariate and multivariate analysis of predictors of BMI in patients with lymphoma
Markers
Univariate Multivariate
odds
ratios 95% CI p values odds
ratios 95% CI p values Age ( 66 vs <66 years) 0.9517 0.5124–1.7654 0.8750 - - -
Sex (male vs female) 0.7378 0.3932–1.3700 0.3365 - - -
Cell type (T cell vs B cell) 3.1269 1.3242–7.4571 0.0097 1.5644 0.4919–4.9648 0.4454 Histological grade
(Aggressive vs Indolent) 1.4211 0.7023–2.8175 0.3232 - - -
PBI (positive vs negative) 20.239 5.3268–132.66 <0.0001 5.9703 1.2362–45.666 0.0247 WBC ( 5.9 vs <5.9 ×10³/μL) 1.2813 0.6912–2.3897 0.4314 - - -
Hb ( 13.0 vs >13.0 g/dL) 1.5654 0.8430–2.9394 0.1562 - - - RDW ( 43.7 vs <43.7 fl) 2.4020 1.2285–4.9213 0.0099 1.3021 0.5432–3.1446 0.5523 PLT ( 160 vs >160 ×103/μL) 5.1820 2.6640–10.283 <0.0001 2.7677 1.1982–6.4008 0.0174
PDW ( 10.7 vs <10.7 fl) 1.5625 0.8342–2.9622 0.1639 - - - Ly ( 21.7 vs <21.7 %) 0.9795 0.5274–1.8171 0.9475 - - - DD ( 1.0 vs<1.0 μg/mL) 6.7879 2.6761–19.805 <0.0001 - - - sIL2R ( 2360 vs <2360 U/mL) 8.6923 4.3995–17.792 <0.0001 5.1406 1.9847–14.087 0.0007
CRP ( 0.4 vs <0.4 mg/dL) 2.0462 1.0908–3.9243 0.0255 0.6336 0.2309–1.6311 0.3492 AST ( 27 vs <27 IU/L) 2.3897 1.2660–4.5342 0.0073 0.5785 0.2053–1.5027 0.2677 ALT ( 17 vs <17 IU/L) 0.8439 0.4541–1.5714 0.5911 - - - LDH ( 259 vs <259 IU/L) 4.0793 2.1500–7.9056 <0.0001 1.7965 0.6195–5.2308 0.2789 CRE ( 0.7 vs <0.7 mg/dL) 1.0306 0.5547–1.9281 0.9241 - - -
BUN ( 14 vs <14 mg/dL) 0.9056 0.4873–1.6900 0.7539 - - - NCC ( 6.5 vs <6.5 ×10⁴/μL) 0.8065 0.4312–1.5008 0.4973 - - - M/E ratio ( 2.62 vs <2.62) 0.8065 0.4312–1.5008 0.4973 - - -
MgK (0 vs >0 /μL) 3.9000 1.6034–9.7607 0.0028 3.0151 1.0032–9.0997 0.0493 BM-Ly ( 13.5 vs <13.5 %) 1.0507 0.5664–1.9514 0.8750 - - - Mono+Reticulum ( 3.2 vs
<3.2 %) 0.8586 0.4622–1.5949 0.6284 - - -
BMI, bone marrow involvement; PBI, peripheral blood involvement; WBC, white blood cell; Hb, hemoglobin;
RDW, red blood cell distribution width; PLT, platelet; PDW, platelet distribution width; Ly, the percentage of lymphocyte; DD, D-dimer; sIL2R, soluble interleukin-2 receptor; CRP, C-reactive protein; AST, aspartate aminotransferase; ALT, alanine aminotransferase; LDH, lactate dehydrogenase; CRE, creatinine; BUN, blood urea nitrogen; NCC, nuclear cell count; M/E ratio, Myeroid/Erythroid ratio; MgK, megakaryocyte count; BM-Ly, the percentage of lymphocyte in bone marrow; Mono + Reticulum, the percentage of Monocyte and Reticulum in bone marrow
Table 5 Cutoff values, sensitivities, specificities, and AUCs for independent predictors
Markers Cut-off values Sensitivities (%) Specificities (%) AUCs (95% CI) Total, n = 196
PLT, ×103/μL 160 54.4 81.3 0.7100 (0.6218–0.7848)
sIL2R, U/mL 2360 66.7 81.3 0.7941 (0.7146–0.8559)
MgK, /μL 0 23.2 92.8 0.5940 (0.5000–0.6817)
PBI positive 22.8 98.6 0.6068 (0.5498–0.6611)
combination - 71.4 79.9 0.8058 (0.7281–0.8653)
B cell type, n = 171
PLT, ×103/μL 169 54.6 80.3 0.7102 (0.6106–0.7930)
sIL2R, U/mL 1140 84.1 63.8 0.7906 (0.7012–0.8587)
MgK, /μL 25 72.1 46.5 0.6222 (0.5211–0.7138)
PBI positive 20.5 99.2 0.5983 (0.5364–0.6573)
combination - 79.1 75.6 0.8189 (0.7310–0.8827)
DLBCL, n = 82
PLT, ×103/μL 241 100.0 35.8 0.6950 (0.5414–0.8148)
sIL2R, U/mL 1170 80.0 67.2 0.7702 (0.5987–0.8827)
MgK, /μL 13 66.7 55.2 0.6085 (0.4480–0.7485)
PBI positive 20.0 98.5 0.5925 (0.4841–0.6927)
combination - 60.0 88.1 0.7672 (0.5938–0.8813)
FL, n = 48
PLT, ×103/μL 169 52.9 83.9 0.6575 (0.4699–0.8061)
sIL2R, U/mL 1140 88.2 74.2 0.8482 (0.6868–0.9344)
MgK, /μL 6 52.9 77.4 0.5930 (0.4048–0.7573)
PBI positive 11.8 100.0 0.5588 (0.4791–0.6357)
combination - 88.2 74.2 0.8596 (0.6993–0.9416)
T cell type, n = 25
PLT, ×103/μL 159 61.5 75.0 0.6667 (0.4253–0.8439)
sIL2R, U/mL 6240 69.2 83.3 0.7372 (0.4778–0.8958)
MgK, /μL 31 46.2 75.0 0.5032 (0.2735–0.7316)
PBI positive 30.8 91.7 0.6122 (0.4521–0.7512)
combination - 53.9 91.7 0.7436 (0.5026–0.8927)
AUC, area under the ROC curve; PLT, platelet; sIL2R, soluble interleukin-2 receptor;
MgK, megakaryocyte count; PBI, peripheral blood involvement; DLBCL, Diffuse large B-cell
Figure 1 Abnormal lymphocytes in peripheral blood smears
(A) A case of adult T-cell lymphoma. Small- to medium-sized abnormal lymphocyte with markedly irregular nuclear coutour.
(B) A case of diffuse large B-cell lymphoma. Medium sized abnormal lymphocytes with slightly irregular nuclear coutour and mixed, dispersed, and delicate chromatin.
(C) A case of follicular lymphoma. Small-sized abnormal lymphocyte with markedly lobulated nuclei.
(D) A case of mantle cell lymphoma. Medium-sized abnormal lymphocytes with moderately-dispersed chromatin.