Automatic Generation Method to derive for the design variable spaces for interactive Genetic Algorithms
Misato Tanaka, Member, IEEE, Tomoyuki Hiroyasu, Member, IEEE, Mitsunori Miki, Member, IEEE, Yasunari Sasaki, Masato Yoshimi and Hisatake Yokouchi
Abstract— In the growing E-commerce market, many online shopping sites have adopted product recommendation systems to expand their business opportunities. We have focused on iGA (interactive Genetic Algorithm) as a solution to product recommendation algorithms. Although iGA is an optimization technique for user’s preference through the interaction between systems and users, iGA requires extraction of design variables to apply the product recommendation. Extracting design variables from existing products by hand is unrealistic because there are a wide variety of products on shopping sites that are updated rapidly. To address this problem, we have proposed an automatic generation method of a design variable space based on the collective preference data on the web. In this paper, we introduce several design variable spaces generated by books on Amazon, which maintain recommendation relations among products. The distributions of books generated by the proposed method are influenced by their authors. Then, subjective experiments confirmed that test subjects searched solutions by their unique preference.
I. I NTRODUCTION
The number of users of online shopping sites is increasing rapidly. The estimated US retail e-commerce sales for the third quarter of 2009 reached $34 billion, which is equivalent to 3.4% of the total retail sales in the country 1 . With the increase in e-commerce sales, there has been progress in various online shopping services, including web interfaces, search systems, and recommendation mechanisms to encour- age users to purchase goods online.
There are a number of main recommendation schemes:
Collaborative Filtering [1], [2], support vector machine (SVM) [3], and Content Filtering [4]. The two former ap- proaches present to users products purchased by other users who may have similar preferences without focusing on any specific features of products. The latter approach suggests products with features that fit the user profile.
On the other hand, the iGA (interactive Genetic Algo- rithm) [5], which is an interactive evolutionary computational method, is expected to be useful for recommending products according to users’ preferences through communication be- tween systems and users. Ideally, iGA in a recommendation system will obtains the users’ preference from their browsing history on the online shopping site, search for products
M. Tanaka, T. Hiroyasu and H. Yokouchi are with the Department of Life and Medical Sciences, Doshisha University, Kyotanabe, Kyoto 610-0321, JAPAN. (email: [email protected], [email protected], [email protected]).
M. Miki, Y. Sasaki and M. Yoshimi are with the Department of Science and Engineering, Doshisha University (email: [email protected].
ac.jp, [email protected], [email protected]).
1
Census Bureau, Nov, 18, 2009
matching these characteristics, and improve the personal showcase.
However, iGA needs to represent a product by various numerical values indicating characteristics such as color, shape, pattern, etc. For this, it is necessary to determine which features of the product iGA uses and to define each of features as numerical values by the experts or statistical procedures to reflect user sensibility.
Based on this background, we proposed a technique for constructing the design variable space of products automat- ically based on users’ preference data on the web. Users’
personal information and history logs are accumulated, and provided as collective knowledge on the web. We define the preference data as the collective preference. Previously, we discussed the neighborhood in the design variable space constructed by the proposed method [6]. We confirmed that the distances of individuals in the generated space are similar to those in the human sensibility space. In this paper, we added an investigation of the features of space and performed an experiment by iGA.
II. A PPLYING I GA TO PRODUCT RECOMMENDATION
A. Interactive Genetic Algorithms
The iGA is an algorithm derived from GAs [7]. The evaluation operation in GAs is replaced with the user’s subjective preference. The iGA searches for an optimal solution using the user’s subjective evaluation. Therefore, it can analyze a complex structure of human sensibility. This approach is often applied to problems that are difficult to evaluate quantitatively, such as CG art, hearing aid fitting and fashion design [8].
B. Design Variables in iGA
iGA needs to build a model of the optimization problems on the design variable space where a individual is represented by a list of numbers as a genotype. When evaluated by the user, they are converted to visible CG graphics, clothing designs, and audible melody as a phenotype.
As an example, this section focuses on T-shirt designs
(Figure 1). In this system, a T-shirt has various components,
such as color, pattern, shape, material, etc. One T-shirt
design (Phenotype) is determined by the combination of
these components (Genotype). The iGA can determine the
optimal combination of these modules using optimization
techniques. Each candidate of the module is converted to
a number, which is called the chromosome in iGA.
Shape of collar : 11
Color
R : 255 G : 189 B : 229
1 2 3
4 5 6 8 7 10 9 11 12 13 14
15
Red Blue Green
255 189 229 11
Color Shape of
collar
255 189 229 11 Chromosome
Design Variables
Gene
Fig. 1. Design variables in T-shirt iGA system
C. Applying iGA to a product recommendation system It has been confirmed that iGA can recommend products that suit a user’s preference [9], and we applied this approach to product recommendation on online shopping sites.
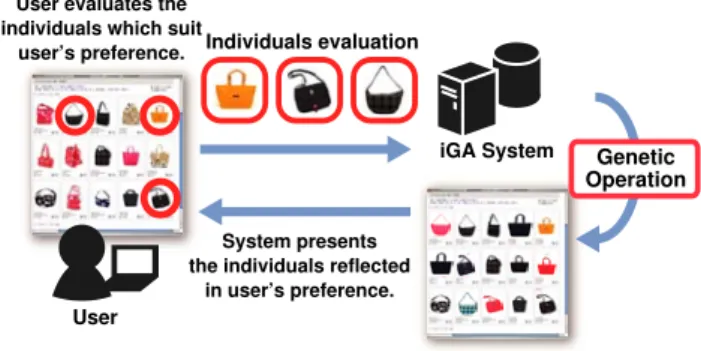
Figure 2 shows the flow of product recommendation by iGA. The user evaluates the products shown on the web interface. Based on the user’s evaluation, the iGA system performs the genetic operations (i.e., evaluation, selection, crossover, and mutation), and presents the user the evolved products. The presentation of products can be optimized by repeating these operations.
User
iGA System Individuals evaluation
User evaluates the individuals which suit
user’s preference.
System presents the individuals reflected
in user’s preference.
Genetic Operation
Fig. 2. Flow of product recommendation by iGA
D. Disadvantages of iGA in product recommendation In II-B, we treated only shape and color as the T-shirt design variables. The conventional iGA system simulates the visible design based on the design variables defined by the iGA system administrator on the machine.
However, when we build iGA into a product recommen- dation function, the system displays not simulation images but photos of actual products on shopping sites. Therefore, the iGA applied to product recommendation must extract the design variables from each product. In this case, the following problems are considered.
1) Definition of Design Variables
a) Determination of valid design variables
Appropriate parameters that represent the product are selected from various characteristics, such as color, shape, price, popularity, etc.
b) Definition of a neighborhood of design variables In addition to components that can be evaluated easily, such as color and size, there may also be those that are difficult to quantify and whose neighborhoods are difficult to determine. The neighborhood of the design variables in iGA must reflect human sensibility. For example, when peo- ple look at Pattern A and Pattern B and think that both are alike, the distance between both in the design variable space is close. On the other hand, the distance is greater when Pattern C and Pattern D are evaluated as different.
To define a new neighborhood for a design vari- able, we need specialists’ judgment or psycholog- ical scaling based on statistical procedures, such as questionnaires.
c) Dependency on the problem
The valid design variables and neighborhood are different between problems. For example, it is difficult to use the same combination of design variables to represent both a bag and a chair.
2) Cost to input the values on the design variables The vendors must measure the values of the actual products for each defined design variable and input them as genes. Although there is already technology to acquire the dominant color of products, it is difficult to analyze products that have patterns and decorations.
Therefore, extraction of the proper design variable is a human labor-intensive process.
Of the above problems, the second may be the most serious in cases where there are large numbers of products. To overcome these problems, a technique is needed to define the design variables automatically and compute the actual values of each product with as little human intervention as possible.
III. G ENERATION OF D ESIGN V ARIABLE S PACES USING RECOMMENDATION RELATION FOR I GA
A. Proposed method
In this research, to generate the design variables automat- ically for iGA, we used the relevance of the products based on collective preference accumulated on the web. In this paper, we treated the recommendation relations on Amazon as collective preferences, because we obtained the degrees of similarity among the products easily. The proposed method treats which products a product recommends as the charac- teristics of the product. This is a prototype of a gene and is converted to a real gene by applying Principal Component Analysis [10].
B. Algorithm
The algorithm for automatic generation of the design variable space for product recommendation is as follows:
Step 1 Obtain the recommendation relations of products
from sites on the web.
Step 2 Make the directed graph where products are treated as nodes, and recommendation relations are treated as edges. Then, show it as an adjacency matrix. In the case that Ind1 recommends Ind2, the value of Ind 1
2is 1. All value on main diagonal are 1.
Ind 1 Ind 2 Ind 3 . . . Ind N
Ind 1 1 1 0 . . . 0
Ind 2 0 1 0 . . . 1
Ind 3 1 0 1 . . . 0
.. . .. . .. . .. . . . . .. .
Ind N 0 1 0 . . . 1
On the other hand, these are set to 0 if there are no recommendation relations. Each row of a matrix shows the raw genotype of each product individual and each column indicates the design variables of products.
Step 3 Reduce the number of dimensions of the design variable of product individuals by PCA.
Step 3-a Calculate the eigenvalue and eigenvec- tor from the adjacency matrix.
Step 3-b Define the number of dimensions of the design variables, extract the eigenvectors of the defined number in descending order of the absolute values of the eigenvalues, and generate a rotation matrix.
Step 3-c Obtain the principal component scores as genotypes of each product by multi- plying the original matrix by the rotation matrix.
C. Amazon Web Services
1) The outline of Amazon Web Services: In this paper, we obtained the recommendation relation data from Amazon Web Services (AWS) 2 . AWS are online services offered by Amazon.com, Inc., which enable the users to access to the product information database and utilize the technical platform. We made a design variable space from the product lists that are similar to the specified product. A list provided by AWS contains up to ten products.
2) Recommendation Algorithms on Amazon Web Services:
The main recommendation algorithm used on Amazon is Collaborative Filtering [11]. Collaborative Filtering is a tech- nique for analyzing a user’s past action record and predicting the taste of others who take similar actions. For example, if both user A and user B purchased the same product, another product purchased by user B is recommended to user A. Collaborative Filtering does not have numerical values representing a product as in Content Filtering because it does not focus on the attribute. Therefore, the recommendation relations of these data in this paper are based on the Amazon users’ shopping history logs.
2
http://aws.amazon.com/
D. Dimensional compression by Principal Component Anal- ysis
Principal Component Analysis (PCA) is a procedure that sets integrated indicators statistically to understand the cor- relation and characteristics among the variables. The vectors calculated to show the characteristics of original distribu- tion are called principal components. The component scores are the new distribution data converted by the principal components. We treated the principal components and the component scores as the design variables and the values of genes.
We applied PCA for the following reasons.
• Sparse Matrix
An adjacency matrix generated based on the recommen- dation data contains a large amount of 0, because we obtained only 10 products as recommendations from one product, as mentioned in section III-C.1.
If each row of the matrix is treated as a chromosome, iGA does not search properly because offspring do not inherit characteristics from the parents in the crossover operation of GA.
• Dependency of gene length on the number of products The directed graph based on the product recommen- dation relations is represented as an adjacency matrix whose numbers of rows and columns are the number of products. Therefore, if each row of the matrix is treated as a chromosome, the gene length depends on the number of products and the search space becomes very large.
IV. E XPERIMENTAL SIMULATION
A. Parameters of design variable spaces
In this paper, we generated the small three design variable spaces from the information of books sold on Amazon. These spaces were used in the subjective experiment (section V).
We compressed the number of dimensions to 5 to reduce the factors in the experiment.
The parameters of each space are shown in Table I.
TABLE I
P
ARAMETERS OF THE DESIGN VARIABLE SPACESCategory Initial Product Acquisition
Period
Number of Products Mystery Black Pean 1988
(2nd volume)
2009/12/31 - 2009/1/1
649 Computer
Science
Logical puzzles for programmers
2010/1/3 - 2010/1/4
703 Comic FULLMETAL AL-
CHEMIST 24
2010/1/1 - 2010/1/2
309
”Category” meant the category used on Amazon. ”Initial
Product” was the book that sold best in each Category during
the ”Acquisition Period.” First, we obtained the first book
list that ”Initial Product” recommended on AWS. Then, we
added to that list the new list recommended by one of these
products. This process was repeated. When a product on
the list was added, we skipped DVD products based on the results of a preliminary experiment [6]. The design variable space with products other than books did not reflect the users’ sensibility, because the users felt obvious differences between a book and different types of product even if they had recommended each other.
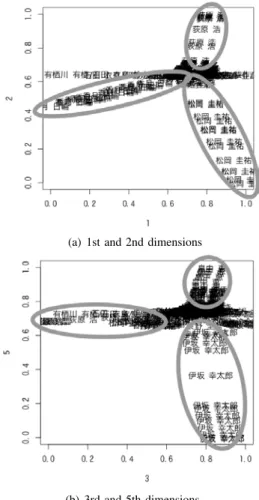
B. Relation of the distribution of products and attributes 1) Dependence of product distribution on authors: The distributions of ”Mystery” and ”Comic” showed dependency on the authors. Figure 3(a) shows a graph with the first dimension on the horizontal axis and the second dimension on the vertical axis in ”Mystery.” In addition, Figure 3(b) shows a graph with the third and fifth dimensions as axes.
(a) 1st and 2nd dimensions
(b) 3rd and 5th dimensions
Fig. 3. Distributions of authors in ”Mystery”
Specific authors tended to be fixed in a narrow range for each dimension. We confirmed the same trend in ”Comic”
as shown in Figure 4.
This was thought to be because Amazon users often bought books written by the same authors. Figure II shows the numbers of whole books, distinct authors, and books written by the same authors in each of the design variable spaces. The proportion of books written by the same authors in the whole 0.886 in ”Mystery,” which is about three times the proportion in ”Computer Science.”
Fig. 4. Distribution of authors in ”Comic” (3rd and 5th dimensions)
TABLE II
N
UMBERS OF BOOKS WRITTEN BY A SAME AUTHORCategory Total Books Distinct Au-
thors
Books Written by the Same Author
Mystery 649 205 575
Comic 309 135 216
Computer Science 703 498 213
Therefore, books written by the same authors tended to recommend each other and have a tight recommendation rela- tion. A tight recommendation relation gave a high correlation coefficient in the set of books as factors, because the value of the adjacency matrix is 1 if the row product recommends the column product, as mentioned in section III-B. The author bias can be seen in Figure 3(a).
2) Dependence of product distribution on the publisher:
Author, which showed strong bias in ”Mystery” and
”Comic,” did not show dependency in ”Computer Science.”
This was because the numbers of books written by the same authors were small, as shown in Table II. However, the distri- butions of ”Computer Science” showed dependency on book publishers. Figure 5 shows a graph with the first dimension on the horizontal axis and the second dimension on the vertical axis in ”Computer Science.” The same publishers were distributed over a narrow range on the horizontal axis.
This distribution was due to the level of specialization of books in ”Computer Science.” Therefore, users are thought to focus on trends of the publisher rather than the characteristics of the author. In addition, the cumulative proportion of books published by the same publishers in ”Computer Science” is 0.829. However, the other combinations of dimensions were not dependent on the publisher. It is necessary to analyze the technical terms contained in the title or customer reviews to confirm the characteristics of this design variable space.
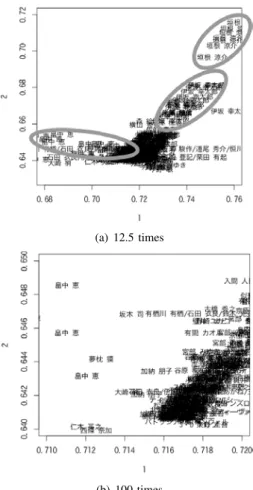
C. Number of dimensions
We discussed the appropriate number of dimensions of
the design variables. Figure IV-C show graphs to expand the
thick part of the distribution in Figure 3(a) in section 4.2.1
Fig. 5. Distribution of publishers in ”Computer Science” (1st and 2nd dimensions)
by 12.5 and 100 times, respectively.
We discussed the proper number of dimensions of the design variables. Figure 6(a) and Figure 6(b) were the graph to expand the thick part of the distribution in Figure 3(a) by 12.5 times and 100 times.
(a) 12.5 times
(b) 100 times
Fig. 6. Distributions of Authors in ”Mystery” (1st dimension and 2nd dimension)
The distribution of authors is shown in Figure 6(a), but was not confirmed in Figure 6(b). The subset of authors that did not any bias in was confirmed in the other combinations of dimensions, as shown in Figure 3(b). However, the other
authors did not show bias of the distribution from the first dimension to the fifth dimension.
One of the reasons for this was that the number of effective authors who belonged to one of the principal components was limited. Table III shows the list of authors with factor loadings calculated by principal factoring higher than 0.0646 for all dimensions. Factor loading is the index that indicates how much each factor influenced the principal component.
0.0646 was calculated in Equation (1) when the significance level was 0.10.
r(0.10) =
√ n − 1
1.645 (1)
TABLE III
A
UTHORS WITHH
IGHF
ACTORL
OADINGDimension Authors
1 Keisuke Matsuoka, Hinowa Kogetsu, Megumi Hatanaka
2 Keisuke Matsuoka, Hiroshi Ogiwara 3 Hiroshi Ogiwara, Ryosuke Kakine 4 Ryosuke Kakine
5 Kotaro Isaka, Megumi Hatanaka, Yu Shibata (coauthor of Megumi Hatanaka), Ira Ishida/Takuji Ichikawa/Eiichi Nakata/Wataru Nakamura/Takayoshi Honda (coauthors of Kotaro Isaka)
The number of authors with high factor loading is up to 3. None of the authors showed high factor loadings for all components. It is necessary to use more principal components to determine the dependence on more authors in the distributions. For example, we considered the number of principal components with cumulative contribution rates above 0.6.
However, the performance of the search by iGA decreases with increasing number of dimensions. There is a tradeoff between large number of dimensions to reflect the corre- lation of the adjacency matrix and the iGA search ability.
Therefore, it is necessary to develop a method calculating the appropriate number of dimensions.
V. A PPLICATION OF I GA TO THE DESIGN VARIABLE SPACES GENERATED BY THE PROPOSED METHOD
A. Experiment System
Our goal was to confirm how users search the solutions by iGA in the design variable spaces generated by the proposed method. To consider the proposed method, we constructed a book iGA system that used the spaces generated as described in section IV.
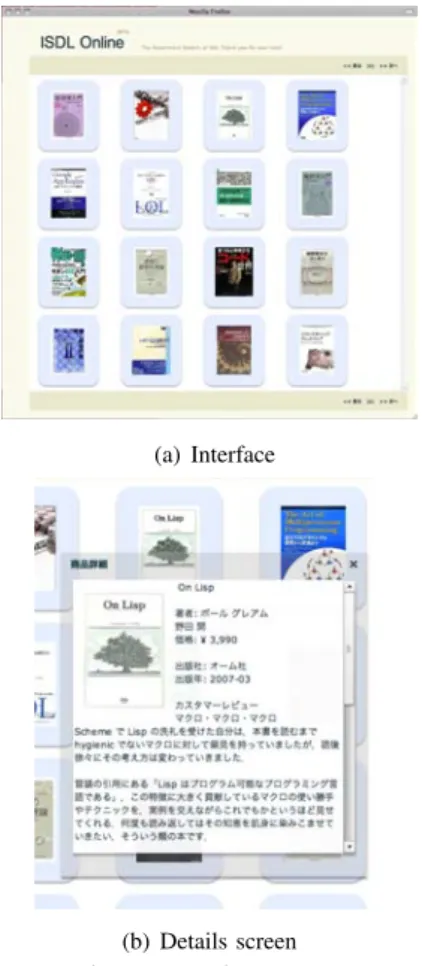
1) System Interface: Figure 7(a) shows the interface of
the experimental system. The subjects selected the products
according to their subjective preference from the 16 products
on display. The information provided for them is shown in
Table IV. They were able to see the detailed information
of a product on the popup window (Figure 7(b)) by putting
the mouse cursor over the cover of a book. The popup was
removed by moving the mouse cursor from it.
(a) Interface
(b) Details screen Fig. 7. Experiment system
TABLE IV
P
RODUCTI
NFORMATION PROVIDEDWindow Product Information
Interface (Figure 7(a)) book cover
Detail (Figure 7(b)) book cover, title, authors, price, date of publication, publisher, customer review
The maximum number selected by the subject was 8, which was half of the displayed products. The subject se- lected one or more products and clicked the ”Next” button at the top right of the screen. The system ran the GA operation using the subject’s evaluations and updated the products on the interface.
2) Optimization Method: The experimental system used GA as the optimization method. The main parameters of GA are shown in Table V.
If a chromosome generated in the genetic operations did not match any existing product chromosome, it was replaced with a real product in the design variable space. In this case, the system selected a chromosome which was the nearest on the Euclidean distance of the individuals not displayed in this generation, because the subject memorized the last displayed products.
In the more intuitive iGAs that optimize simple factors, such as color and shape [13], the subjects did not mem-
TABLE V
IGA
PARAMETERSParameter Value
Population size 16
Dimension size 5
Generation size 4
Crossover method BLX-α[12]
Crossover rate 1
α 0.2
Mutation method Uniform Mutation
Mutation rate 0.2
orize the individuals shown immediately before. However, an object containing strings or that was associated with a subject’s knowledge was memorized well, because they evaluated the individuals using not only their sensitivity but also their knowledge. In the preliminary experiment, if the same individuals were displayed continuously, the subjects became tired of seeing them or felt strange about evaluating them [6].
B. Experiment Procedure
We used the design variable spaces generated in section IV-A: ”Mystery,” ”Comic,” and ”Computer Science.” One trial was performed to evaluate four generations in the iGA for one of the spaces. The subject operated the iGA system for every space, and so performed three trials in total. The order of operations for each space was shuffled.
The number of subjects whose year old were from 22 to 29 was 6 . The experimental procedure was as follows.
1) Giving instructions to the subject
To motivate the subject to select books, we gave each subject instructions such as ”You are going to take a day off tomorrow and read a book. So, search for a book you will like.”
2) iGA operation
The subject performed one trial.
3) Questionnaire
The subject answered the following questions on an ascending risk scale from 1 to 5.
Q1 How satisfactory were the products displayed in the final generation?
Q2 How diverse were the products displayed in the final generation?
Q3 Which of the specific products or the diverse products did you select?
4) End Condition
The experiment ended if the subject operated the iGA on all design variable spaces. If not, the subject returned to step 2.
In the questionnaire, the subject provided responses re-
garding satisfaction, diversity, and search trend. The satis-
faction is very important, because the purpose of the iGA is
to search for the optimized solution fitting a user’s preference through the interaction between the user and the system.
In iGA, the diversity tends to be lost because the number of individuals displayed is reduced so that the subject can perform the evaluation easily. Therefore, the diversity was also examined to consider the influence of diversity on subject satisfaction.
C. Experimental Result
1) Discussion of the differences in search results among subjects: The experimental results indicated that the search results varied among the subjects. Figure 8(a) and Figure 8(b) show the search results of subjects A and B in ”Mystery.”
Black triangles and white circles indicate individuals of the first and the last (4th) generation, respectively.
!
!
!
!!
!
!
!
!
!
!
!
!
!
!
!
!
!
!
!
!
!
!
!!
!
!
!
!
!
!
!
!
!
!
!
!
!
!
!
!
!
!!
!
!
!!
!
!!
!
!
!
!
!
!
!!!
!
!
!!
!!
!
!
!
!!!!!!
!!!!!!!!
!!!!!!
!
!!!!!!!
!
!!!!
!
!!!
!
!!
!!!!
!!!!!
!
!
!
!!
!!!!
!
!!
!!
!!!
!
!!
!
!
!!
!
!!
!
!!!!
!!
!
!
!
!
!!!!
!
!!!!!!!!
!
!
!
!
!
!!!!
!!!!!!
!
!!!
!
!
!
!
!
!
!
!
!
!
!!!!!!!
!
!
!
!
!
!
!
!
!!
!
!!
!
!
!
!
!
!
!
!
!!
!
!!!!!!!!!!!!!!
!
!
!!!!!!!!!
!!
!!!!!
!!!
!!!!!
!!!!!!!!!!!!!!!
!!!!
!!!!!!!!!!!
!
!
! !! ! !!
!
!
0.0 0.2 0.4 0.6 0.8 1.0
0.00.20.40.60.81.0
(a) Subject A
!
!
!
!!
!
!
!
!
!
!
!
!
!
!
!
!
!
!
!
!
!
!
!!
!
!
!
!
!
!
!
!
!
!
!
!
!
!
!
!
!
!!
!
!
!!
!
!!
!
!
!
!
!
!
!!!
!
!
!!
!!
!
!
!
!!!!!!
!!!!!!!!
!!!!!!
!
!!!!!!!
!
!!!
!!
!!!
!
!!
!!!!
!!!!!
!
!
!
!!
!!!!
!
!!
!!
!!!
!
!!
!
!
!
!
!
!!
!
!!!!
!!!!
!
!
!!!
!
!
!!!!!!!!
!
!
!
!
!
!!!!
!!!!!!
!
!!
!
!
!
!
!
!
!
!
!
!
!
!!!!!!!
!
!
!
!
!
!
!
!
!!
!
!!
!
!
!
!
!
!
!
!
!!
!
!!!!!!!!!!!!!!
!
!
!!!!!!!!!
!!
!!!!!
!!!
!!!!!
!!!!!!!!!!!!!!!
!!!!
!!!!!!!!!!!
!
!
! !! ! !!
!
!
0.0 0.2 0.4 0.6 0.8 1.0
0.00.20.40.60.81.0
(b) Subject B
Fig. 8. Comparison of the final generation distributions (1st and 2nd dimensions of ”Mystery”)
The sets of individuals displayed to Subject A and Subject B in the first generation were the same. However, the sets in the final generation were different. This result suggested that the subjects were able to search the solutions based on their own preference in the generated design variable spaces.
The individuals selected by Subject A in the final generation were distributed in a narrow range on the vertical axis, while those of Subject B were distributed in a narrow range on the horizontal axis. Therefore, the dependency of the subjects’
preferences on the dimensions was confirmed.
2) Comparison of recommendation algorithms: We com- pared the results recommended by iGA and those recom- mended by Amazon. Figure 9 shows the subset of indi- viduals generated by iGA from the collections of products evaluated by Subject B in the 3rd generation in ”Comic.”
The products recommended by the same collection are also shown. Circles are painted on the individuals evaluated by Subject B in the 4th generation.
The results of iGA recommendation and those of Amazon partially overlapped, and some individuals evaluated in the 4th generation also overlapped. However, only the individ- uals recommended by iGA (non-Amazon selections) were evaluated. This suggested that the iGA recommendation was different from the original recommendation data. In addition, the recommendation by iGA satisfied the subject.
The proportions of non-Amazon selections in the individ- uals evaluated by each subject are shown in Table VI.
The average for all subjects was 0.390. Thus, the non- Amazon selections showed comparatively high evaluations.
Overlapped
Generated by IGA
Recommended by IGA