2017 IEEE International Conference on Big Data (BIGDATA)
A Trade-off between Estimation Accuracy of Worker Quality and Task Complexity
Yoshitaka Matsuda1, Yu Suzuki1,2, and Satoshi Nakamura1,2
1Graduate School of Information Science,2Data Science Center
1Nara Institute of Science and Technology
1Nara, Japan
Email:{matsuda.yoshitaka.mq2, ysuzuki, s-nakamura}@is.naist.jp
Abstract—In crowdsourcing, many people are less capable of producing quality work, and there are those who work inadequately. We can improve the quality of work, and also we can decrease time and wages if we eliminate poor workers and give extra instruction to their workers. Therefore, estimating work quality is essential for uncovering poor workers. In existing studies, the response behavior of workers was used to estimate their quality. However, in these studies, the authors only apply to complicated tasks that have many types of response behavior. In this paper, we propose a method for estimating the quality of workers by their response behavior by intentionally complicating a simple task. By doing so, we can get more accurate and detailed response behavior. By using accurate and detailed response behavior even in simple tasks that have few types of response behavior, the estimation accuracy of low-quality workers improved. However, workers had to work for slightly longer.
Keywords-crowdsourcing; quality; behavior; task complica- tion;
I. INTRODUCTION
Crowdsourcing is the online process of requesting tasks to be completed by a crowd of general people and then paying them for their work. A problem with microtasking (large jobs split into small tasks and distributed online for completion by many people) is that the quality of work received is not guaranteed. Some people cannot achieve the correct results depending on the difficulty of the task and others who perform poor work with malicious intent, such as financial gain. Getting good results is not always possible due to the existence of such workers.
Redundancy, an approach in which multiple workers process the same task, is commonly used to measure such a problem [1]. We will explain how redundancy works by using a data-labeling task as an example. By using redundancy, multiple labels are assigned to one piece of data. Then, the labels are integrated by a majority vote [2], [3] or an expectation-maximization (EM) algorithm [4], [5] and the final labels are decided. Redundancy is used under the assumption that most workers perform accurate work. Therefore, when there are many unreliable workers, as mentioned above, redundancy does not work. Besides, the person requesting the work must provide money and time in
proportion to the number of workers being made redundant.
Two things lead to improved integration accuracy of multiple labels in redundancy and cost-saving by reducing redundancy. The first is the elimination of people who do not work adequately. That is, people who are judged to be unreliable are prohibited from doing work. The second is giving proper instruction to those who are less capable.
Proper instruction may improve the workers’ abilities. In this way, by eliminating or instructing workers, we can secure from dangerous people who produce low-quality work.
Thus, a significant task is the extraction of people who work inadequately and are less capable of working ad- equately. In other words, we must properly estimate the quality of work produced by each person. There are several approaches for estimating worker quality. The first approach is to mix tasks designed to test workers’ abilities [6]. In this approach, labor and cost are incurred by the person requesting the work because it is necessary to create test tasks that correctly judge the level of work quality. The second approach is to estimate worker quality from their work results [4], [7]. This approach is based on redundancy.
Therefore, wages and temporal costs are not expected to be reduced. In recent years, research has been conducted to estimate a quality of work by workers’ behavior (the third approach) [8]–[11]. This approach can reduce costs because we can estimate the quality of work without the use of test tasks or redundancy. In this paper, we focus on this approach.
However, previous research has a problem that needs to be solved. The approach can only be applied to tasks that have many different response behaviors.
In this paper, we propose a method that estimates the quality of a person’s work by completing a simple task that triggers few response behaviors. In particular, we complicated simple tasks to obtain information on many types of behavior. We also analyzed the impact of the complicated tasks on the workers. This method improves the estimation accuracy of people who produce low-quality work. Furthermore, we found that, when using the proposed method, ’browsing count’ for problems that triggered new response behaviors is one of the most important behaviors for estimating worker quality. Also, we gave the test subjects
only an additional four seconds of working time to complete the complicated task.
II. RELATEDWORK
In this section, we introduce the previous research that to estimate worker quality by the workers’ response behavior.
We also describe the relevance of this research in comparison with previous research.
Mok et al. [8] tried to detect low-quality workers in quality of experience crowdtesting. In their research, the workers had to answer 15 multiple choice questions and one open-ended question regarding video quality. They detected low-quality workers by analyzing the movements of their mouse cursors. That is, they treated the track of the mouse cursor as part of the worker’s response behavior.
Hirth et al. [9] detected low-quality workers in English language comprehension tasks. The workers had to answer 25 questions on a web page. They measured the time in which the worker read the problem and the time in which the worker considered the answer by scrolling through the page or clicking on the radio buttons. They classified low- quality or high-quality workers by these response behaviors.
Rzeszotarski et al. [10] conducted experiments on the work- ers’ performance of three different tasks. The first was a 200-word task classifying parts of speech. The second was nine English language comprehension tasks. The third was three to five tag-description tasks for four different images.
They identified low-quality workers by 20 different response behaviors that they exhibited, such as the length of the work log, time spent inputting answers, and mouse and keyboard use. Kazai et al. [11] used three different tasks. Those tasks were: a relationship evaluation of a web search query and the following results page, a comparison of two web pages, and a comparison of two search lists. They classified whether worker quality was above average by 160 different response behaviors, such as processing time and mouse and click activity. Also, they reported that low-quality workers were detected with higher accuracy by using expert behaviors.
In these studies, tasks with many response behaviors were used to estimate worker quality. That is, the worker had to perform multiple processes within a single task. Even in relatively simple classification work, multiple tasks are performed within a single task by providing many identical tasks at once. However, there are reports that high-quality results can be obtained by dividing tasks into as many microtasks as possible [12], [13]. Therefore, it is considered undesirable to provide many identical tasks at once.
For simple tasks, such as just labeling one image, response behaviors that can be acquired are limited. Therefore, it is considered difficult to apply these previous studies to simple tasks because worker quality is not necessarily related to response behaviors when few behaviors can be obtained.
Furthermore, it is impossible to judge the quality of an excellent worker accurately when only analyzing a small
&%
$ !
&$%! $%$%%!"$!#$%$ (!%!
$# %$%'%
!!' (!%!$%%! $#!'
)
%'%$ !%$"(
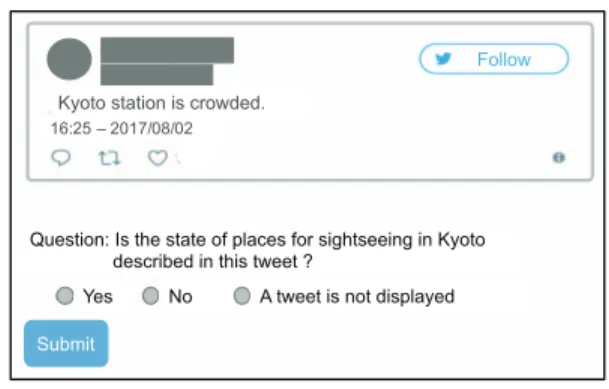
Figure 1: Screen for baseline task
Table I: Response behaviors acquired from baseline task
Behavior Example value
Processing time per task(B1) 1, 5, 10 Answer time per task(B2) 1, 5, 10 Number of answer change per task(B3) 0, 1, 2
number of behaviors. For example, when trying to judge worker quality only by processing time, the quality of workers who process tasks quickly and accurately may be incorrectly estimated.
In this paper, we focus on simple tasks with few response behaviors and then complicate the task to acquire many other behaviors. In addition to estimating worker quality, we also discuss the impact of the workload on workers due to the complication of the tasks. Furthermore, we examine what kinds of response behavior should be analyzed to estimate worker quality.
III. TASKS
In this section, we describe the tasks performed to verify the effectiveness of the proposed method. The task was to label whether a tweet satisfies the following two points:
• The state of Kyoto is written in the tweet.
• The state is useful for sightseeing in Kyoto.
The workers had to select either ’Yes,’ ’No,’ or ’A tweet is not displayed.’ If a user who posted a tweet deleted the tweet, the tweet could no longer be displayed on the screen.
For that reason, we prepared the option ”A tweet is not displayed.”
A. Baseline Task
In the baseline task, workers read the displayed tweet and selected an answer from three choices. The screen for the baseline task is shown in Fig. 1. When the workers pressed the submit button, the next tweet was displayed. The workers repeated this task. The types of worker behavior available were B1, B2, and B3 (shown in Table I).
%&&'(''#"'# ##')'
(!'
& #
(&'#"&'&''#$ &#%&'&""*#'#
&%"'&')'
# #)
*#'#&''#"&%#) +
')'&"#'&$ *
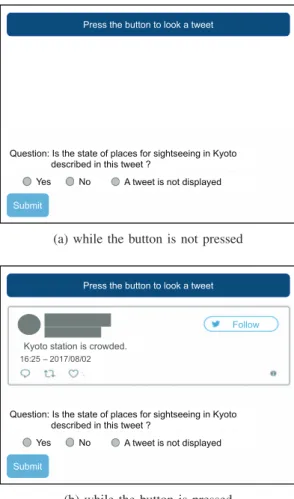
(a) while the button is not pressed
%&&'(''#"'# ##')'
(!'
& #
(&'#"&'&''#$ &#%&'&""*#'#
&%"'&')'
# #)
*#'#&''#"&%#) +
')'&"#'&$ *
(b) while the button is pressed Figure 2: Screen for proposed task
B. Proposed Task
In the proposed task, the tweets were not displayed in advance, unlike normal tasks; instead, a button was set up.
The tweet was displayed only when the worker was pressing this button. By doing so, we could get more accurate tweet- browsing times and tweet-browsing counts. The screen of the proposed task is shown in Fig. 2. In crowdsourcing, it is expected that the people completing the work are doing more than two different things at the same time while processing the tasks because they are not being monitored by anyone and can access the Internet. For example, they may be doing other work on their computer or watching TV while processing a task. We set up a button because we thought that just processing time does not represent accurate working time due to the possibility of doing more than two different things at the same time. From the proposed task, we obtained new worker response behaviors B4, B5, B6, and B7 (shown in Table II) in addition to the behaviors shown in Table I.
IV. DISCOVERY METHOD OF LOW-QUALITY WORKERS
In this section, we describe the method for discovering low-quality workers by their response behavior in the task
Table II: Response behavior acquired from proposed task
Behavior Example value
Tweet browsing time per task (B4) 5, 10, 20 Tweet browsing count per task (B5) 0, 1, 2
The ratio of tweet browsing time
to processing time per task (B6) 0.2, 0.5, 0.8 Tweet browsing time per browsing (B7) 2, 5, 10
Figure 3: Overview of our experiments
described in Section III. An overview of our experiments is shown in Fig 3. The workers generated behaviors B1 to B10 (shown in Section III) while processing the tasks requested by us. However, the workers who exhibited behaviors B4 to B7 were the only workers who employed in the proposed task. We classified workers as high-quality or low-quality workers with classifiers by these response behaviors.
A. Classifier Construction
The quality of the workers was estimated by using all the behaviors of the tested workers. In other words, we estimated worker quality after the completion of all the tasks set by the requester. We constructed a classifier that output worker qualityP when featureB of the worker was input. We used a Support Vector Machine (SVM) as a classifier.
We calculated the mean, median, standard deviation, en- tropy, maximum, and minimum for each of the worker’s behaviors. The features of the worker were the standardized values of these values. In addition to behaviors B1 to B7, standardized values of B8, B9, and B10, which are shown in Table III, were also used as features of the workers.
The output of the classifier was binary whether or not the correct answer rate of the worker was equal to or more than the median value of the correct answer rate. The following
Table III: Worker behaviors
Behavior Example value
Number of total task processing(B8) 100, 1000, 10000 Total task processing time(B9) 500, 1000, 100000 Number of task processing per hour(B10) 100, 200, 300
formula defined the correct answer rate Pw of the worker w:
Pw= Tw
Nw
×100 (1) Here, Nw is the total number of tasks processed by the worker w, and Tw is the total number of processed tasks which workerwselected the correct answer. Also, the correct labels were decided by the majority choice of ten workers.
B. Quality Estimation
We constructed a classifier for each baseline and proposed task and used the classifiers to estimate worker quality.
The classification of this experiment can be formulated as follows:
f(Bw) =
−1 (Pmedian< Pw) (2a) 1 (Pmedian> Pw) (2b) Here, Pmedian is the median of the correct answer rate, Pw is the expected value for the correct answer rate of the workerw,Bw is the feature of the workerw, andf is the classifier.
That is, the classifier predicts whether the correct answer rate of the worker is equal to or more than the median value of the correct answer rate as judged by the response behaviors of the worker. In this paper, we defined a worker whose correct answer rate was less than the median value as a low-quality worker and defined a worker whose correct answer rate was more than the median value as a high- quality worker.
V. EXPERIMENTS
A. Experimental Setup
We built our own platform and recorded the workers’
behaviors using Javascript and jQuery library. Then, we recruited workers from an existing crowdsourcing platform (Crowdworks1).
The workers could suspend, resume, or stop work at their own pace. In other words, we did not decide the number of tasks to be processed by the workers. This was to divide the task into as many microtasks as possible by Alonso’s and Kittur’s reports [12], [13]. For this reason, the number of tasks being processed varied depending on the worker and we used this as part of the worker’s behavior.
1http://www.crowdworks.jp
(a) Baseline task
(b) Proposed task
Figure 4: Distribution of worker’s correct answer rate
The workers earned 30 JPY (about $0.3) for every 100 tweets that they processed. Workers processed about 450 tweets per hour on average. This means that the workers earned about 135 JPY (about $1.35/hour) per hour. This wage is almost equal to the standard crowdsourcing wage ($1.38/hour) [14].
We set parametersCandγfor grid search. Also, we used the leave-one-out method to evaluate classification accuracy.
B. Workers
In the baseline tasks, 96 workers were employed, and in the proposed task, 99 workers were employed, while 33 workers were employed in both tasks. However, the workers whose total number of processed tasks was less than 100 were excluded in this experiment. The number of tasks processed for the baseline task was 49,005, and the number of tasks processed for the proposed task was 45,114.
Figure 4 shows the distribution of correct answer rates for the baseline and proposed tasks. In the baseline and proposed tasks, the correct answer rate was tested using Mann- Whitney’s U, but no significant difference was observed (p = 0.21 > 0.05). It seems that the complexity of the task did not change the task difficulty level for the tested workers.
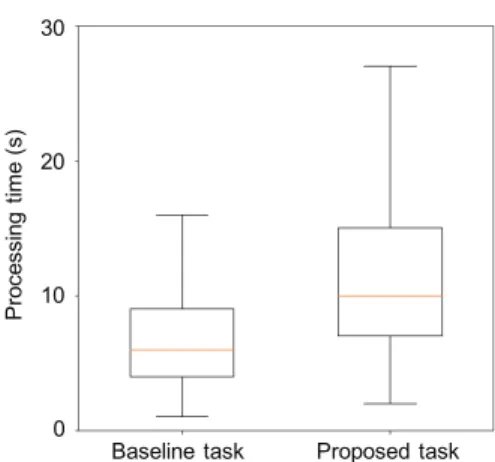
Figure 5: Processing time distribution
The distribution of processing time per task is shown in Fig. 5. The median processing time for the baseline task was six seconds and the median processing time for the proposed task was ten seconds. The processing time increased by four seconds for the proposed task, that is, the workers had to spend a long time completing the work.
C. Classification
We classified low-quality or high-quality workers by using an SVM. In this paper, a low-quality worker is defined as a person whose correct answer rate was less than the median value. The classification results for the baseline and proposed tasks are shown in Table IV with a confusion matrix. In the baseline task, the F-measure of low-quality workers was 0.52. On the other hand, the F-measure im- proved to 0.63 in the proposed task. It is important to discover comprehensively the low-quality workers as much as possible when applying this classification result to the elimination of low-quality workers. In other words, the recall of low-quality workers is important. The recall of low-quality workers was 0.71 in the proposed task but the recall was 0.52 in the baseline task. This indicates that the proposed method is effective. However, the classification of high-quality workers could not be classified accurately in either task.
Next, we checked which response behavior from among the behaviors that were acquired in the proposed task was most useful for classification. To do this, the extra behaviors were removed one by one from the feature and classified similarly using the SVM. Table V shows the classification accuracy of low-quality workers. The lowest accuracy oc- curred when the tweet-browsing count were excluded from the feature (All - B5). The confusion matrix at that time is shown in Table VI. Classification could not be done regardless of the workers’ quality when there was no tweet- browsing count.
Table IV: Confusion matrix (a) Baseline task
Predict
Low-quality High-quality
Gold Low-quality 25 23
High-quality 23 25
(b) Proposed task Predict
Low-quality High-quality
Gold Low-quality 35 14
High-quality 27 23
Table V: Classification accuracy when removing a feature
Behavior Precision Recall F-measure
All 0.56 0.71 0.63
All-B4 0.55 0.69 0.61
All-B5 0.44 0.47 0.46
All-B6 0.56 0.71 0.63
All-B7 0.55 0.71 0.62
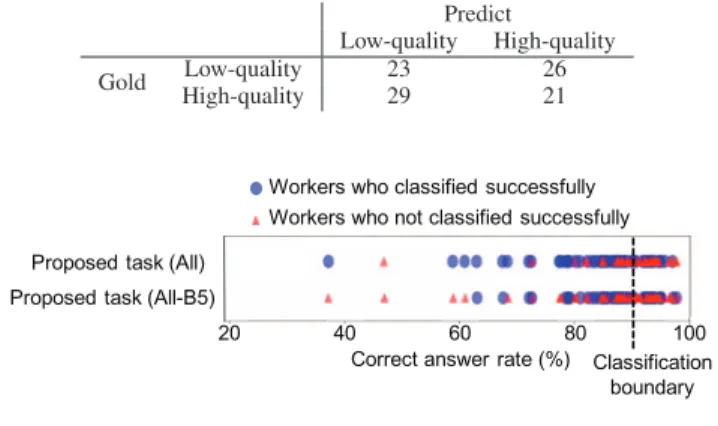
Furthermore, details of classified results of the proposed task with and without B5 (All - B5) are shown in Fig. 6.
Each circle or triangle represents a worker. Circles represent successful workers, as judged by the classification; the trian- gles represent failed workers. Workers near the classification boundary (the median value of the correct answer rate) could not be classified from either task. However, we were able to classify workers with an accuracy of only 47% in the baseline task and classify workers with an accuracy of 87% in the proposed task when considering only workers with a correct answer rate of 80% or less. This means that not low-quality workers near the classification boundary but an obviously low-quality worker can be classified as low- quality worker with high accuracy.
Table V and Fig. 6 indicate that it was difficult to estimate people that produce low-quality work if there was no tweet-browsing count. A tweet-browsing count, which was acquired by setting up a tweet-browsing button in the proposed task, is considered to be an effective response behavior for classifying low-quality workers.
On the other hand, it was difficult to classify high-quality workers even using the tweet-browsing count. We think this is because we tried to classify workers by the median correct answer rate. The median value of the correct answer rate was about 90% at its highest, so there is a possibility that the behavior of the high-quality and low-quality workers near the classification boundary had no difference or characteris- tics. So, we plan to analyze the behavior of the workers and review the classification boundary.
Table VI: Confusion matrix of proposed task with the tweet- browsing count removed
Predict
Low-quality High-quality
Gold Low-quality 23 26
High-quality 29 21
! #!
!
# " "$
#! " "$
!
!
"$
Figure 6: Classification result
VI. CONCLUSION
In this paper,we proposed a method for estimating the quality of a worker by his or her behavior in a simple crowdsourcing task. We set up a tweet-browsing button to acquire many types of behavior by complicating simple tasks that only produced a few response behaviors. The classification accuracy of low-quality workers improved in our method, though it was difficult to estimate the worker quality in the simple task of the baseline method. We also found that the tweet-browsing count was an effective form of responsible behavior for estimating worker quality. In the proposed task, workers had to work for slightly longer, but the task difficulty level did not change.
Our future work includes the following. First is to analyze the workers’ characteristics for each classification result.
It is necessary to analyze in detail what kind of worker classification succeeded or failed. By doing so, knowledge of effective response behavior can be further obtained to estimate worker quality.
The second is to consider task difficulty. In this experi- ment, we assumed that the difficulty level of each task was equal. However, the difficulty level may be different for each tweet in practice. Furthermore, in the experiment’s tasks, the average correct answer rate was about 90% at its highest, and the correct answer rate of most workers was high. We should verify worker ability by tasks that vary in correct answer rate (i.e., some tasks are more difficult and thus have a low correct answer rate).
The third is to verify the versatility of the proposed method. In this paper, we conducted experiments on one task. We think that the method is effective for other clas- sification and labeling tasks. For example, in the case of labeling images, the method can be applied by switching the display and non-display of images with buttons, as in this experiment. We are planning to consider experiments with other tasks and also add complications to them.
ACKNOWLEDGMENT
The research results have been achieved by Research and Development on Fundamental and Utilization Technologies for Social Big Data, the Commissioned Research of National Institute of Information andCommunications Technology (NICT), JAPAN. The research was partially supported by NAIST Big Data Project.
REFERENCES
[1] P. Smyth, U. M. Fayyad, M. C. Burl, P. Perona, and P. Baldi,
“Inferring ground truth from subjective labelling of venus im- ages,” inAdvances in neural information processing systems, 1995, pp. 1085–1092.
[2] V. S. Sheng, F. Provost, and P. G. Ipeirotis, “Get another label? improving data quality and data mining using multiple, noisy labelers,” in Proceedings of the 14th ACM SIGKDD international conference on Knowledge discovery and data mining. ACM, 2008, pp. 614–622.
[3] R. Snow, B. O’Connor, D. Jurafsky, and A. Y. Ng, “Cheap and fast—but is it good?: evaluating non-expert annotations for natural language tasks,” inProceedings of the conference on empirical methods in natural language processing. As- sociation for Computational Linguistics, 2008, pp. 254–263.
[4] A. P. Dawid and A. M. Skene, “Maximum likelihood estima- tion of observer error-rates using the em algorithm,”Applied statistics, pp. 20–28, 1979.
[5] S. Oyama, Y. Baba, Y. Sakurai, and H. Kashima, “Accurate in- tegration of crowdsourced labels using workers’ self-reported confidence scores.” inIJCAI, 2013, pp. 2554–2560.
[6] G. Kazai, J. Kamps, M. Koolen, and N. Milic-Frayling,
“Crowdsourcing for book search evaluation: impact of hit design on comparative system ranking,” in Proceedings of the 34th international ACM SIGIR conference on Research and development in Information Retrieval. ACM, 2011, pp.
205–214.
[7] V. C. Raykar, S. Yu, L. H. Zhao, A. Jerebko, C. Florin, G. H.
Valadez, L. Bogoni, and L. Moy, “Supervised learning from multiple experts: whom to trust when everyone lies a bit,” in Proceedings of the 26th Annual international conference on machine learning. ACM, 2009, pp. 889–896.
[8] R. K. Mok, R. K. Chang, and W. Li, “Detecting low- quality workers in QoE crowdtesting: A worker behavior- based approach,”IEEE Transactions on Multimedia, vol. 19, no. 3, pp. 530–543, 2017.
[9] M. Hirth, S. Scheuring, T. Hoßfeld, C. Schwartz, and P. Tran- Gia, “Predicting result quality in crowdsourcing using appli- cation layer monitoring,” inCommunications and Electronics (ICCE), 2014 IEEE Fifth International Conference on. IEEE, 2014, pp. 510–515.
[10] J. M. Rzeszotarski and A. Kittur, “Instrumenting the crowd:
using implicit behavioral measures to predict task perfor- mance,” inProceedings of the 24th annual ACM symposium on User interface software and technology. ACM, 2011, pp.
13–22.
[11] G. Kazai and I. Zitouni, “Quality management in crowd- sourcing using gold judges behavior,” inProceedings of the Ninth ACM International Conference on Web Search and Data Mining. ACM, 2016, pp. 267–276.
[12] O. Alonso, “Implementing crowdsourcing-based relevance experimentation: an industrial perspective,” Information re- trieval, vol. 16, no. 2, pp. 101–120, 2013.
[13] A. Kittur, E. H. Chi, and B. Suh, “Crowdsourcing user studies with mechanical turk,” inProceedings of the SIGCHI conference on human factors in computing systems. ACM, 2008, pp. 453–456.
[14] J. J. Horton and L. B. Chilton, “The labor economics of paid crowdsourcing,” inProceedings of the 11th ACM conference on Electronic commerce. ACM, 2010, pp. 209–218.