Feeding Value Evaluation of Growing and Fattening Diets by in vivo and in vitro Methods
㸦
㸦 ,QYLYR ࠾ࡼࡧ LQYLWUR ἲࡼࡿ࣓ࣥࣚ࢘ࡢ⫱ᡂ࣭⫧⫱ᮇ
࠾ࡅࡿ⤥㣫ᩱホ౯㸧
Da Hye KIM
2016
Feeding Value Evaluation of Growing and Fattening Diets by in vivo and in vitro Methods
㸦
㸦 ,QYLYR ࠾ࡼࡧ LQYLWUR ἲࡼࡿ࣓ࣥࣚ࢘ࡢ⫱ᡂ࣭⫧⫱ᮇ
࠾ࡅࡿ⤥㣫ᩱホ౯㸧
Da Hye KIM
THE UNITED GRADUATE SCHOOL OF AGRICULTURAL SCIENCES,
TOTTORI UNIVERSITY, JAPAN
MARCH 2016
Feeding Value Evaluation of Growing and Fattening Diets by in vivo and in vitro Methods
㸦
㸦,QYLYR࠾ࡼࡧLQYLWURἲࡼࡿ࣓ࣥࣚ࢘ࡢ⫱ᡂ࣭⫧⫱ᮇ
࠾ࡅࡿ⤥㣫ᩱホ౯㸧
Thesis submitted to the United Graduate School of Agricultural Sciences, in partial fulfillment of the requirements for the award of the degree of Doctor of Philosophy
of Tottori University, Japan
By DaHye KIM
Major Supervisor
Professor Toshiyoshi ICHINOHE
Co-supervisor Co-supervisor
Assist. Professor Sang-houn SONG Assoc. Professor Eiji Hosoi
The United Graduate School of Agricultural Sciences, Tottori University, Japan
March 2016
Table of Contents
List of Tables ... iv
List of Figures ... v
List of Abbreviations ... vi
Acknowledgements ... viii
Declaration ... x
CHAPTER ONE General Introduction ... 1
1.1 Background Information ... 2
1.2 General Objective... 3
1.3 Specific Objectives... 3
CHAPTER TWO Effects of Grass Forage Species and Long-Term Period of Low Quality Forage Diet Feeding on Growth Performance, Nutrient Utilization, Microbial Nitrogen Yield and Carcass Characteristics in Growing Wethers ... 5
2.1 Summary ... 6
2.2 Introduction ... 7
2.3 Materials and Methods ... 9
2.3.1 Animals and diets ... 9
2.3.2 Experimental procedure and measurements ... 11
2.3.3 Chemical analyses ... 12
2.3.4 Statistical analysis ... 13
2.4 Results and Discussion ... 13
2.4.1 Diet characteristics ... 13
2.4.2 Growth performance and feed intake ... 14
2.4.3 Apparent digestibility and nutrients intake ... 16
2.4.4 Nitrogen balance and MBN supply ... 20
2.4.5 Carcass characteristics of wethers for hogget production ... 22
CHAPTER THREE Relationship Between Nutrient Supply to Muscle and Adipose Tissues and N Retention in Growing Wethers on Forage Based Diets Fed with Different Forage Sources ... 25
3.1 Summary ... 26
3.2 Introduction ... 27
3.3 Materials and Method ... 28
3.3.1 Animals and diets ... 28
3.3.2 Experimental procedures... 29
3.3.3 Chemical analyses ... 31
3.3.4 Calculations ... 31
3.3.5 Statistical analysis ... 32
3.4 Results and Discussion ... 32
3.4.1 Concentrations of blood plasma metabolites ... 32
3.4.2 Plasma flows and nutrients supply to body tissues ... 34
3.4.3 The proration of nutrition in the body ... 36
3.4.4 Effect of forage based diets feeding on N balance ... 36
CHAPTER FOUR Effects of Forage Based Diet on Adipogenesis of Ovine Adipocytes ... 41
4.1 Summary ... 42
4.2 Introduction ... 43
4.3 Materials and Methods ... 45
4.3.1 Animals and diet ... 45
4.3.2 Blood sampling and serum fractionation ... 47
4.3.3 Preparation of sheep preadipocytes and cell culture ... 47
4.3.4 Total RNA extraction and real-time PCR ... 48
4.3.5 Oil red O staining ... 49
4.3.6 Statistical analysis ... 49
4.4 Results and Discussion ... 51
4.4.1 Nutrients intake ... 51
4.4.2 Fat accumulation of cloned sheep preadipocytes during treatment with an FBS-free induction medium... 51
4.4.3 The relationship between adipogenic gene mRNA expression levels and fat accumulation ... 53
4.4.4 Treatment of serum samples collected from sheep fed different diets and proportion of forage and concentrate on adipocyte differentiation ... 55
CHAPTER FIVE General Conclusions ... 61
List of References ... 66
Summary (Japanese) ... 79
Summary ... 83
List of Publications ... 85
List of Tables
Table 2.1 Chemical composition of feed offered wether lambs for 12 months of feeding period ... 10 Table 2.2 Body weight gain, feed intake and feed efficiency in wether lambs fed
forage based diets for 12 months of feeding period ... 17 Table 2.3 Apparent digestibility and intakes of digestible CP, ME and NFC in
wether lambs fed forage based diets for 12 months of feeding period ... 19 Table 2.4 Nitrogen balance, microbial nitrogen supply and efficiency of microbial
nitrogen synthesis in wether lambs fed forage based diets for 12 months of feeding period ... 21 Table 2.5 Carcass characteristics of wethers used in the feeding trial ... 23 Table 3.1 Chemical composition of the diets used in the feeding trial ... 30 Table 3.2 Blood plasma concentration of glucose, NEFA and TG at arterial and
portal vein in growing wether lambs fed forage based diets... 33 Table 3.3 The EBW, portal plasma flow, absorption rate constant of nutrients and
available nutrient circulation in growing wether lambs fed forage based diets ... 35 Table 3.4 The bio-available nutrients flow in muscle tissue and adipose tissue ... 37 Table 3.5 Effect of forage based diets on N balance in wether lambs ... 39 Table 4.1 Chemical composition intake of experimental diets in whether sheep .... 46 Table 4.2 Primers used for real-time PCR ... 50
List of Figures
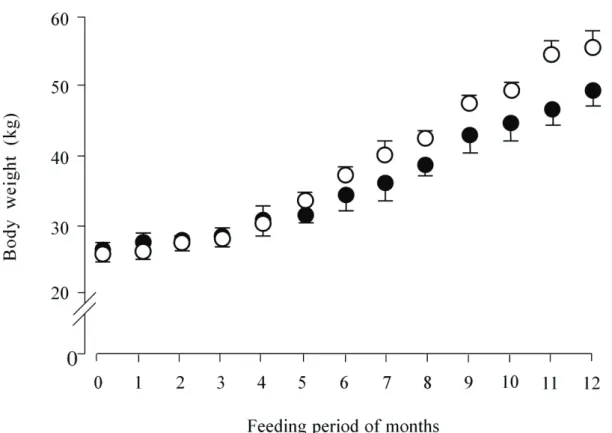
Figure 2.1 Body weight changes of wethers fed diet based on THD or IRD for 12 months of feeding period ... 15 Figure 4.1 Fat accumulation during adipocyte differentiation of preadipocytes
prepared from subcutaneous adipose tissues of sheep ... 52 Figure 4.2 The relationship between the six adipogenic genes and fat accumulation amount ... 54 Figure 4.3 Fat accumulation of preadipocytes treated with serum collected from
sheep fed different diets ... 56 Figure 4.4 The expression of six adipogenic genes mRNA of differentiated
adipocytes treated with serum collected from sheep in each of the different diets ... 58
List of Abbreviations
ADL Acid detergent lignin
ANOVA Analysis of variance
aP2 Fatty-acid-binding protein
BW Body weight
C/EBP CCAAT/enhancer binding protein
CP Crude protein
DCP Digestible crude protein
DG Daily gain
DM Dry matter
DNA Deoxyribonucleic acid
EBW Empty body weight
EE Ether extract
FBS Fetal bovine serum
GIT Gastro-intestinal tract
IR Italian ryegrass straw
IRD Italian ryegrass straw with concentrate diet
LBW Live body weight
MBN Microbial nitrogen
ME Metabolisable energy
MP Metabolizable protein
mRNA Messenger RNA
N Nitrogen
NDF Neutral detergent fiber
NEFA Nonesterified fatty acids
NFC Non fiber carbohydrates
OM Organic matter
PBS Phosphate-buffered saline
PCR Polymerase chain reaction
PPARγ Peroxisome proliferator-activated receptor gamma
RNA Ribonucleic acid
SCD Stearoyl-CoA desaturase
TDN Total digestible nutrients
TG Triglycerid
TH Timothy hay
THD Timothy hay with concentrate diet
Acknowledgements
First and foremost I would like to give my appreciation to Toshiyoshi Ichinohe Professor, Sang-houn Song assistant professor and Eiji Hosoi associate professor for provides an opportunity to complete my Ph.D. thesis at the Tottori University, Japan.
Especially, I thank to my advisor Prof. Toshiyoshi Ichinohe, because his moral support and guidance made the possible to complete my thesis successfully. He has been actively involved in my work and advised me in all academic and human sides.
I am very grateful for his patience, motivation, enthusiasm, and immense knowledge of nutrition physiology of ruminant and he is a great mentor to me in going to the road as a scholar. I express my reverential thanks to assistant professor Sang Houn Song for encouraging my research work in a part of cell culture experiment such as adipocyte differentiation and for allowing me to grow as a research scientist and helped me to adapt my life at Japan when I started to studying in abroad.
I would like to express my deepest sense of gratitude to associate professor Eiji Hosoi, who offered his continuous advice and encouragement throughout the Ph.D. course at this university. I thank him for the systematic guidance and great effort to try to train me in the scientific field.
I am deeply grateful to Professor Chul Ju Yang for him continued support in my academic career since the undergraduate course. His encouragement, advice, criticisms, and understanding kept me going not only for three years of Ph.D. but also six years of undergraduate and master’s course. His profoundly optimistic attitude to research has encouraged me.
I’d also like to give a heartfelt, special thanks to Dr. Ki Choon Choi. His patience, flexibility, genuine caring and concern, and faith me during the
dissertation process was enabled me while I obtained my Ph.D. degree. I thank him for advice and opinions on experiment related issues. Like a charm! And I have met good persons, Professor Toshiyoshi Ichinohe and assistant professor Sang-houn Song, and got a Ph.D. degree for their help. So I believe that I am a very happy and lucky person.
I’d like to thank present and past members of the lab: Yuuya Wada, Kouji Miyazaki, Yuuna Hiraishi, Ayaka Okada, Haruna Ootani, Marina Sakamoto, Miki Miyaoka, Nagisa Okabe, Shingo Kinoshita, Sumireko Yamaoka, Takuya Matsumoto and Tetsuya Tsuku having a good time, providing a great work environment, helps and chats. I am very grateful for meeting lab members and thank them because I learned many interesting Japanese cultures, even though my life in Japan was short, my academic life in Japan is very good.
Of course, no acknowledgments would be complete without giving thanks to my family. First I express a sense of gratitude and love to my parents: Pyoung Il Kim and Yang Il Park, elder sister: Ji Hye and the younger brother: Gi Ryong. They have instilled many admirable qualities in me and given me a good foundation for my life. They’ve taught me about hard work and self-respect, about persistence and how to be independent. Especially, parents were a great role model of resilience, strength, and character. They have always expressed how much they proud me and how much they love me. I am always proud of them and love them very much.
Finally, I take this opportunity to express the profound gratitude from my deep heart to my beloved friends: Ha Nui Im, Jin Hwa Kim, Seol Ae Lee and Su Yeon Park for their love and continuous support during Ph.D course
From the bottom of my heart, thank you.
Declaration
I hereby declare that this thesis is my original work and it has not been presented for the award of any degree elsewhere. All sources of information have been duly acknowledged by means of references.
Copyright©2016 by Da Hye Kim
CHAPTER ONE
General Introduction
1.1 Background Information
Forage is the most important feed to provide a variety of nutrients and fed as a basal diet for ruminant animals. Feeding program has been developed to achieve the most effective productions performance of ruminant with having an appropriate balancing feed ingredients and nutrients composition at the least cost (Chaudhry 2008). In general, evaluation of chemical composition of forage is essential for the nutritive value.
As compared to the nutritive value of diets, feeding value has more valuable meanings for developing animal feeding regimen and agronomic practice. The feeding values of feed allowed to meat producing animal were measured by an amount of feed intake, digestibility, weight gain, feed efficiency and carcass characteristics in a long term period of feeding the animal (Andersen et al. 2005).
However, a large scale in vivo feeding trial to evaluate the feeding value of forages is hard to carry out because of time needed to accomplish, labor to do and its cost.
Conversely, researchers have developed in vitro digestion technique as an alternative to laborious or time consuming in vivo digestion trial (Goering and Van Soest 1970; Menke and Steingass 1988; Hall and Mertens 2012). A number of in vitro analysis have been developed to predict DM digestibility (Tilley and Terry 1963), gas production (Close and Menke 1986) or the artificial fibre bag technique (Erwin and Elliston 1959; Johnson 1966; Rodriguez 1968). Likewise for the in vitro digestion technique which enabled to determine feed nutritive value at laboratory level to some extent, simple and rapid measurement to evaluate feeding value of diets with accuracy are required in livestock production section.
Blood metabolite concentrations represent an integrated index of the adequacy of nutrient supply in relation to nutrient utilization (Cronjé and Pambu 1996). Therefore, researchers have analyzed the blood metabolites to determine the
nutritional status in conjunction with the feeding trial. If a novel method for predicting the feeding value of the specific diet by utilizing in vitro cell culture system with applying blood serum (ie. cell culture substrate), obtained from animal fed with a diet the feeding value of which is being evaluated, is established and applicable to use feed evaluation, it can be used as an alternative to the conventional in vivo feeding study and would also be expected to considerably contribute to rapid development of a series of feeding regimens even though the results displayed by the in vitro method should not be thought to be quantitative but qualitative. There is little information available about feeding value assessment by using in vitro cell culture technique which aiming carcass quality evaluation. Thus, a novel method for in vitro feed evaluation system was tried to develop in this study with concomitant conventional in vivo feeding value evaluation and quantitative nutrients flow to body tissue of sheep fed on tested diets.
1.2 General Objective
The objective of this experiment was to develop a simple and rapid method for forage feeding value using blood serum in in vitro adipocytes culture to determine bio-available nutrients supply to body tissue which closely relating animal production in wethers.
1.3 Specific Objectives
Three experiments were designed as followings:
1. The first study was to evaluate the effects of grass forage species and long- term period of low quality forage diet feeding on growth performance,
nutrient utilization, microbial nitrogen yield and carcass characteristics in growing wether lambs (Chapter2).
2. The second study was to estimate the relationship between nutrient supply to muscle and adipose tissues and nitrogen retention in growing wethers fed forage-based diets (Chapter3).
3. The final experiment was conducted to assess the effects of circulation materials in the blood of sheep fed forage-based diet on adipogenesis of ovine adipocytes for developing new feeding strategies to improve animal performance (Chapter4).
The general conclusion of the three experiments and relevant discussion were described in Chapter 5.
CHAPTER TWO
Effects of Grass Forage Species and Long-Term Period of Low
Quality Forage Diet Feeding on Growth Performance, Nutrient
Utilization, Microbial Nitrogen Yield and Carcass Characteristics in
Growing Wethers
2.1 Summary
Six growing wether lambs were used to evaluate feeding values of two forage-based diets for 12 months period of feeding trial with measuring BW gain, nutrients digestibilities, N retention and MBN yield and carcass characteristics of the animals slaughtered at the conclusion of the feeding trial. The basal forage of each diet was offered at 2% BW as DM basis, and concentrate was fed at 40% of forage intake as fed basis. The BW gain averaged 25.3 to 55.3 kg and 28.5 to 48.7 kg for THD and IRD, respectively. Feed efficiency was significantly greater for THD than for IRD.
Digestion coefficients of OM and NFC did not differ significantly between diets or period, while CP and EE digestibility were slightly but significantly higher for THD than for IRD. The DCP intake was significantly greater for THD than for IRD, while NFC intake was significantly greater for IRD than for THD. Although N intake was significantly greater for THD than for IRD, ratio of retained N to absorbed N showed tendency toward significance for IRD as compared to THD.
Neither diets nor period had significant effect on MBN supply and efficiency of ruminal MBN synthesis. The EBW and carcass weight were greater for THD than IRD. The lean meat weight was numerically greater for THD as compared to IRD, and the weight of subcutaneous fat and abdominal fat, their weight ratio to EBW were also markedly greater for THD than those for IRD. The results of this study indicated that THD feeding displayed superior growth performance of growing lambs during the 12 months of feeding period and digestible N supply as compared to IRD, but long term period of THD feeding tended to deposit adipose tissue at higher ratio to EBW as compared to IRD. It is also suggested that the relatively higher N assimilation ratio of wether lambs fed with IRD than that fed with THD might have associated with the observed comparable dressing ratio and lean meat ratio to EBW.
2.2 Introduction
Forage based diets are conventionally used for small ruminant feeding for both growing and fattening periods in many parts of the world. Therefore, the feeding program has been developed to achieve the most efficient production performance with consideration of ruminant species (cattle, sheep or goats), breed, production purpose (dairy, hair or meat) and physiological stage of growth or production.
Evaluation of chemical composition and nutrients digestibility are essential for assessing the nutritive value of forage diet, but it is not sufficient for demonstrating the feeding value applicable for agronomic practice level. To evaluate a feeding value of animal feed, measurement of amount of feed intake, ease of feed availability or preparation and production performance when fed to the animal should be required in addition to nutritive value score. Regarding the items of feeding value assessment, determination of BW gain and carcass characteristics are thought to be the most important for feeding a meat producing animal. However, it is time consuming and laborious and inaccessible for most field laboratories as well as raise the concerns about animal welfare (Adesogan 2002; Huhtanen et al. 2006).
By using recent feeding standards, nutrients and ME requirements to meet various production levels can be estimated accurately in feeding practices. Moreover, MBN syntheses in the rumen and its supply to the small intestine have been evaluated quantitatively to estimate MP supply to ruminant animals (ARC 1984; AFRC 1993).
Ichinohe and Fujihara (2008) suggested that lengthening feeding duration over 30 days might cause ameliorative changes in utilization of both ME and MP, and improvement in MBN synthesis when fed diets having low ruminal degradation synchronicity between OM and N to adult rams at a maintenance level of feeding.
Their result might indicate an occurrence of some adaptive response of rumen
fermentation and N utilization with continual feeding of a diet formulated to have an asynchronous degradation of OM and N within a daily feeding regimen by both rumen microbes and host animal. Hovell et al. (1983) and Chowdhury et al. (1995) reported that N accretion rate and ME utilization of lambs varied clearly when responding to the fluctuation of intra-gastric nutrient infusion levels, and suggested a metabolic modulation responding to changes in nutrients supply by the growing ruminant. Recently, effects of diet, level of feeding, supplements feeding, rumen degradation synchronicity and forage quality on MBN supply from the rumen have been reviewed by Dewhurst et al. (2000). However, in their review, the effect of feeding duration of diet on ruminal MBN synthesis with relevant to feed quality was not well addressed. There is still insufficient information available to identify the adaptation response to diets, differing in their nutritive value, along with feeding duration at various physiological stages of ruminant animals (Delavaud et al. 2007). It was expected that the rumen fermentation characteristics, utilization of ruminal fermentation substances by host animal, ruminal MBN yield and MP utilization efficiency for production would change with age of ruminants and also lengthening feeding period of low quality diet; hence, the combination of both microbial and metabolic adaptation by host animal might lead to ameliorating of low quality forage diet by growing ruminant.
The knowledge of feeding values assessed by in vivo trail including carcass characteristics evaluation, dietary adaptation status of ruminal fermentation and host animal metabolism during a long term period feeding of forage diet and a mechanism by which dietary adaptation will be applicable to establish feeding regimen for meat producing growing ruminant. Therefore, the present study was conducted to evaluate the effects of forage species of basal diet and 12 months of long-term feeding period on BW gain, nutrients digestibility, N balance, MBN supply and carcass
characteristics of animal slaughtered at the conclusion of 12 months of feeding in wethers. Italian ryegrass (Lolium multiflorum Lam.) is being utilized as a major domestic forage source for ruminant production practice in Korea. Two typical cool season grass forage, TH and IR, were chosen as basal diets because they are commonly used in Korea and also Japan.
2.3 Materials and Methods
Animal experiment described in this Chapter was conducted at Shimane University from August 2013 to August 2014. Use and animal care procedures were approved by Animal Care Committee of Shimane University.
2.3.1 Animals and diets
Six spring born (February or March) Suffolk wether lambs, initial mean BW of 26.4±0.7 kg, were used in this study. They were purchased from a commercial sheep farm at 4 to 5 months of age in July, 2013. All lambs were dewormed prior to use in the study. The animals were randomly divided into two groups (n = 3, each group) to be similar mean BW (26.1 vs. 26.7 kg), and were allocated to one of two dietary treatments for 12 months of feeding period. Except for metabolism trials by total collection, the animals were housed in well-ventilated pens under continuous lighting and had free access to water and mineral blocks during the feeding experiment.
Imported TH and IR from USA were purchased and used as basal diets. Due to the forage storage space at the animal farm of Shimane University, different lots of imported TH and IR had to use in this study (Table 2.1). The forages were coarsely chopped using an electric forage chopper to about 4 cm in length. Both of the forages were offered to the six wether lambs ad libitum in a change-over design to determine voluntary feed intake of TH and IR for at 7 day period, respectively. The
le 2.1 Chemical composition of feed offered wether lambs for 12 months of feeding period ifferent lots of imported timothy hay (TH) were used. Chemical compositions of TH fed to animals from the beginning of experiment (0–2), from 3 to 8 months (3–8) and at 9 to 12 months (9–12) were listed as a dry matter basis (in %). ifferent lots of imported Italian ryegrass straw (IR) were used. Chemical compositions of IR fed to animals from the beginning of riment to 4 months (0–4), from 5 to 8 months (5–8) and at 9 to 12 months (9–12) were listed as a dry matter basis (in %). lculated as 100䠉(crude ash + crude protein + ether extract + neutral detergent fiber).
Item TH†IR‡ Concentrate 0–2 3–8 9–12 0–4 5–8 9–12 OM 93.293.492.593.8 95.295.3 93.1 CP 6.38.47.45.9 6.44.7 22.0 EE 1.72.42.01.7 2.01.2 4.5 NDF 67.865.866.067.0 68.566.7 24.8 ADL 7.16.36.35.4 6.53.8 1.2 NFC§ 17.416.817.119.2 18.322.7 41.8
determinations of voluntary feed intake of the forages were carried out during 14 day of preliminary period which was set before the commencement of the 12 months period of the feeding study. The voluntary feed intake for TH and IR were determined under group-housed condition (three heads per pen), and the measured values were used to formulate the feeding regimen for the feeding study. Following the 14 days of preliminary period, the animals were kept in individual pens, and fed THD or IRD for 12 months. With both group animals, TH or IR were allowed at 2% BW (as DM basis) and amount of concentrate allowance was set at 40% of forage intake (as fed basis).
The animals were fed two equal sized meals at 09.00 and 16.00 hours throughout the experiment. The quantity of concentrate allowance was adjusted daily according to the previous day’s forage intake for each animal. In feeding each meal, the forage was supplied in the feed trough after completing concentrate consumption. The THD and IRD were designed to satisfy ME requirements for 100 g DG with a provision of 5%
safety margin based on the estimation equations by the AFRC (1993) using the tabular values listed in Standard Tables of Feed Composition in Japan (NARO 2009), TDN concentration of commercial concentrate and voluntary feed intake of TH and IR. Chemical compositions of TH, IR and commercial concentrate are listed in Table 2.1.
2.3.2 Experimental procedures and measurements
Feeding period of both THD and IRD lasted for 12 months, and during which, 5 days of metabolism trials were conducted six times using the six wether lambs at 2 (October 2013), 3 (November 2013), 5 (January 2014), 7 (March 2014) , 9 (May 2014) and 11 (July 2014) months of the experiment period. The BW measurement was conducted weekly at 13.00 hours for each animal throughout the experimental
period. Based on the BW of the animals, ME requirement and feed provision level to each animal were calculated weekly. Feed refusals were weighed and recorded daily for each animal throughout the feeding experiment. During the metabolism trials, animals were transferred from pens and were kept in metabolism crates in a temperature controlled room (20°C) under continuous lighting, and total collections of feces and urine were conducted. Total urine was collected for estimating urinary N excretion and MBN supply to the small intestine. Urine was collected into the container containing 50 mL of 10% (v/v) H2SO4 to keep urine pH below 3.
Representative samples of feeds, orts, feces and urine were obtained daily during the total collection period.
At the end of 12 months period of the feeding trial, 17 to 18 months old of two wethers were chosen from each diet feeding group and slaughtered to evaluate carcass characteristics. The day before slaughtering, feed was withheld overnight with free access to water. After slaughter, weight of head with tongue, feet, skin with hair, blood, trachea, heart, lung, liver spleen, kidney, GIT and GIT contents, abdominal and subcutaneous fat, lean meat, longissimus and born were recorded for slaughter and carcass evaluation. Carcass and non-carcass components were weighed immediately after slaughter. The EBW was calculated by subtracting the weight of GIT contents from LBW weighed at the slaughter. Dressing percentage was calculated as percentage of carcass weight to LBW or EBW.
2.3.3 Chemical analyses
The fecal samples were dried in a forced air oven at 60oC for more than 48 h.
Samples of air dried feces, feeds and orts were ground to pass through a 1 mm screen. Samples of feeds, orts and feces were determined for OM, CP, EE by AOAC
1984). The NDF and ADL were determined by the procedure of Van Soest et al.
(1991). Urinary N concentration was determined by Kjeldhal method. The daily excretion of purine derivatives (PD) was determined by a colorimetric method according to Fujihara et al. (1987) and the MBN supply to the small intestine (g/d) was estimated based on the urinary PD as an indicator of intestinal absorbed MBN (Chen and Gomes 1995).
2.3.4 Statistical analysis
Data were analyzed by a two-way repeated measures analysis of variance (ANOVA) to evaluate the effects of diets and feeding period on feed intake, DG, digestibility, N retention, ruminal MBN yield and plasma metabolites concentration. Data for daily feed intake and DG were summarized as mean values for each month of the feeding period. The measured variables in the metabolism trial carried out at 6 months of the feeding period and measurements of feed intake and DG at 12 months were considered as repeated observations on each block. The general linear model included diets, feeding periods and diet × period interaction as fixed effects, where animal within the dietary treatments was specified as a random effect. Effects were deemed to be statistically significant when P ≤ 0.05, and tendencies were considered to exist when 0.05 < P ≤ 0.10. When feeding period effect was detected by ANOVA, differences between the means were separated using Duncan’s multiple range test. All statistical procedures were performed using SPSS 14.0 (SPSS 2006).
2.4 Results and Discussion 2.4.1 Diet characteristics
There were slight variations in the diets chemical compositions due to the difference
in import lots from the USA for both forages (Table 2.1). The CP concentration (DM basis) ranged from 6.3 to 8.4% for TH and from 4.7 to 6.4% for IR. The mean value of CP concentration of the three lots of TH and IR seemed to be similar to the tabular values of imported hay listed in Standard Tables of Feed Composition in Japan (NARO 2009), although the CP concentration of IR fed from 9–12 months was quite lower compared to the tabular value of 6.2% DM (NARO 2009). The NDF concentration of TH and IR were almost similar to the tabled values (NARO 2009).
The extent of fiber lignification (ADL/NDF, in %), which indirectly indicated physical coarseness and also rate and extent of ruminal fiber degradability (Ichinohe et al. 1994), averaged 9.9% and 7.7% for TH and IR, respectively, and the value appeared to be lower for IR than that for TH. The commercial concentrate used in this study was more than 70% of TDN concentration for feeding growing beef cattle.
2.4.2 Growth performance and feed intake
The BW of wether lambs fed each diet increased in a linear curve with advancing feeding months and exhibiting a logistic growth pattern (Figure 2.1), and BW changed from 25.3 to 55.3 kg and 28.5 to 48.7 kg for THD and IRD, respectively. Animals were allotted to the two diet groups to yield the similar mean BW, although at the conclusion of the 14 days voluntary feed intake measurement of the basal forages during July in confinement conditions led to the observed difference in BW between the groups. Hence, there was BW difference between the groups at the beginning of the feeding study (P > 0.05). Both of the diets were fed to the animals to achieve 100 g DG through the experimental period, however, the months of the feeding period at which animals reached the targeted value was at 7 months onward and 9 months onward for THD and IRD, respectively (Table 2.2). The average DG throughout the
Figure 2.1 Body weight changes of wethers fed diet based on THD or IRD for 12 months of feeding period. ○, means of growing wethers fed THD; ●, means of growing wethers fed IRD. Each symbol with vertical bar shows mean value with the standard deviation. Body weight were measured every week, and summarized as mean value for a month of feeding period for each diet.
12 months period did not reached the targeted value, and was calculated as 60.1 and 81.7 g/d for IRD and THD, respectively, and was significantly higher for THD than for IRD. Both of the forage intakes (g DM/d) increased according to BW gain through the feeding period, and both variables (g DM/d and % BW) appeared to be greater for IR than for TH from 1 to 7 months. In this experiment, feed particle size of machinery-chopped forages seemed to be smaller for IR than that for TH. Even though we did not determine the feed particle size distribution and eating behavior of the animals, it appeared that the difference in physical properties of forages might contribute to the feed acceptability, ease of bolus formation for deglutition in eating (Ichinohe et al. 1994; Ueda et al. 1997, 2001) and hence might be thought to influence eating rates of growing lambs, which might partly explain the reason that lambs ate IR more than TH. The difference in consumption variables of TH and IR did not agree with the study by Assefa and Ledin (2001), in which they indicated that animals ate more high CP concentration forage than lower CP forage. Animals consumed offered concentrate thoroughly during the experimental period. Concentrate intake did not differ between the diets and significantly increased with advancing feeding period.
Feed efficiency varied between months of the observation for both diets, and was statistically higher for THD than for IRD with the value at 9 months being greatest for both diets. In the current study, the significant lower values of BW gain for IRD thanfor THD from 1 to 7 months of period have resulted in significant dietary difference.
2.4.3 Apparent digestibility and nutrients intake
The apparent digestibility for OM, NDF and NFC did not differ significantly between the diets, although CP and EE digestibility were 3 percent point higher for THD than
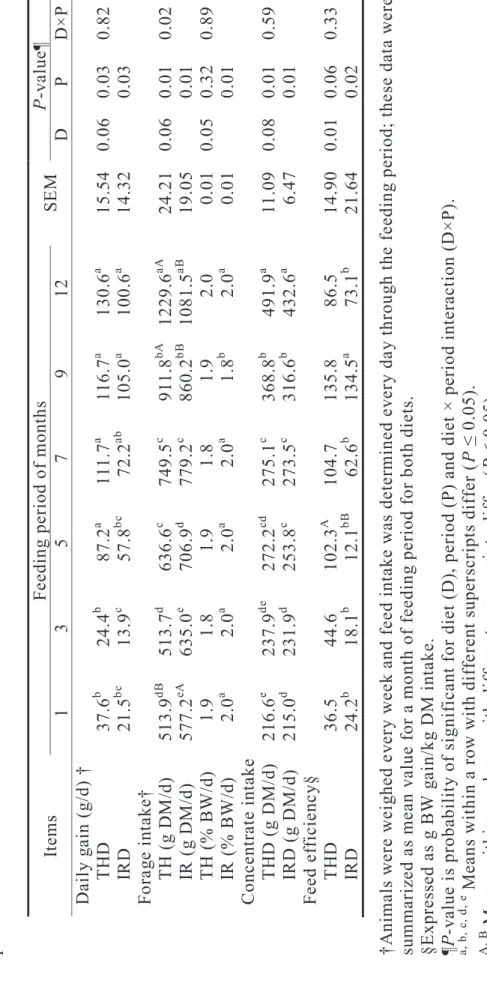
Table 2.2 Body weight gain, feed intake and feed efficiency in wether lambs fed forage based diets for 12 months of feeding period †Animals were weighed every week and feed intake was determined every day through the feeding period; these data were summarized as mean value for a month of feeding period for both diets. §Expressed as g BW gain/kg DM intake. ¶P-value is probability of significant for diet (D), period (P) and diet × period interaction (D×P). a, b, c, d, e Means within a row with different superscripts differ (P ≤ 0.05). A, B Means within a column with different superscripts differ (P ≤ 0.05).
ItemsFeeding period of months SEMP-value¶ 1 3 5 7 9 12 D P D×P Daily gain (g/d) † THD37.6b 24.4b 87.2a 111.7a 116.7a 130.6a 15.540.060.030.82 IRD 21.5bc 13.9c 57.8bc 72.2ab 105.0a 100.6a 14.320.03 Forage intake† TH (g DM/d) 513.9dB 513.7d 636.6c 749.5c 911.8bA 1229.6aA 24.210.060.010.02 IR (g DM/d) 577.2eA 635.0e 706.9d 779.2c 860.2bB 1081.5aB 19.050.01 TH (% BW/d) 1.91.81.91.81.92.00.010.050.320.89 IR (% BW/d) 2.0a 2.0a 2.0a 2.0a 1.8b 2.0a 0.010.01 Concentrate intake THD (g DM/d) 216.6e 237.9de 272.2cd 275.1c 368.8b 491.9a 11.090.080.010.59 IRD (g DM/d) 215.0d 231.9d 253.8c 273.5c 316.6b 432.6a 6.470.01 Feed efficiency§ THD36.544.6102.3A 104.7135.886.5 14.900.010.060.33 IRD24.2b 18.1b 12.1bB 62.6b 134.5a 73.1b 21.640.02
for IRD (Table 2.3). The effect of feeding period was not detected for digestion coefficients for both diets. The diet × period interaction reached significant levels for digestion coefficient of OM, EE and NDF. The CP concentration of ingested feed (% of DM, data not shown in Table 2.3) for THD and IRD during the 12 months of feeding period was estimated to be 12.0% and 10.5% DM (P > 0.1) on average, respectively. The DCP intake (g/BW0.75) was significantly greater for THD than for IRD with response to the si gnificantl y hi gher CP di ge stibilit y. Moreo ver , the lo wer C P concentration of IR offered to animals from 9–11 months (Table 2.1) may be one of the reasons for causing the interaction. Since Loy et al. (2002) indicated that energy provision was the first limiting factor to nursing growing ruminants fed with low–quality forage diet, THD and IRD were designed to suffice ME requirements for 100 g of DG (AFRC 1993) without taking into account rumen degradable N (RDN) requirements (ARC 1980, 1984) or MP requirements (AFRC 1993) in the current study. Reflecting the feeding regimen of this study, neither diets nor feeding period had significant effect on ME intake (MJ/BW0.75), and the value was kept around 0.7 for both diets and throughout the feeding periods. The ratio of ME intake to ME requirement of 100 g DG (AFRC 1993) was estimated to be range from 0.86 to 0.96 for THD and from 0.85 to 0.96 for IRD, suggesting estimated ME intake almost met the recommendation by AFRC (1993) for both diets.
However, the reason for lacking BW gain response to ME sufficiency, observed from 1 to 3 months, was not found in the current study. The NFC intake (g/BW0.75/d) was significantly greater for IRD than for THD, and
Table 2.3 Apparent digestibility and intakes of digestible CP, ME and NFC in wether lambs fed forage based diets for 12 months of feeding period §Estimated using the value of total digestible nutrients intake. b, c Means within a row with different superscripts differ (P≤ 0.05).
Items Diet SEM Feeding period (months) SEM P-value THDIRD2 3 5 7 9 11D P D×P Digestibility (%) OM64.8 63.4 0.97 62.3 64.0 63.2 65.4 64.7 64.7 2.15 0.32 0.37 0.01 CP67.8 64.2 1.11 63.1 65.7 67.2 67.4 65.6 67.0 2.08 0.03 0.21 0.12 EE72.1 69.0 0.85 69.7 68.6 70.5 72.1 71.2 71.2 1.86 0.01 0.24 0.01 NDF 54.6 53.1 1.14 52.1 54.3 52.0 53.6 55.7 55.5 2.79 0.35 0.41 0.01 NFC86.6 85.3 0.68 85.3 85.4 85.8 90.2 83.1 86.0 1.29 0.17 0.21 0.09 DCP intake g/ BW0.75 /d5.6 5.0 0.09 5.1bc 4.7c 5.6ab 5.4b 5.3b 5.8a 2.02 0.01 0.01 0.01 ME intake§ MJ/BW0.75 /d0.7 0.7 0.01 0.7 0.7 0.7 0.7 0.7 0.7 0.02 0.97 0.15 0.37 NFC intake g/ BW0.75 /d18.4 20.4 0.19 17.0c 16.5c 17.4c 17.1c 21.6b 26.9a 0.56 0.01 0.01 0.01
showed the effect of feeding period and diet × period interaction.
2.4.4 Nitrogen balance and MBN supply
Variables for N balance, MBN supply and efficiency of ruminal MBN synthesis were shown in Table 2.4. The N intake (g/BW0.75) was greater for THD than for IRD, and significant diet × period interaction were found. The greater urinary N excretion (g/BW0.75) was also found for THD than for IRD, and effect of feeding period and significant diet × period interaction were found. There were no dietary or period effects on N retention variables (g/BW0.75 and % of N intake). The two variables for N retention varied among the six observation periods for THD and IRD, ranging 0.3–0.6, 0.4–0.5
g/BW0.75 and 26.7–45.3, 29.6–44.1% of N intake, respectively, and the
difference in N retention variables between the diets and feeding period yielded significant or tendency toward significant for diet × period interaction, respectively. However, the numerically greater (P = 0.08) ratio of retained N to absorbed N for IRD (56.2%) than that for THD (49.7%) was prominent in the current study. The N retention variables observed in this study did not agree with the result by Ichinohe and Fujihara (2008) indicating an adaptive increase in N retention with advancing feeding period.
Neither diets nor feeding periods had significant effect on either MBN supply or efficiency of MBN synthesis. Ichinohe and Fujihara (2008) also reported an adaptive improvement in MBN supply with advancing feeding period, while the result of this experiment is contrasted to this. Although there was no period effect, MBN efficiency appeared to be numerically higher for
able 2.4 Nitrogen balance, microbial nitrogen supply and efficiency of microbial nitrogen synthesis in wether lambs fed rage based diets for 12 months of feeding period a Means within a row with different superscripts differ (P ≤ 0.05). ‡Rumen degradable organic matter intake㻌(ARC 1980).㻌 ItemsDiet SEMFeeding period (months) SEMP-value THDIRD2 3 5 7 9 11D P D×P N intake (g/BW0.75 /d) 1.31.20.021.2 1.2 1.3 1.3 1.3 1.30.040.010.340.03 Urinary N excretion (g/BW0.75 /d) 0.50.30.010.3b 0.4ab 0.4ab 0.4a 0.4ab 0.4ab 0.020.020.010.01 N retention (g/BW0.75 /d) 0.40.40.020.4 0.4 0.5 0.4 0.4 0.40.030.310.350.05 (% of N intake)33.835.81.5137.4 34.7 37.4 32.2 35.0 32.22.620.320.440.08 (% of absorbed N) 49.756.21.7058.8 52.5 55.6 47.7 53.6 49.52.930.080.500.05 MBN supply (g/BW0.75 /d) 0.80.60.060.8 0.9 0.8 0.6 0.4 0.60.100.550.500.40 MBN efficiency (g N/kg RDOM‡) 31.127.12.4534.0 38.9 36.0 25.6 18.6 22.11.250.620.400.49
the early stage of feeding period than those observed from 9 to 11 months and from 7 to 11 months for THD and IRD, respectively. These values from 7 to 11 months were relatively lower as compared with tabular values of the ARC (1984) for sheep fed hay supplemented with concentrate (30.8±7.1 g MBN/d of rumen degraded OM (RDOM) intake). The value of g MBN/kg RDOM at 7 and 9 months for THD was calculated to be 16.4 and 23.5, respectively, and at 7, 9 and 11 months for IRD was calculated to be 20.7, 20.8 and 20.8, respectively.
The reasons for the depression of the efficiency of MBN synthesis for the late stage of the feeding period than those for the early stage were not clearly elucidated in the current study. However, it might be attributable to an asynchronous supply of RDN and ruminal fermentable energy in a daily feeding regimen (Sinclair et al. 1993), and also owing to lowered RDN and TDN supply or their imbalanced ratio (Bodine et al. 2001) at the late stage of the feeding period as compared to those at the early stage for both THD and IRD. Furthermore, Bruinenberg et al. (2004) reported that low CP diet lowered ruminal ammonia concentration, thus contributing less ammonia loss from the rumen due to an effective capture of ruminal N by rumen microbes.
2.4.5 Carcass characteristics of wethers in hogget production
Since two wethers were chosen for slaughter and carcass characteristics Berge et al. (1993) and Ponnampalam el al. (2002) reported that the dietary intake of protein and energy are not the only factors that control the protein and fat deposition in the carcass. This experiment is contrasted that MacRae and Lobely (1982) reported protein provided in excess in the diet would be
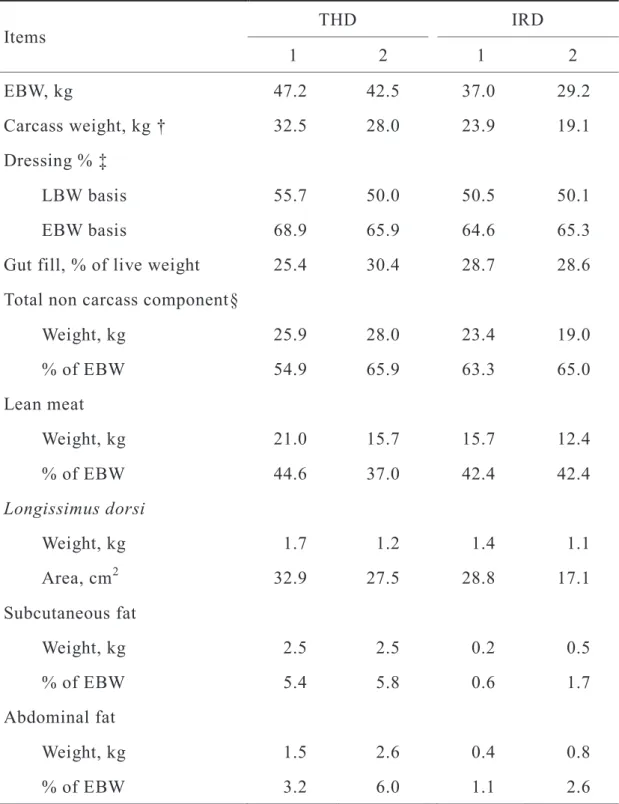
Table 2.5 Carcass characteristics of wethers used in the feeding trial
† Calculated as LBW – Total non carcass component
‡ Calculated as LBW basis, (Carcass weight / LBW) × 100; EBW basis, (Carcass weight / EBW) × 100
§ Calculated as blood + head + skin with hair + GIT + GIT contents + feet .
Items THD IRD
1 2 1 2
EBW, kg 47.2 42.5 37.0 29.2
Carcass weight, kg † 32.5 28.0 23.9 19.1 Dressing % ‡
LBW basis 55.7 50.0 50.5 50.1
EBW basis 68.9 65.9 64.6 65.3
Gut fill, % of live weight 25.4 30.4 28.7 28.6 Total non carcass component§
Weight, kg 25.9 28.0 23.4 19.0
% of EBW 54.9 65.9 63.3 65.0
Lean meat
Weight, kg 21.0 15.7 15.7 12.4
% of EBW 44.6 37.0 42.4 42.4
Longissimus dorsi
Weight, kg 1.7 1.2 1.4 1.1
Area, cm2 32.9 27.5 28.8 17.1
Subcutaneous fat
Weight, kg 2.5 2.5 0.2 0.5
% of EBW 5.4 5.8 0.6 1.7
Abdominal fat
Weight, kg 1.5 2.6 0.4 0.8
% of EBW 3.2 6.0 1.1 2.6
utilized for fat synthesis in the animals. Hence, the greater DCP provision for THD than for IRD might be partly associated with the observed increased adipose tissue deposit ratio to EBW in the current study.
The results obtained from feeding trial and slaughter trial indicated that THD feeding led higher growth performance (DG and feed efficiency) of growing wether lambs and greater DCP supply as compared to IRD, but long term period of feeding THD showed greater deposition of both subcutaneousfat and abdominal fat as compared to IRD. The two experimental diets were designed to be iso-energetic and were allowed to the animals at similar ME provision, however, the relatively higher N assimilation ratio (N retention per absorbed N) of wether lambs fed with IRD than that fed with THD might be associated with comparable dressing ratio and lean meat ratio to EBW. From the point of view of lean meat production, IRD can be used for basal diet for growing or finishing purpose as THD. Nevertheless, the reason for lacking BW gain response without mirroring ME sufficiency and N retention observed at early stage of growth of wether lambs are remained to be solved.
CHAPTER THREE
Relationship between Nutrient Supply to Muscle and Adipose Tissues
and N Retention in Growing Wethers on Forage Based Diets Fed
with Different Forage Sources
3.1 Summary
Effect of forage species comprising basal diets on concentrations of blood plasma metabolites and amount of energy yielding substances supply to both of muscle and adipose tissue concomitant with N retention were examined with three growing wethers formed carotid artery-skin loops and located indwelling catheters in the mesenteric vein and the hepatic portal vein. Wethers were offered two experimental diets (THD and IRD) as used in the animal experiment described in Chapter 2, for 11 days of period for each diet, in a one-way layout design. The experimental diets were designed and allowed to the animals to have 100 g of DG. The glucose concentration of blood plasma sampled at artery and portal vein were higher for THD than for IRD.
Available amount of TG in the tissues was estimated to be higher for IRD than for THD. The daily amount of glucose and fatty acid supplied to both muscle tissue and adipose tissue were numerically higher for THD than those for IRD without showing significant difference. The N retention did not differ markedly between the diets, reflecting the observed absence of significant differences between the diets in the amount of energy yielding substances supplied to the muscle tissues. The results suggest that the difference in amount of glucose delivered to muscle tissue might associate with N retention responses to the forage based diets in early growing stage of wether lambs.
3.2 Introduction
In Chapter 2, feeding value of both THD and IRD as growing and fattening diet to ruminant animal by long term in vivo study was discussed. The results obtained by the 12 months period of feeding trial and carcass characteristics evaluation showed that the greater intakes of dietary N or DCP for THD as compared to IRD did reflect neither N retention (% of intake N or digested N) (Kim et al. 2015) nor ratio of lean meat weight to EBW (Kim et al. 2014). Furthermore, greater values of weight ratio of adipose tissue to EBW were also evident for THD than for IRD feeding in hogget production performance of Suffolk wethers slaughtered at 17 or 18 months of age (Kim et al. 2014). The differences in N retention values and carcass characteristics between the two diets may be due to the differences in ME intake (Yan and Agnew 2004), differences in MP supply originating rumen microbes (Clark et al. 1992), amino acid sparing (Neale 1971; Neale and Waterlow 1974), gluconeogenesis from the ruminal propionic acid, and urea recycling into the rumen (Sands and Layton 2009). However, the effect of factors above mentioned was not cleared thoroughly in the previous studies (Kim et al. 2014; Kim et al. 2015). The plausible reason for the difference in carcass characteristics might be due to the difference in amount of nutrients absorbed though the GIT or delivered to the liver, rate and extant of nutrients processing in the hepatic tissue, which in turn, resulted in the difference in amount of available nutrients for the development and growth of adipocytes or muscle cells.
The quantification of energy yielding substances supplied to both of muscle and adipose tissue is needed to elucidate the difference in growth performance and carcass characteristics of wethers fed with THD and IRD as described in Chapter 2. In the previous study (Kim et al. 2015, Chapter 2), there were large difference in the DG value from 1 to 3 months of feeding period between the diets, and the value of these
periods for both diets were far below the targeted value (100 g DG) even though ME allowance for 100 g DG requirement was almost sufficed from 1 to 3 months of feeding period (sufficient ratio ranging from 80 to 116%). In this study, calculation of amount of nutrients supplied to both of muscle tissue and adipose tissue were carried out for elucidating the reason for the observed lower DG for IRD group than for THD from 1 to 3 months of feeding period, and for the difference in the ratio of adipose tissue to EBW between the diets. The objective of this experiment was to determine the effect of feeding forage based diets with differing forage species on blood plasma nutrients flow to muscle tissue and adipose tissue in relevant to N retention in wether lambs being early stage of growing period.
3.3 Materials and Methods
The animal experiment of this study was conducted at Shimane University from May to October 2014. Use and animal care procedures were approved by Animal Care Committee of Shimane University. Surgical preparation, post-surgical care and management were conducted in accordance with the guideline of the animal use regulation of Shimane University and also with the ‘Guide for the Care and Use of Agricultural Animals in Agricultural research and Teaching’ (Federation of Animal Science Societies, 1999).
3.3.1 Animals and diets
Three spring born (January to February 2014) Suffolk wethers, initial mean BW of 27.3 ± 2.3 kg, were used in this study. The animals were allocated to two dietary treatments at the age of 6 to 7 months. The animals were also kept individually in metabolism crates throughout the experimental period, and fed THD and IRD (Table
3.1) in a one-way layout design. Similar to the animal experiment described in Chapter 2 (Kim et al. 2014; Kim et al. 2015), the forages were allowed at 2% BW (as DM basis) and the amount of concentrate allowance was set at 40% of forage intake (as fed basis) for each animal. The diets were designed to satisfy ME requirements for 100 g daily gain with a provision of 5% safety margin based on the estimation equations by the AFRC (1993). The animals were fed two equal sized meals at 09.00 and 21.00 hours throughout the experiment.
The experimental animals were surgically prepared under general anesthesia for forming skin loops enclosing the right carotid artery and for locating indwelling catheters in the mesenteric vein and the hepatic portal vein at 3 months before the start of the experiment.
3.3.2 Experimental procedures
The animals were housed in an environment controlled room with air temperature being 23oC with free access to water throughout the experimental period. The experiment was carried out in two periods of 11 days, of which first 7 days for adaptation to the diet, followed by 3 days of metabolism trials and the one day of blood sample collections. During the metabolism trials, daily excretion of feces and urine were recorded for 3 consecutive days. Urine was collected into the container containing 50 mL of 10% (v/v) H2SO4 to keep urine pH below 3. Representative samples of feeds, orts, feces and urine were obtained daily during the total collection period. On d-11 of the experiment, continuous infusion of para-aminohippuric acid (PAH) solution (1% w/v) was conducted via the mesenteric vein as described by Ortigues et al. (1994). The blood samples at portal vein and artery were simultaneously collected into 10 mL heparinized syringes at every 60 min after
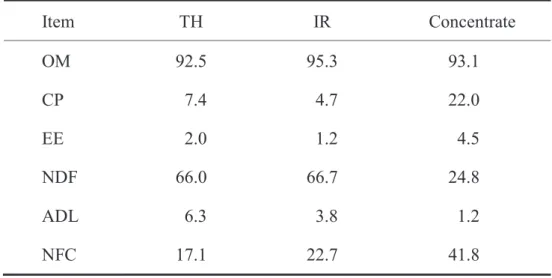
Table 3.1 Chemical compositions of the diets used in the feeding trial
Item TH IR Concentrate
OM 92.5 95.3 93.1
CP 7.4 4.7 22.0
EE 2.0 1.2 4.5
NDF 66.0 66.7 24.8
ADL 6.3 3.8 1.2
NFC 17.1 22.7 41.8
morning feeding. Total 12 sets of blood samples were immediately analyzed for hematocrit value. Whole blood samples were centrifuged for 15 min at 4oC, and the blood plasma samples were stored at –21oC until further analysis.
3.3.3 Chemical analyses
The samples of feeds, orts and feces were dried in a forced air oven at 60 oC for more than 48 h. Air dried samples were ground to pass through a 1 mm screen. The N in feeds and feces samples was determined by AOAC method (1984). Blood plasma concentrations of glucose, NEFA and TG were determined by commercial kits (Glucose C-test, NEFA C-test and TG E-test, Wako Pure Chemical Industries, Osaka, Japan) and PAH concentrations of blood plasma samples were determined by the method of Huntington (1982).
3.3.4 Calculations
Blood plasma flow rate was calculated using an indicator-dilution technique previously described by Katz and Bergman (1969). In the current study, one- compartmental pharmaco kinetics model (Oriuchi et al. 1995) was introduced to estimate the rate constant of nutrients absorption from the GIT and first stage nutrients elimination in the hepatic tissue. According to the graphical shape of the change in nutrients concentration of arterial blood plasma (glucose, NEFA and TG) postprandial time, analytical equation was generated based on the pharmacokinetics model. In this model, change in specific nutrients concentrations of arterial blood plasma post feeding (t, hr) can be described as:
Cnutr = [C࣭ka/(ka – kd)]×(e -kd×t – e -ka×t),
where Cnutr, nutrient concentration of arterial blood plasma; C, scale parameter; ka, rate constant of nutrients absorption though the small intestine (fraction per h) and kd, rate constant of nutrients disappearance at the hepatic tissue by the metabolism of first passage effect (fraction per h). In this model, assumptions, ka ≠ kd and ka > kd, were introduced for estimating the parameter relating nutrients absorption, hepatic tissue metabolism and supply to the body tissue. All curves fitted to estimate the parameters were performed using commercial software generated by Daniel G. (Curve Expert 1.4, http://curveexpert.net). The amount of bioavailable nutrients delivered to the tissues the weight of muscle and adipose tissue were calculated using allometric equations listed in by ARC (1980).
3.3.5 Statistical analysis
Effects were deemed to be statistically significant when P < 0.05. Data were analyzed by one-way ANOVA and differences between the means were separated using Duncan's multiple range test. All statistical procedures were performed using SPSS 14.0 (SPSS, 2006).
3.4 Results and Discussion
3.4.1 Concentrations of blood plasma metabolites
Blood metabolites are shown in Table 3.2. Blood plasma concentrations of all items investigated were higher for arterial blood than for portal vein blood except that of TG in IRD. Blood plasma concentration of glucose at arterial and portal vein was significantly higher for THD than for IRD. Sletmoen et al. (2000) has suggested that plasma glucose concentration was increased by degraded intake protein based
Table 3.2 Blood plasma concentration of glucose, NEFA and TG at arterial and portal vein in growing wether lambs fed forage based diets
The results are mean value of concentration of diurnal blood plasma.
Means within a row with different superscripts differ (P ≤ 0.05).
Items Diet
SEM P-value
THD IRD
Glucose concentration (mg/dL)
Arterial 80.2 73.9 1.05 0.01
Portal 79.1 72.6 1.05 0.01
NEFA concentration (μEq/L)
Arterial 258.0 252.3 12.66 0.70
Portal 139.4 184.8 19.38 0.08
TG concentration (mg/dL)
Arterial 17.2 17.5 4.34 0.99
Portal 16.9 18.7 5.34 0.24
supplements. However, other studies have shown no significant effect of protein supplementation on blood glucose in ruminants (Krysl et al. 1987; Cheema et al.
1991b). In the current study, the slightly difference in N intake between the diets (appeared in Table 3.5) did not affect blood plasma concentration of glucose, and agreed with the results of Krysl et al. (1987) and Cheema et al. (1991b). The plasma concentrations of NEFA of arterial blood did not differ significantly between the diets, although which of portal venous blood was tended to be higher for IRD than for THD (P = 0.08). Higher levels of NEFA at lower intake levels have been also reported in sheep by Hatfield et al. (1999) and indicate body fat mobilization to compensate for low energy intake. In current study, concentrations of low NEFA in blood plasma were decreased by the sufficient energy balance diets designed to satisfy metabolizable energy requirements for 100 g daily gain. Blood plasma concentrations of TG at arterial and portal vein did not differ significantly between the diets.
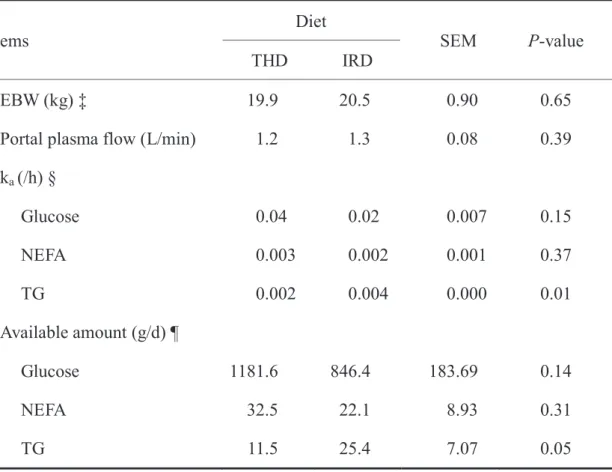
3.4.2 Plasma flows and nutrients supply to body tissues
The EBW, estimated portal plasma flow rate, absorption rate constant of energy yielding nutrients from the GIT and available nutrients circulations are shown in Table 3.3. The EBW and portal plasma flow rate (L/min) did not differ between the diets. The ka (fraction/h) variable of glucose and NEFA were not different significantly between the diets, and the ka for TG was significantly lower for THD than for IRD (P = 0.01). Additionally, available amount of glucose and NEFA were higher for THD than for IRD without showing significant differences between the diets. The available amount of TG was significantly higher for IRD than for THD (P=
0.05). The difference of basal forages might have resulted the changes in nutrients
Table 3.3 The EBW, portal plasma flow, absorption rate constant of nutrients and available nutrient circulation in growing wether lambs fed forage based diets
‡ Calculated as LBW × 0.75 (Kim et al. 2014)
§ka, rate constant of nutrients absorption at the small intestine (fraction/h)
¶ Available amount was calculated as portal plasma flow (L/d) × concentration of blood plasma (g/L) × ka × 24
Items Diet
SEM P-value
THD IRD
EBW (kg) ‡ 19.9 20.5 0.90 0.65
Portal plasma flow (L/min) 1.2 1.3 0.08 0.39 ka (/h) §
Glucose 0.04 0.02 0.007 0.15
NEFA 0.003 0.002 0.001 0.37
TG 0.002 0.004 0.000 0.01
Available amount (g/d) ¶
Glucose 1181.6 846.4 183.69 0.14
NEFA 32.5 22.1 8.93 0.31
TG 11.5 25.4 7.07 0.05
absorption rate constant at GIT and portal plasma flow rate.
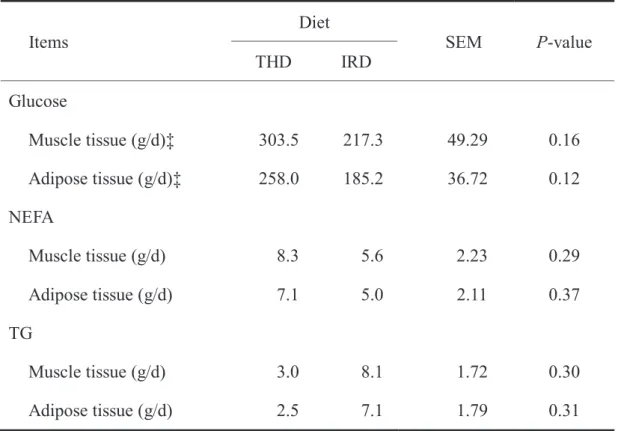
3.4.3 The proration of nutrients in the body
The daily amount of bioavailable nutrients supply to muscle tissue and adipose tissue in growing wethers were listed in Table 3.4. Bio-available glucose and NEFA supplied to both of tissues were numerically higher for THD than for IRD, however they did not reach the significant difference between the diets. In addition, the amount of TG showed no significant differences between the diets. As shown in our results, supplement of bio-available nutrients in forage diets showed no significantly different in both of muscle and adipose tissue of early stage of growing wether lambs. However, little is known that the roles of bio-available nutrients in the concentration of blood plasma were investigated in the in vivo model because of its very complex process. It was noteworthy that the estimated amount of glucose, NEFA and TG to muscle tissue and adipose tissue differed in numerically between THD and IRD, however, the tendencies toward statistical significance were not detected for all items.
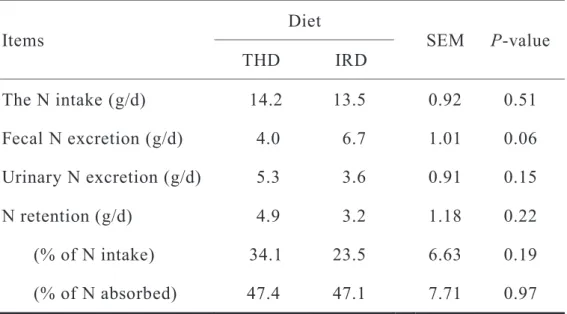
3.4.4 Effect of forage based diets feeding on N balance
The N balances in growing wethers fed with the two forage based diets are shown in Table 3.5. The N intake was slightly greater for THD than that for IRD without showing significant difference. Fecal N excretion tended to be higher for IRD than for THD. Hence, the N digestibility was calculated to be higher for THD than for IRD, and accounted for 71.4 and 50.5%, respectively. Urinary N excretion
Table 3.4 The bio-available nutrients flow in muscle tissue and adipose tissue
‡Muscle tissue, log10Protein mass = –0.6451 + 0.8955 × log10EBW; Adipose tissue, log10fat mass = –1.918 + 1.821 × log10EBW (ARC, 1980)
Items Diet
SEM P-value
THD IRD
Glucose
Muscle tissue (g/d)‡ 303.5 217.3 49.29 0.16 Adipose tissue (g/d)‡ 258.0 185.2 36.72 0.12 NEFA
Muscle tissue (g/d) 8.3 5.6 2.23 0.29
Adipose tissue (g/d) 7.1 5.0 2.11 0.37
TG
Muscle tissue (g/d) 3.0 8.1 1.72 0.30
Adipose tissue (g/d) 2.5 7.1 1.79 0.31
was numerically greater for THD than for IRD. The N retention (g/d) and its ratio to N intake were calculated to be numerically higher for THD than IRD (P = 0.22, 0.19). However, there were no significant differences between the diets when expressed as proportion to N absorbed (P = 0.97). In the present study, N intake, urinary N, N digestibility and N retention (% of N intake) all were increased in response to dietary CP concentration (Table 3.1). Swanson et al. (2000) and Cheema et al. (1991) reported that CP levels increased N intake, urinary N, N absorption and N retention, and Caton et al. (1988) showed increased N intake, urinary N and N retention in response to CP supplementation to diet. Other studied showed that the N retention increased with an increase in apparent digestible N intake in sheep (Sarraseca et al. 1998;
Lobley et al. 2000; Marini et al. 2004; Kamalzadeh and Shabani 2007). In addition, the ratio of N retention to apparent digestible N intake increased with an increase in apparent digestible N intake in 40–50 kg Suffolk wether sheep (Sarraseca et al. 1998). Taking into consideration of the results on N retention, it was suggested that the lack of prominent difference of energy yielding substances (glucose, NEFA and TG) supply to muscle tissue might have partly explained the comparable N assimilation (% of absorbed N) response of early growing stage of wether lambs observed in this study (Table 3.4, 3.5). In the current study, amount of bio-available glucose, NEFA and TG supply to both muscle tissue and adipose tissue were estimated by using one -compartmental pharmaco kinetics model and equations to predict mass of muscle or adipose tissue of growing sheep, and these values exhibited no significant differences between the diets. Our results showed that bio-available glucose supplement to muscle tissue was estimated to be numerically higher for THD than for IRD
Table 3.5 Effect of forage based diets on N balance in wether lambs
Items Diet
SEM P-value
THD IRD
The N intake (g/d) 14.2 13.5 0.92 0.51 Fecal N excretion (g/d) 4.0 6.7 1.01 0.06 Urinary N excretion (g/d) 5.3 3.6 0.91 0.15
N retention (g/d) 4.9 3.2 1.18 0.22
(% of N intake) 34.1 23.5 6.63 0.19
(% of N absorbed) 47.4 47.1 7.71 0.97
(P = 0.16) and which might to be thought to associate with the relatively greater N retention (g/d or % of N intake) for THD as compared to IRD.
The results obtained from the in vivo study described in this Chapter suggested that the observed lacking significant dietary difference in the amount of energy yielding substances which supplied to the muscle tissues might have reflected the identical rate of N retention (% of absorbed N from GIT) between the diets.
CHAPTER FOUR
Effects of Forage Based Diet on Adipogenesis of Ovine
Adipocytes
4.1 Summary
The objective of this study was to conduct an adipogenic evaluation of the effect of difference in forage sources and feeding levels during adipocyte differentiation of ruminant animal in in vitro assessment. Six wether sheep were divided into two dietary group of THD and IRD (n=3, each). Sheep serum samples collected on the last day of each dietary treatment adaptation period were added to an adipogenic induction medium for differentiation of preadipocytes which derived from subcutaneous adipose tissue of sheep used for this study. Three experimental treatments, fed HR, MR, and LR were designed and fed to sheep in a one-way layout design in which a 6-day period of feeding was made for each treatment. The cytoplasmic lipid accumulations in the THD serum-treated preadipocytes were significantly higher than those of the IRD serum-treated preadipocytes on day 12 of cell culture. The mRNA expression of C/EBPα, C/EBPβ, C/EBPδ, aP2 and SCD were regulated by each serum treatment. These results suggest that serum treatment culture method is able to elucidate the effects of circulation materials in the blood on adipocyte differentiation. Also, the results of this study show that different forage source of diets and forage to concentrate ratio diets can regulate adipogenic genes during adipocyte differentiation via ruminant blood.
4.2 Introduction
In the long term period of in vivo studies described in Chapter 2 and Chapter 3, both of nutritive value and feeding value of forage based diets (THD and IRD) were evaluated concomitantly with carcass characteristics evaluation for meat production performance. By the animal experiments aforementioned, the evidence of relationship between amount of energy yielding nutrients supply to both of muscle tissue and adipose tissue and N assimilation rate was shown to some extent be allowed. However, the in vivo feeding trials is time consuming and laborious measure, additionally it is costly to carry out. Although the in vivo feeding trial should be needed to show the actual feeding value to the animal, alternative method being relatively simple and rapidly is required to clarify the feeding value or novel functional property of tested diet as in situ nylon bag technique, in vitro digestion test or in vitro gas production test are now becoming as routine work for preceding in vivo feeding evaluation of diets (Blümmel and Ørskov 1993).
Soliman et al. (2007) and Dervishi et al. (2011) reported the method of forage evaluation using adipocyte, and they investigated the expression of some adipogenic, lipogenic genes and transcription factor using mRNA extracted from adipose tissue of slaughtered sheep fed with different types of forage diet for long term period. In the previous research (Arasu et al. 2014; Ilavenil et al.
2014), different concentration of forage extracts were treat on 3T3-L1 mouse preadipocytes to investigate expression of viability, lipid accumulation, lipolysis, cell cycle progression, and mRNA synthesis in the cells. However, it seemed not to be sufficient to detect a biological response for nutrient substance synthesis and degradation which being occurring in in vivo. The