Essential Traits for the Economics of Network and ICT: Theory and Practice
March 2014
Kazuma Kobayashi
A thesis for the Doctor in Economics
Essential Traits for the Economics of Network and ICT: Theory and Practice
March 2014
Graduate School of Economics Chuo University
Kazuma Kobayashi
Table of Contents
page
Introduction 1
1. Background: The Regulatory Issues and Discussions of Price in 1980’s 2
1.1 Background on Incentive 2
1.2 The Price-Cap: United Kingdom 2
1.2.1 The Historical Review 2
1.2.2 The RPI-X 4
1.2.3 The 1984-1991 Era 5
1.2.4 The 1991-1997 Era 6
1.2.5 The 1997-2002 Era 6
1.2.6 The 2002-2006 Era 7
1.2.7 The Market Circumstances realized by the Price-Cap 8
1.2.8 Remarks 11
1.3 The Rate of Return: United States 19
1.3.1 The Historical Review 19
1.3.2 The Review of the Averch-Johnson (A-J) Model 19
1.3.3 Remarks 21
1.4 Review of the Critical Changes in the Market Trends 22
1.4.1 Policy Oriented Market to Competition 22
1.4.2 Fixed Network to Mobile Network 23
1.4.3 Telephony Communication to Data Communication 27
1.4.4 Remarks 30
2. The Essential Traits 31
2.1 Network Effects 31
2.1.1 Compatibility 31
2.1.2 Critical Mass 33
2.1.3 Path Dependence 34
2.1.4 Remarks 35
2.2 Installed Base 36
2.2.1 Installed Base with an Old Technology and New Adopters with a New Technology 36
2.2.2 Switching Cost and Lock-in 37
2.2.3 The Remarks 38
2.3 Entry Deterrence 39
2.3.1 The Review 39
2.3.2 Local Loop Unbundling: the United States 39
2.3.3 Local Loop Unbundling: the OECD Countries 43
2.3.4 Remarks 44
3. The Incentive of Recent Practices in Telecommunications 45
3.1 Background 45
3.2 The Model 46
3.3 The Estimation 48
3.4 Remarks 54
4. Bit/Data Cap 55
4.1 The Data 55
4.2 The Model 57
4.2.1 The Normative Assumptions 57
4.2.2 The Simple OLS Model 58
4.2.3 The Basic Logit and Probit Models 59
4.3 The Estimations and Results 60
4.4 The Newer Data and Its Analysis 69
4.4.1 The model 71
ii
4.4.2 The Estimations and the Results 72
4.5 Remarks 75
Conclusion 76
Appendix A 78
Appendix B 80
References 82
Essential Traits for the Economics of Network and ICT:
Theory and Practice
Introduction
Recent rapid developments in technology seem to overcome boundaries in life, but the world is still governed by natural law as discussed in John Bates Clark (1915) and Leibowitz (2002). Technologies change the world seemingly at the speed more than we can feel it.
However, the telecommunications market tends to be a “captive market” that suppliers let customers in a certain circumstances, and customers must choose from the selection they offer like shops in an airport or a station after “checking-in”. In other words, they ask customers to accept additional or collateral conditions to use their main service. There is no choice for customers to arrange their own contracts freely according to their preference or usage.
This thesis analyzes the characteristics laying rapid developments in the ICT (Information and Communication Technology) industry, especially in the telecommunications market. For that purpose, we consider a cost incentive exploring characteristics in the contract between operator and customer, and the relationship with/between additional factors normatively and positively. The analysis shows how those “captive” attitudes affect the market and interact with influential and additional factors.
In chapter 1, we review a historical background of privatization and liberalization of the market in 1980’s, and clarify theoretical characteristics from earlier literature. Chapter 2 also reviews the characteristics of the market in the ICT era theoretically, and bridges the cost reduction incentive in earlier literature to the cost incentive in question. Chapter 3 analyzes empirically the incentive of practices implemented in the market taking those factors into account. Chapter 4 also analyzes recent telecommunications market empirically.
Above all, this thesis shows that the market that formerly considered as a structural issue now turns to a practical issue of the operators, and the incentive in the market affects competitive circumstances.
1. Background: The Regulatory Issues and Discussions of Price in 1980’s 1.1 Background on Incentive
Chapter 1 reviews the historical background on regulations for traditional telecommunications market. In its early stage, the market was mostly owned by the government and controlled by the regulation1. Therefore, as Joskow (1973a, 1973b) pointed out, what matters most was the “threshold” the regulatory agency set. This chapter also reviews the existence and its definition of the incentive in the traditional policy measures.
As for incentive, we follow the assumptions by Ramsey (1927) using the Pigou’s terminology that private and social net products are equal by the government interference not included in the taxation; we take the existence of the taxation a policy scheme or a contract in our case discussed later. In other words, the profit maximization implies cost minimization in the competitive market. We assume that the cost incentives exist in the difference between the outcomes of the objective functions caused by the existence of those schemes. The difference in the outcomes is an excess profit that may distort the competitiveness in the market.
As Baron and Myerson (1982) discussed, the historical policy measures in this chapter modify the market from the first best solution by implementing optimal regulation considering a socially expected goal. So we stand at the starting point to discuss here how the difference is realized under each schemes as following chapters. It is important to note that we have to clearly distinguish between effects come from competitive market and the excess profit come from factors seemingly outside the market.
Following sections review past policy tools to clarify its purpose, effects, and what caused those effects.
1.2 The Price-Cap: United Kingdom 1.2.1 The Historical Review
Here we overview the drift of the discussion until the Littlechild Report based on Beesley (1993, 1997). Fixed phone and postal services in the UK were operated by British Postal Office (BPO) until 1981. BPO had improved their equipment under restrictions set by British Ministry of Treasury. Beesley and Laidlaw (1993) pointed out and explained three
1 The review in this chapter is based on an earlier review, Kobayashi (2010).
2
points that showed the status in 1981; (1) poor quality of services, (2) delays to modernize national network, and (3) difficulty for customers in obtaining permission of the most recent equipment.
The BPO was responsible literally for postal and telecommunications, which had wide range of responsibilities. Therefore, the operator at that time did not pay attention to marketing and customer relations.
In modernization, ignoring demand on simple services and its equipment like answering machine caused poor quality in services. The digital switching equipment was also developed as a major national project, but they consequently procured the equipment from overseas and its introduction was delayed.
In 1980, Beesley, a professor of London Business School, proposed an assessment for liberalization of VANS (Value Added Network Services), and published the Beesley Report in January 1981, which allowed freeing resale and entry into the market to get more competitive.
Consequently, this report caused that the telephony tariff in local call went up and that in long distance lowered so called cross-subsidization.
In July, the 1981 legislation passed as the British Telecommunications Act 1981 and the divestiture between postal and telecommunications was accomplished. As a result, BT (British Telecommunications plc.) was established. At this point, BT had an exclusive privilege on public telecommunications services and a right to give permission to other operators. Therefore, control were overlapped by the government and BT. The government anticipated other operators to enter VANS, but there was no clear classification between fixed telephone services and VANS.
While the Littlechild Report proposed the price-cap regulation, the report referred to the rate-of-return regulation shown in section 1.3 and evaluated other possible regulatory schemes.
The report was written in 1983 for the Telecommunications Act. The purpose of the report at that time was to remove the BT’s privilege in section 12 of the 1981 Act, and to treat BT as the licensed private firm. Therefore, promoting competition by removing the privilege and offering services by other operators were expected by the Littlechild Report.
As a result, the 1984 Telecommunications Act passed, and liberalization spread to VANS. Interconnection was also allowed in 1985. Those events caused that BT had to concentrate on basic service like telephony. The independent regulatory agency Oftel (Office of Telecommunications) which was established in 1984 set the RPI-X formula to assess retail price of the charge. This regulation called the price-cap regulation. The charge was calculated by the
service price basket selected in advance by the agency. Operators allowed to set its price flexibly according to profitability within the range of the cap.
1.2.2 The RPI-X
An issue in the regulation is the one in setting the rate of “X”. The reason of setting the rate was never opened to the public, and the agency just explained that they concerned lots of factors on price. Table I-1 shows the changes in X. What the Littlechild Report concerned was the benefit of reducing local call charge. The idea was coming from a discussion of regulation for other area before liberalization. The RPI-X formula was applied to the monopolized service charge, and the agency tried not to raise its price over (RPI-X) %. As a result, the agency decided to set 3% in X, but the process of the decision was not open to the public.
However, in 1986, there was an argument that BT’s profit was excessive even under the regulation. The agency claimed it was appropriate, and the price was set below its upper limit for two years. In 1989, the agency changed the level of X from 3% to 4.5%. For fear of BT’s high profitability in international call, the basket included international call in 1990. The rate was changed to 6.25% in September 1991, and BT reduced their profits for the first time after privatization. Furthermore, the rate of X was reviewed according to phased increase of the rate of return in capital in 1993, and reviewed again to 7.5% until mid-1997.
After mid-1997, the rate of X was reduced to 4.5% for relaxation of the regulation toward its removal. The rate of 4.5% was expected to continue until 2001, but extended to mid- 2002. The cap was changed to RPI-RPI until May 2005, and changed again to RPI-0 after that.
To avoid rapid price increase caused by the removal, the agency confirmed competitiveness in telephony market and the regulation was removed in July in 20062. Following subsections explain what happened in each term according to the rate of X.
2For further its process, refer to BT’s Annual Reports 2006.
4
Table I-1 Changes in RPI-X Terms Effective RPI-X (%)
1984-1989 RPI-3
1989-1991 RPI-4.5
1991-1993 RPI-6.25
1993-1997 RPI-7.5
1997-2002 RPI-4.5
2002-2005 RPI-RPI
2005-2006 RPI-0
Source: Cave (1997), BT Annual Reports 1.2.3 The 1984-1991 Era
Since 1984, the market in the UK had been promoted competition by Oftel3. Until 1991, participants of the market which could operate national and international calls were the only two firms: BT and Mercury. This period was literally the era of duopoly.
During this era, Oftel decided interconnection conditions in October 1985, but conditions were asymmetric. Services offered by Mercury could provide through BT’s network, but agreements were needed to provide Mercury’s services to BT’s customers. Consequently, Mercury could open its way to gain customers in metropolitan area anyway. While Mercury’s local call charge was 20% less than that of BT’s, the charge of calls to areas outside London became higher than that of BT’s.
Therefore, Oftel had to consider Mercury’s access deficits 4 coming from interconnection fee, and made an effort not to charge it to customers. In other words, the interconnection fee became a burden for entrants unless charging it to customers. The interconnection rule was an important issue not only for competition but also cooperative actions in the market.
3 By the Communications Act 2003, the regulatory agency in the UK was reorganized to Ofcom.
4 Access deficit is the situation where the amount of the interconnection fee paid to the incumbents excesses that received by the entrants. The issue of the access deficit was discussed in Armstrong
1.2.4 The 1991-1997 Era
In the 1989 Review, the government changed the duopoly policy to competition to deal with issues faced in 1991. In November 1990, the UK government announced to start reviewing duopoly policy, and the review was formally published in March 1991 by Department of Trade and Industry. In the review, the UK government decided to end duopoly policy. They issued licenses to 150 new entrants at that time.
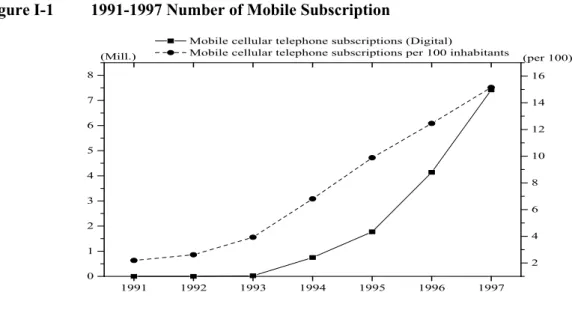
The main market in this era was still fixed telephony market. The number of subscribers increased rapidly because of the decline of retail price due to the cap. While this rapid growth, the mobile market started up in this era as shown in figure I-15. Developments in communications technology explored possibilities like VANS.
The mid-1990’s was a turning point for telecommunications industry in the UK. The diffusion of the Internet caused some increases in demand not only for telephony service but also communications services using computers as shown in figure I-2, I-3. Although its charging scheme was at a certain level of affordable rates, higher knowledge and skills were needed to use the Internet through user interface (UI). So, the difficulty prevented from diffusing the Internet6.
1.2.5 The 1997-2002 Era
In 1997, the rate of X was changed to 4.5% from 7.5%. Oftel released the status in October 2000, which stressed some improvements in competitiveness. But still BT kept at the level of 60-70% market share7. The fixed telephony market was allowed pre-selection services that customers could choose an operator in advance, and there is no need to push specific numbers to call from the operator chosen. This policy also fueled competition to gain new customers and switch operators.
Instead of existing ISDN (Integrated Services Digital Line) that communicates over PSTN (Public Switched Telephone Network), Operators introduced xDSL (Digital Subscriber Line) that uses residual bandwidth available in copper cables.
5All figures is this section are shown at the end of the section.
6At the same era, Microsoft introduced Windows 95 and made people easy to access to the internet using graphical user interface (GUI). This event exploded its demand to diffuse exponentially.
7Refer to Oftel annual Communications Market Report in the year 2000.
6
Unlike ISDN, xDSL made possible to charge at a flat rate because there was no technological limitation caused by the bandwidth. Few people subscribed to xDSL yet in this era, but the number of subscriptions grew rapidly in the next era.
1.2.6 The 2002-2006 Era
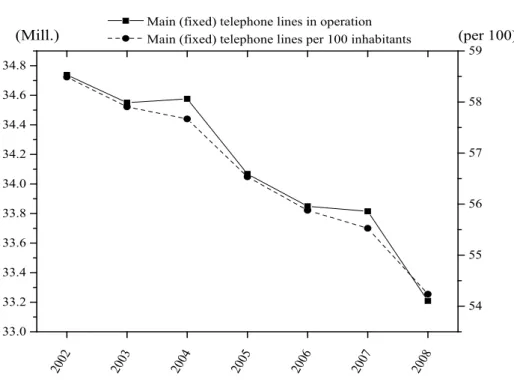
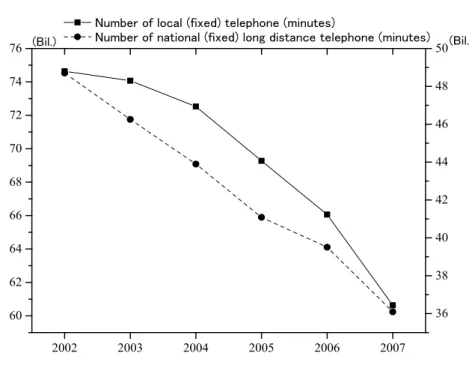
The regulation moved forward to its removal from 2002. As shown in figure I-8, duration time of local and long distance calls fell drastically, so the circumstances in the market also changed rapidly. Unlike the 1990’s, the number of fixed subscription decreased drastically as shown in figure I-6. On the contrary, the number of mobile subscription grew exponentially as shown in figure I-7.
A data communications service like xDSL showed rapid growth in figure I-9, while the growth of existing dial-up was declining steeply. As shown in figure I-10, households’
expenditure for the communications service drastically increased based on the expenditure in 1995. The talk time in the fixed line also fell drastically at the same period as shown in figure I- 8. These might be caused by the growth of the data communications services. The CPI (Consumer Price Index) in figure I-11 showed a drastic decline in price of the telephone and telefax equipment, which was caused by the supply for the strong demand in the market. The flat-rate charging scheme could help the strong demand because of the easiness to introduce those services. In addition, innovations brought drastic decline of the equipment price, which contributed to the reduction of its price.
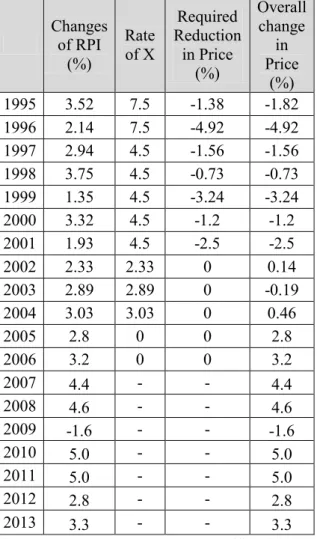
Furthermore, as shown in table I-2, the changes in the overall change in price started to rise after the rate effective since 2002. However, breaking down the CPI data shown in figure I- 11, the decline of the equipment price showed more drastically than that of the service prices.
Therefore, the decline of the equipment price contributed more to that of overall retail price.
This implies that the price-cap was not necessarily the cause of the decline because the price drop in the equipment was too drastic to figure out that the cause of the decline simply came from the price drop in the services.
While subsection 1.2.6 showed that the price-cap worked for the reduction in retail price, the retail price rose as the policy moved toward the removal of the regulation. In other words, we might be hard to figure out where the decline came from while customers could feel the decline in retail price. Therefore, the experience of the price-cap in the UK shows that we have to break down the change in the price and figure out the cause of the decline.
Table I-2 Changes in Influences of the Cap and the Price Changes after the Cap Changes
of RPI (%)
Rate of X
Required Reduction
in Price (%)
Overall change Price in 1995 3.52 7.5 -1.38 -1.82 (%) 1996 2.14 7.5 -4.92 -4.92 1997 2.94 4.5 -1.56 -1.56 1998 3.75 4.5 -0.73 -0.73 1999 1.35 4.5 -3.24 -3.24 2000 3.32 4.5 -1.2 -1.2 2001 1.93 4.5 -2.5 -2.5
2002 2.33 2.33 0 0.14
2003 2.89 2.89 0 -0.19
2004 3.03 3.03 0 0.46
2005 2.8 0 0 2.8
2006 3.2 0 0 3.2
2007 4.4 - - 4.4
2008 4.6 - - 4.6
2009 -1.6 - - -1.6
2010 5.0 - - 5.0
2011 5.0 - - 5.0
2012 2.8 - - 2.8
2013 3.3 - - 3.3
Source: BT Annual Reports, Office for National Statistics 1.2.7 The Market Circumstances realized by the Price-Cap
Until 2010, BT’s market share had been above 50%, which shows that BT still have great market power to influence the market. As shown in figure I-12, the price-cap worked well to reduce retail price according to the rate of X. As shown in figure I-13, the number of BT’s unbundled local loop had increased exponentially since 2005. This implies that the BT’s local loop may have a strong market power because the revenue shares of the local call had been above 50% until 2009 in table I-3. As of 2007, local loop unbundling was completed and 118 operators were in service in the telephony market through Public Switched Telephone Network (PSTN) as shown in OECD (2009)8. In the same data of OECD (2013)9, the number is down to less than 50 PSTN operators in service, and the number of fixed operators in total was also less
8 See the numbers shown in table 2.1 of OECD (2009).
9 See the numbers shown in table 2.1 of OECD (2013).
8
than the number in 2009, which might have some concerns on competitiveness in the fixed line market. Although optical fiber network grows rapidly these days, the fixed network still contributes not only to telephony service but also communications services like xDSL.
Furthermore, services available through fixed lines like PSTN are bundled in a package, so called “Triple Play”. The package provides telephony, data communications, and video service, but some operators offered more services to bundle. This practice works not only to lock customers in but also to increase their revenues.
Thus, BT’s revenue share dropped to below 50% in 3Q of 2009, and its yearly data are shown in table I-3. The status of competition can be measured by Herfindahl-Hirschman Index (HHI)10. HHI of the local call is shown in table I-3. Ordinary quantitative market share is not enough to examine the effect of price-cap. To take price factors into consideration, revenue share could be appropriate to examine not only the effect of the price-cap but also that of competition after the price-cap era as shown in table I-3.
In the consideration of the HHI, we assume the intuitive market status described as the
“pseudo” HHI11. The revised HHI might be close to the actual sense of the status because the owners of the equipment are network operators like “major players” listed in figure I-3, and the services offered by the small entrants through the equipment seem not to be in the same conditions as those of major players. We know this assessment is a little bit rough to handle it, but we can show how different what consumers feel and the actual status of the market.
We have to note that the lessons from this section may be applied only to the fixed line market for the consistency in our analyses.
10 HHI is an index to measure the degree of monopoly in a market. The index is calculated by the
summation of squared number of shares in the market. The index of zero is perfectly competitive market, and 10,000 is perfectly monopolized market.
11 The “pseudo” HHI is assumed that there are only a few major players only in the market listed in the table I-3. The reason for this assumption is that most new entrants are mostly small in the size of the network, and it is hard to offer the same conditions or better as major players do. That is why, we assume the case where it is negligible for customers to choose offers by small operators. In our case, the
Table I-3 Geographic (local) Call Revenue Shares by Operators & HHI Geographic Call Revenue Share by Operator & HHI
BT ntl: Telewest Virgin media others HHI
2000 67.2% 13.5% 19.4% 5069
2001 63.0% 15.1% 21.9% 4675
2002 65.1% 15.1% 19.8% 4859
2003 64.8% 13.8% 21.5% 4845
2004 60.9% 13.9% 25.2% 4538
2005 56.8% 13.7% 29.5% 4285
2006 54.8% 13.0% 32.1% 4210
2007 56.1% 12.8% 31.2% 4278
2008 55.0% 11.8% 33.2% 4270
2009 54.7% 12.1% 33.2% 4240
2010 46.8% 17.2% 36.0% 3784
2011 47.0% 16.4% 36.6% 3818
2012 47.2% 15.7% 37.0% 3850
* Data includes (unlimited) dial-up connection
Source: Ofcom Telecommunications Market Data Tables
10
Table I-4 Call Revenue Shares of “Major-Players-Only” Market and the “Pseudo”
HHI
Geographic Call Revenue Share by Assumed Bundled Operator &
HHI
BT ntl:Telewest Virgin media HHI
2000 67.2% 13.5% 4694
2001 63.0% 15.1% 4194
2002 65.1% 15.1% 4469
2003 64.8% 13.8% 4384
2004 60.9% 13.9% 3904
2005 56.8% 13.7% 3417
2006 54.8% 13.0% 3177
2007 56.1% 12.8% 3306
2008 55.0% 11.8% 3168
2009 54.7% 12.1% 3137
2010 46.8% 17.2% 2486
2011 47.0% 16.4% 2476
2012 47.2% 15.7% 2480
* Data includes (unlimited) dial-up connection
Source: Ofcom Telecommunications Market Data Tables 1.2.8 Remarks
In section 1.2, we reviewed the influence and the contribution of the regulation through the case of the United Kingdom. The price-cap is one of the major examples of market liberalization in the 1980s. From our review of the case in the UK, we reassured that the price- cap has an incentive to decrease price, and it had been working effectively till the end of the regulatory scheme.
And the equipment in local loop in the UK is legitimately unbundled, the proportion of the exchanges ready for the unbundling is favorably increasing. As we also pointed out in table I-3, the call revenue share implies that local loop has still been offered by BT at the high proportion. So a large share of the local loop network in the UK is still controlled by BT, and that seems to have been unchanged since the nationalized era.
While the regulation has an incentive to lower the price, the structure of the local loop seems not to be changed regardless of the market structure. The lack of the change in the local loop may cause the access deficit.
The reason why the entrants hesitate to enter the local loop is that a large amount of capital is necessary to build and maintain their own network and services. The access deficit becomes a burden for entrants and tends to be charged directly to customers.
As the eras we classified according to the rate of X, each era was led by the variety of services and the strong demand. The demand could be brought by the price drops. The price-cap is not major policy instrument in recent years, but its effectiveness may still work for the market in a different way.
Reviewing the case of the UK shows that it is necessary to consider further on innovation; the efficiency between installed base and new adopters with more compatible goods or standards12. All those topics are discussed further in chapter 2.
<Figures>
Figure I-1 1991-1997 Number of Mobile Subscription
1991 1992 1993 1994 1995 1996 1997
0 1 2 3 4 5 6 7 8
Mobile cellular telephone subscriptions (Digital)
Mobile cellular telephone subscriptions per 100 inhabitants
(Mill.) (per 100)
2 4 6 8 10 12 14 16
Source: ITU World Telecommunications Indicators
12 Normative approach is discussed by Farrell and Saloner (1985, 1986). The discussion shows “excess inertia” and “excess momentum” exist. The excess inertia is an effect that a widely-used efficient standard or technology tends to keep using even though a more efficient newer technology is invented as the case of QWERTY keyboard. The excess momentum is the one that the early adopters called installed base momentary incur unavoidable costs if the newer standard is adopted. Katz and Shapiro (1986);
Greenstein (1993) also discussed in the same kind of approach. All those topics are discussed further in chapter 2.
12
Figure I-2 Changes of Subscribers & ISDN Channels in 1991-1997 Telephone Lines in Operation
1991 1992 1993 1994 1995 1996 1997
0 50 100 150 200 250
300 (thou.)
ISDN subscribers ISDN channels
(thou.)
0 200 400 600 800 1000 1200 1400
Source: ITU World Telecommunications Indicators Figure I-3 Number of Fixed Telephone Lines in Operation
1991 1992 1993 1994 1995 1996 1997
25 26 27 28 29 30 31 32
Main (fixed) telephone lines in operation Main (fixed) telephone lines per 100 inhabitants
(mill.) (per 100)
44 46 48 50 52 54 56
Source: ITU World Telecommunications Indicators
Figure I-4 1998-2002 Number of dial-up and xDSL Subscriber
1998 1999 2000 2001 2002
3 4 5 6 7 8 9 10 11 12
Dial-up Internet subscribers
DSL Internet subscribers (Thou.) (Mill.)
0 100 200 300 400 500 600 700
Source: ITU World Telecommunications Indicators Figure I-5 Total fixed telephone subscribers accessing the Internet from 1998 to 2002
1998 1999 2000 2001 2002
4 6 8 10 12
Total (fixed) Internet subscribers Dial-up Internet subscribers (Mill.)
Source: ITU World Telecommunications Indicators
14
Figure I-6 Numbers of Fixed Telephone Lines in Operation
2002 2003 2004 2005 2006 2007 2008
33.0 33.2 33.4 33.6 33.8 34.0 34.2 34.4 34.6 34.8
Main (fixed) telephone lines in operation Main (fixed) telephone lines per 100 inhabitants
54 55 56 57 58
(Mill.) (per 100)59
Source: ITU World Telecommunications Indicators Figure I-7 Number of Mobile Cellular Telephone Subscribers
2002 2003 2004 2005 2006 2007 2008
45 50 55 60 65 70 75 80
Mobile cellular telephone subscriptions (Digital)
Mobile cellular telephone subscriptions per 100 inhabitants (Mill.)
80 100 120 (per 100)
Source: ITU World Telecommunications Indicators
Figure I-8 Number of Fixed Telephone Talk Time
2002 2003 2004 2005 2006 2007
60 62 64 66 68 70 72 74 76
Number of local (fixed) telephone (minutes)
Number of national (fixed) long distance telephone (minutes)
36 38 40 42 44 46 48 50(Bil.) (Bil.)
Source: ITU World Telecommunications Indicators FigureI-9 Number of Dial-up and DSL Subscribe
2002 2003 2004 2005 2006 2007 2008
2 4 6 8 10 12
Dial-up Internet subscribers DSL Internet subscribers
0 2 4 6 8 10 12 14 (Mill.) (Mill.)
Source: ITU World Telecommunications Indicators
16
Figure I-10 Changes in the proportion of households’ expenditure for Communications in OECD country
1995 1996 1997 1998 1999 2000 2001 2002 2003 2004 2005 2006 2007 2008 2009
95 100 105 110 115 120 125 130 135 140
The Changes (1995=100)
Source: OECD Communications Outlook 2011 Figure I-11 Trend of harmonized indices of consumer prices (HICP) for
CommunicationEU-25
1999 2000 2001 2002 2003 2004 2005 2006 2007 2008 2009
20 30 40 50 60 70 80 90 100 110
(1999=100)
Telephone and telefax and services Telephone and telefax equipment
Source: OECD Communications Outlook 2011
Figure I-12 Changes in the Rate of X and the Retail Price under the Price-Cap
1995 1996 1997 1998 1999 2000 2001 2002 2003 2004 2005 2006
-4 -2 0 2 4 6 8
-4 -2 0 2 4 6 8 (%) Rate of X
Overall price change
(%)
Source: BT Annual reports Figure I-13 Number of Unbundled Local Loops
2002 2003 2004 2005 2006 2007 2008 2009
0 1 2 3 4 5 6 7
Number of unbundled local loops (Mill.)
Source: OECD Communications Outlook 2011
18
1.3 The Rate of Return: United States 1.3.1 The Historical Review
The United States implemented the fair rate of return regulation to optimize the operator’s profit. They can earn normal profits though the rate of return (ROR) regulation. This implies that they could not earn excess profits if the market was under perfect competition.
Therefore, the regulation allows a certain amount of profits that can be offset by the capital investment in a long term. The return under the regulation that relates closely to the amount of capital investments should be the minimal for fear of interference by the regulation. So, the regulation was implemented to the operators formally owned nationally. Section 1.3 considers the effect of the ROR and its background. Next subsection 1.3.2 reviews the discussion of Averch-Johnson (1962) and how the ROR works effectively.
1.3.2 The Review of the Averch-Johnson (A-J) Model
The ROR regulation was discussed by Averch and Johnson (1962) considering a firm under the constraint by the regulation. The goal of the ROR was to set an optimal regulation for public utilities to encourage the market to competitive circumstances, but the A-J model showed that the regulation needed to care about the price level realized in advance. In other words, considering the regulation with a clear goal and its process was the key to the effectiveness of the regulation.
In earlier literature on the ROR regulation, Bailey and Malone (1970) showed that the profit maximization firm tends to overcapitalize, while sales or output maximizing firm tends to undercapitalize. Klevorick (1971) discussed the A-J model using normative and statistical approach. Takayama (1969) also pointed out that we should notice that we could not tell until the shift direction of the marginal product of capital curve is clarified. Sheshinski (1971) showed a necessary condition to be utility maximizing solution.
Our goal in this subsection is to confirm the effectiveness of the ROR and figure out how the ROR is applicable to the market. One of the problem in the A-J model is the optimality in costs.
The A-J model has two possible situations to bring;
At the competitive level, the operator could sell below marginal cost to increase profit, then the operator builds assets and installed base.
The regulatory agency allows the operator to set a price above the regulatory level.
In either case, the operators can set the price arbitrarily according to their strategy or financial situations. Therefore, the consequence directly affects consumers. Sappington (2002) also pointed out 8 drawbacks on the regulation:
① “[L]imited incentives for innovation and cost reduction”
② “[O]ver-capitalization”
③ “[H]igh cost of regulation”
④ “[E]xcessive risk imposed on consumers”
⑤ “[C]ost shifting”
⑥ “[I]nappropriate levels of diversification and innovation”
⑦ “[I]nefficient choice of operating technology”
⑧ “[I]nsufficient pricing flexibility in the presence of competitive pressures”.
To review the regulation, we need to review every point of the drawbacks, and consider close relationships between drawbacks. We consider the profit maximizing firm under cost minimization,
𝑃𝑃𝑃𝑃𝑃𝑃𝑃𝑃𝑃𝑃𝑃𝑃=𝑅𝑅𝑅𝑅𝑅𝑅𝑅𝑅𝑅𝑅𝑅𝑅𝑅𝑅 − 𝐶𝐶𝑃𝑃𝐶𝐶𝑃𝑃 𝑃𝑃𝑃𝑃 𝐹𝐹𝐹𝐹𝐹𝐹𝑃𝑃𝑃𝑃𝑃𝑃 𝐾𝐾 − 𝐶𝐶𝑃𝑃𝐶𝐶𝑃𝑃 𝑃𝑃𝑃𝑃 𝐹𝐹𝐹𝐹𝐹𝐹𝑃𝑃𝑃𝑃𝑃𝑃 𝐿𝐿.
The profit of the operator comes from the revenue minus cost of the two factors, and The ROR formula expects the revenue to be equal to the total cost spent as
𝑅𝑅𝑅𝑅𝑅𝑅𝑅𝑅𝑅𝑅𝑅𝑅𝑅𝑅 𝐹𝐹𝑎𝑎𝑎𝑎𝑃𝑃𝑎𝑎𝑅𝑅𝑎𝑎=𝑇𝑇𝑃𝑃𝑃𝑃𝐹𝐹𝑎𝑎 𝐶𝐶𝑃𝑃𝐶𝐶𝑃𝑃=𝑉𝑉𝐹𝐹𝑃𝑃𝑃𝑃𝐹𝐹𝑉𝑉𝑎𝑎𝑅𝑅 𝐶𝐶𝑃𝑃𝐶𝐶𝑃𝑃+𝑅𝑅𝑅𝑅𝑅𝑅×𝑅𝑅𝐹𝐹𝑃𝑃𝑅𝑅 𝐵𝐵𝐹𝐹𝐶𝐶𝑅𝑅.
For optimal regulation, the ROR formula above can be that the profit is zero and the circumstances can be described so as to balance between the profit and the allowed return under the regulation,
20
𝑅𝑅𝑅𝑅𝑅𝑅𝑅𝑅𝑅𝑅𝑅𝑅𝑅𝑅 − 𝐶𝐶𝑃𝑃𝐶𝐶𝑃𝑃 𝑃𝑃𝑃𝑃 𝐹𝐹𝐹𝐹𝐹𝐹𝑃𝑃𝑃𝑃𝑃𝑃 𝐿𝐿=𝑅𝑅𝑅𝑅𝑅𝑅×𝑅𝑅𝐹𝐹𝑃𝑃𝑅𝑅 𝐵𝐵𝐹𝐹𝐶𝐶𝑅𝑅.
The ROR regulation is the optimal regulation considering only the efficiency of the rate base which is observable to us. Moreover, the realized optimal situation in the A-J model implies that the unobservable factor L is also optimal. Consequently, the price of the market under the regulation can be calculated and set in a way that the rate base is multiplied by the rate, and divided by the quantity. In sum, the A-J model shows that the ROR solves the problem of observability in cost by the regulation.
1.3.3 Remarks
In all, this section reviewed the model of the ROR and we found some points to reassure. First, the ROR regulation could be effective to keep a certain market situation and to control the market. However, the problem of cost observability may continue to exist if the market situation goes more competitive for profitability by cost reduction.
For its feasibility, another key for the ROR is to find out the level of the favorable profitability under the ROR. Through the realized level of the optimal regulation, to what level of the price might be affordable or favorable for customers. Observations and considerations for this aspect are critical. However discussions on the level are outside of our discussion.
Second, as for operators assumed in their model, we may have a room to have the cost reduction incentive in two cases; when the incentive is at the level of the optimal regulation, and when the incentive away from the optimal regulation level. In other words, there is a room to reconsider the cost observability.
Furthermore, it is hard to assume the homogenous customer who is defined as a typical customer and to track each customer’s preference because recent services are well differentiated in price. Therefore, most regulatory agencies in developed countries gave up using policy adjustments or considering the optimal circumstances by the regulation because it was difficult to assume a certain customer and a market situation in reality.
1.4 Review of the Critical Changes in the Market Trends 1.4.1 Policy Oriented Market to Competition
As we reviewed in previous sections, first one is the change from policy oriented market to competition, which is our biggest event in the history of the market. In the case 1980’s, the UK passed the Telecommunications Act, and the liberalization in the market spread to VANS. While interconnections were allowed between operators, BT had to concentrate on basic service like telephony at the early stage of the liberalization. The regulatory agency Oftel set the RPI-X formula to assess retail price of the charge. The policy oriented market control literally adjusts or modifies the market situation deliberately.
In the case of The US, they implemented the ROR to optimize the operator’s profits in the 1980’s. The rate of return (ROR) regulation implies that they could not earn excess profits if the market was under perfect competition. In the ROR, a certain amount of profits could be offset by the capital investment in a long term, though the problem of observability may exist.
In recent years, the convergence among networks and services using the Internet Protocol (IP). Policy makers are trying to take advantage of new capabilities to improve better circumstances in view of affordability and equity. Most countries have acknowledged the increasing influences of broadband networks, and the governments are preparing for more availability of not only fixed network but also mobile network. Figure I-14 shows that the growth in revenues and the number of access paths increases rapidly as the spread of the broadband. As we can see also in figure I-14, the levels of the two factors between the 1980’s and 2000’s are apparently different because of the rapid growth.
Furthermore, taking a constant level of investment taking into consideration in figure I- 14, the resource allocation for the investments is of a great concern because operators need to invest efficiently to build a telecom network as a whole under the convergence between networks and services through IP.
Therefore, recent policymakers are trying to encourage operators to implement more innovative solutions for networks and services rather than to control the price or the market in a certain direction.
22
Figure I-14 Subscriber, Revenue and Investment Growth, 1980 – 2011
1983 1988 1993 1998 2003 2008
1980 1985 1990 1995 2000 2005 2010
0 200 400 600 800 1000 1200 1400
Revenue
Investment (left scale)
Total communication access paths (analogue lines + ISDN lines + DSL + cable modem + fibre + mobile) (right scale)
Revenue (current USD billions)
0 500 1000 1500 2000
Total communication access paths (millions)
Source: OECD Communications Outlook 2013 1.4.2 Fixed Network to Mobile Network
As shown in subsection 1.4.1, recent rapid revenue growth may come from the availability of accessing to the Internet. Figure I-15 shows that the total number of IP traffic in 2011 was more than ten times than that in 2005. This ten-fold phenomenon happened only in six years. As shown in figure I-16 and figure I-17, the cellular mobile traffic continues to grow in both the UK and the US. Although the share of the mobile traffic was small in the global IP traffic, the rapid growth of the mobile use showed that the mobile network plays a critical role for the recent market trend.
Therefore, figure I-18 shows how operators earn revenues against the change of the trend to mobile network. The trend of revenue source is about to change from fixed network to mobile network. On the traffic side, the share of mobile data traffic is very small, but the revenue share is almost even in 2011 though we showed in figure I-15.
Taking the share of the mobile traffic into consideration, these data suggest that the cost for the use of mobile data might be extremely high compared to that for the use of fixed network. Nonetheless the convenience and the influence of the mobile network against our lives are getting better and greater day by day, which may be implied in figure I-19. The constant investments in figure I-14 also suggest that it is hard to catch up with the exploding demand for the mobile traffic use.
Figure I-15 Global IP Traffic, 2005-2011
2005 2006 2007 2008 2009 2010 2011
0 5000 10000 15000 20000 25000 30000 35000
Total IP Traffic (PB/month)
Consumer Internet Business Internet VoD
Business IP WAN Mobile data
Source: OECD Communications Outlook 2013
24
Figure I-16 Cellular Mobile Traffic in the UK
1996 1997 1998 1999 2000 2001 2002 2003 2004 2005 2006 2007 2008 2009 2010 2011
1996 1998 2000 2002 2004 2006 2008 2010
0 20 40 60 80 100 120 140
Cellular mobile voice traffic
Cellular mobile traffic per mobile subscriber per year
UK
Cellular mobile voice traffic (Billions)
800 900 1000 1100 1200 1300 1400 1500 1600
Cellular mobile traffic per mobile subscriber per year
Source: OECD Communications Outlook 2013 Figure I-17 Cellular Mobile Traffic in the US
1997 1999 2001 2003 2005 2007 2009 2011
1996 1998 2000 2002 2004 2006 2008 2010
0 200 400 600 800 1000 1200 1400 1600
Cellular mobile voice traffic
Cellular mobile traffic per mobile subscriber per year
US
Cellular mobile voice traffic (Billions)
0 1000 2000 3000 4000 5000 6000
Cellular mobile traffic per mobile subscriber per year
Source: OECD Communications Outlook 2013
Figure I-18 OECD Share of Mobile and Fixed Telecommunication Revenues, 1998-2011
20% 23%26% 29%32% 34% 37% 38% 41% 43% 45% 46%47% 48%
80% 77%74% 71%68% 66% 63% 62% 59% 57% 55% 54%53% 52%
20% 23%26% 29%32% 34% 37% 38% 41% 43% 45% 46%47% 48%
80% 77%74% 71%68% 66% 63% 62% 59% 57% 55% 54%53% 52%
1998 1999 2000 2001 2002 2003 2004 2005 2006 2007 2008 2009 2010 2011
0 20 40 60 80 100
Total Revenue (%)
Fixed revenues Mobile revenues
Source: OECD Communications Outlook 2013 Figure I-19 Wireless and Fixed Broadband Subscriptions in OECD Countries
1997 1999 2001 2003 2005 2007 2009 2011
1996 1998 2000 2002 2004 2006 2008 2010
0 100 200 300 400 500 600 700
Subscriptions (Millions)
Fixed broadband Wireless broadband
Source: OECD Communications Outlook 2013
26
1.4.3 Telephony Communication to Data Communication
As shown in figure I-6 and figure I-20, the number of fixed telephone lines is decreasing drastically. Consequently, figure I-21 shows that not only the number of the fixed lines but also that of access paths to the Internet are decreasing in OECD countries.
In the process of this trend, the way of communication changed from voice communication through telephony service to the data communication including voice through the Internet such as VoIP (Voice over IP) and SNS (Social Network Service). Although the talking minutes through telephony service are also decreasing shown in figure I-22 and I-23, but the people who have a wireline subscription may replace to the optical fiber network. The subscription of fiber network are offered bundled services that include voice, data, TV, and more services at affordable price. Consequently, this trend can be seen in figure I-24; fiber network attracts people by offering bundled services.
Figure I-20 The number of Fixed Telephone Lines in the US
1983 1985 1988 1990 1993 1995 1998 2000 2003 2005 2008 2010
100 120 140 160 180 200
Fixed telephone lines
Fixed telephone lines per 100 inhabitants
US
Fixed telephone lines (Millions)
45 50 55 60 65 70
Fixed telephone lines per 100 inhabitants
Source: ITU World Telecommunications Indicators
Figure I-21 Net Additions of Fixed Telephone Access Paths (analogue + ISDN lines) between 2009 and 2011
United Kingdom United States OECD
-8 -6 -4 -2 0 2
Net additions of fixed telephone access paths (%) Net additions of fixed telephone access paths (analogue + ISDN lines)
Source: OECD Communications Outlook 2013 Figure I-22 Domestic Fixed-to-Fixed Telephone Traffic
1983 1985 1988 1990 1993 1995 1998 2000 2003 2005 2008
90 100 110 120 130 140
UK US
* Data in 2002 through 2004 are missing in both countries
UK (Billion Minutes)
800 1000 1200 1400 1600 1800 2000 2200 2400 2600
US (Billion Minutes)
Source: ITU World Telecommunications Indicators
28
Figure I-23 Long Distance Fixed-to-Fixed Telephone Traffic
1983 19851985 1988 19901990 1993 19951995 1998 20002000 2003 20052005
25 30 35 40 45 50 55 60
UK US
UK (Billion Minutes)
100 200 300 400 500 600 700 800 900
US (Billion Minutes)
Source: ITU World Telecommunications Indicators Figure I-24 Percentage growth in communication access paths, by technology, 2009-11
-12.08
-7.32
5.03 7.32
15.48
35.98
ISDN Analogue DSL Mobile Cable Fibre
-20 -10 0 10 20 30 40
Percentage Growth (%)
Percentage Growth in Communication Access Paths, by Technology, 2009-11
Source: OECD Communications Outlook 2013
1.4.4 Remarks
We reviewed three critical changes for the market that we need to take into consideration. Each of these changes influences not only our lives in every aspect but also the market.
The change to competitive market shows that policy makers are now trying to encourage operators to implement more innovative solutions rather than to control the price or the market in a certain direction. The more those factors are implemented to the market, the more difficult we calculate or evaluate those values in price and quantity though the innovative solutions that bring more convenience or profitability. The influences are brought by those innovative factors. So, the influences should be distinguished between the one from the market and the other from the innovations.
The change from fixed network to mobile is the biggest change in the history and the market. While the change is a chance to break through an old regime that causes negative effect for the market, the unexpected conflicts between the old regime and the expected innovative system or regime may well happen to rule the market. As we can see the historical reviews in this chapter how to eliminate the negative impact caused by the old regime, the trend that shifts to the mobile network makes the objective of policymaking change to encourage competition rather than continue to control the market.
Although the last change was brought mainly by the change of the trend to mobile network, the ways of communication drastically changed from voice communication through telephony service to the data communication using VoIP and SNS. The change of communication media affects competitive circumstances in the market as the talking minutes through telephony service decreases.
Chapter 2 considers some factors so called traits that causes externalities and we reviews how those factors influence the market. We go further to consider those influences and how the influences work each other.
30
2. The Essential Traits
The telecommunications market plays a key role for building a society with ICT, conveying or providing information as data which is sometimes in forms of voice, picture and movie through network.
This chapter considers the characteristics of network in economics and we pointed out the difficulties in policymaking. We also discuss the externalities of network and its characteristics as follows: compatibility, critical mass, path dependence, installed base and switching cost, and entry deterrence. Finally, we argue about policymaking in view of network externalities.
2.1 Network Effects 2.1.1 Compatibility
Katz and Shapiro (1985) analyzed the effect of externalities through cost and demand considering static one period oligopoly model that consisted of two type of costs: cost of production and cost of achieving compatibility. We assumed that the fixed cost is constant regardless of the size of the network as an externality. Thus, they set the equation of a price according to the expected size of network. This section finds some points to argue about compatibility.
Katz and Shapiro (1985) showed that the customers’ expectations are of great importance discussing the expected size of the network shown by the Cournot equilibrium, which the output level can be chosen when the expected size of the network is given. This assumption showed that the network size that customers expected is equal to a Cournot equilibrium. Consequently, they considered the size of the network when the expected size of the other group is fixed. They used a unique concept of reaction function called the equilibrium reaction correspondence that showed i’s best response to the other group. Using this concept, they showed the existence of the externalities and its indirect effect13.
13 Katz and Shapiro (1986a, b) considered the externality focused on the price affected by a technological factor, and showed how it changes the price. Katz and Shapiro (1992) showed that the excess inertia has an incentive in the externalities, but insufficiency is the cause of the effect. They considers the
insufficient function and its condition. Katz and Shapiro (1994) considers the externality in reality, and they pointed out that the market inefficiency is unclear and difficult issues arise in policymaking. Bental and Spiegel (1995) showed the largest network is of the highest value, and the price could be priced highest level. This result in the situation that people in the network would be only the richest one. Choi
To ensure the effect of compatibility, some cases of its definitions are summarized as
At the time of compatible, the model shows the relationship that the expected size of the network is equal to the expected number of customers.
the expected size of the network = the expected number of consumers
At the time of incompatible, the model shows the relationship that the expected size of the network is equal to the expected total output.
the expected size of the network = the expected total output
For complete incompatibility to be an equilibrium, the value of the other group depends on the value of the customers in the group according to the number of the other group.
For partial compatibility, the expected value of the compatible part is equal to the additional value for the other group as the incentive so that the expected value of the compatible part of the network depends upon how large the other group.
Therefore, we reviewed the effectiveness of compatibility in the market under the assumptions as follows,
If the size of the network is equal to the expected total output, this implies that the expected value of the network is equal to the willingness to pay for the market that customers have.
If the size of the network is less than the expected total output, this implies that customers in the network can get more profit or additional value than that from an additional customer itself.
If the size of the network is more than the expected total output, the opposite case of the former case, this implies that an additional customer
32
not necessarily brings an additional output or less value than the value brought by the additional customer.
Above all, the expectations play a critical role for the increase in the value of the network. In other words, the expectations bring more expectations themselves and so do to the values for the network. This consequently brings more outputs.
To go further discussion, chapter 3, and 4 examine empirical considerations to prove what situation the telecommunications industry is in and how the policymakers think about the situation, problems, and its possible solutions. Next subsection considers how to determine the highest value of the network and how it works in the market.
2.1.2 Critical Mass
The former subsection 2.1.1 showed that the expectations matter in compatibility. This section focuses on the number of customers in a network. Economides (1995) and Economides
& Himmelberg (1995) followed the discussion of network externalities, which defined the value of a good that depends on the number of consumers purchasing the same good. There is a critical mass point in goods with network externalities, and the point is defined as “the minimal non-zero equilibrium size of a network good”. They showed that the critical mass point is independent from the market structure.
In the review of the definition of network externalities by Katz and Shapiro (1985), the expected size is equal to the actual size, and the willingness to pay increases with the number of units sold. The analyses show that the fulfilled expectations demand schedule does show upward sloping especially at the points where the network coverage is small or where the network starts building. However, the market does not exist at the points. The market exists when the size of the networks once reaches the critical mass.
Therefore, the possible critical mass point we see in their models may be chosen the highest, in another word, the critical network size that is Pareto dominant for the existence of the network. Some possible situations may be explained by the models. For a natural monopoly firm, they could always stand a position where is on the part of downward sloping after reaching at the critical mass for profitability. In the downward sloping state, the demand schedule follows the ordinary economic theory, and the state implies the cost also decreases according to the size of the network. For entrants, the network of the entrants may not exist as long as the entrants’
network reaches. Therefore their investment never be realized before reaching the critical mass.
The considerations on critical mass show that a network exists when in a significant size and then, the cost starts reducing as the size of the network grows. This implies that a difficulty arises when a network has strong network externalities.
To establish a network like telecommunications network, a significant size of the network is of great importance. In view of telecommunications policy, a network does not exist until the deployment of the network reaches the size of the critical mass.
Their models also imply that the early adopters especially during a period to achieve a critical mass point might cost more than adopters after reaching at the critical mass size of the network. This means that the imbalance of costs between early and late customers. This discussion follows in section 2.2.
2.1.3 Path Dependence
This subsection shows that the “lock-in” occurs according to historical events or accidents regardless of its relevance to the efficiency or rationality. Paul David (1985) explained the lock-in through QWERTY keyboard standard and examined its reasoning of path dependence in three aspects: technical interrelatedness, economies of scale and quasi- irreversibility.
Technical interrelatedness requires system compatibility between hardware and software, which customers consider expected value depending on the availability of the product.
The choice of customers affects the historical paths so that the subsequent customers choose an inefficient technology like QWERTY standard. Consequently, the economies of scale which shows that the decreasing cost schedule works and the number of customers using the inefficient technology increases.
Finally, quasi-irreversibility in investments showed an asymmetry between the cost of software and that of hardware. The asymmetry implies that the cost of software to guarantee the compatibility in products increases while the cost of hardware decreases because the hardware conversion is cheaper to obtain its compatibility in practical sense. The analysis of David (1985) emphasized that interferences may well exit so that firms may make wrong decisions for the products. Arthur (1994, 1989) showed that there is a market where customers are hard to determine which equilibrium to choose in the static oligopoly model with multiple equilibria.
The model of Arthur (1994) assumed two technologies adopted by a large number of consumers and the regulatory agency classified by preferences. And it showed that it is hard for the operator to change from the one formally selected to a more efficient technology because the
34
benefits gained from early adopters with existing technology are still larger than those gained from new adopters with a new technology. In the model, the difficulty is caused by the
“historical small events” defined as the set of events that are out of knowledge.
The historical small events in a model of increasing return have potential unpredictability and inefficiency because the externalities exist in the set of choices. Each choice affects the subsequent choices and its gains between the early and new customers or adopters after each event.
The judgment whether the choice is right or not can be defined as the path-efficiency.
The path-efficiency could be examined whether the profit of the choice is larger than that of the other option. On the other hand, each judgment has nonergodicity that means the judgment is not necessarily rational and inflexible outcome by the lock-in technology; the gap of returns between choices becomes larger due to innovations. Consequently, the judgment becomes no longer path-efficient.
Through the discussion of path dependence, historical events that are out of knowledge in advance bring the lock-in situation especially in the increasing returns case as we saw in the case of critical mass.
2.1.4 Remarks
In all about network externalities, things we should be taken into consideration most are compatibility and expectations. The compatibility guarantees the value and the size of the network socially shown at the installed base consideration. Policy for encouraging compatibility should be considered, not coercively but promoting competition attractively.
Secondly, the expectations matter for the increase in the value of the network more than that according to the number of customers or the total output. For the competitive circumstances, interconnections between networks are of great importance in practice. For fear of losing share of the market, the dominant firm may make barriers to entry or set some interferences somehow to keep its share. Chapter 3 and 4 considers some factors in practice interfering the competitiveness.
As Economides (1996) implied, the policy for network externalities depends on situations to what extent the industry is matured; unbundling would not work well when the dominant network is not large enough to be preferable industrywide in the existence of critical mass. The practice of unbundling without discretions of the externalities may become the