DESIGN GUIDELINE OF TREES PLANTING ALONG THE ROADSIDE CONSIDERING IMPACTING OF THE CO2 EMISSION DISPERSION BY VEHICLES
著者 ヌル アイニ
著者別表示 NURUL AINI journal or
publication title
博士論文要旨Abstract 学位授与番号 13301甲第1924号
学位名 博士(理学)
学位授与年月日 2020‑09‑28
URL http://hdl.handle.net/2297/00061364
Creative Commons : 表示 ‑ 非営利 ‑ 改変禁止 http://creativecommons.org/licenses/by‑nc‑nd/3.0/deed.ja
I
Abstract Dissertation
DESIGN GUIDELINE OF TREES PLANTING ALONG THE ROADSIDE CONSIDERING IMPACTING OF THE CO2 EMISSION DISPERSION BY
VEHICLES
Graduate School of Natural Science and Technology Kanazawa University
Division: ENVIRONMENTAL DESIGN
Student ID Number:1724052012 Name: NURUL AINI
Chief Supervisor: Prof. ZHENJIANG SHEN
June 2020
II
III
Abstract
This Ph.D. research focuses on evaluating the design of trees planting on the roadside in impacting the dispersion of CO2 emitted from transportation. This research provides the alternative design of trees planting in urban roadside that can improve level air quality exposed CO2 emission. The result can support urban planners, government, or other stakeholders to solve the decreasing air quality due to CO2 emission dispersion.
Computational Fluid Dynamics (CFD) was used to simulate the spread of CO2 and analyze air quality in some design trees planting. So, the first research is investigating the CO2
dispersion emitted from transportation in the study area with trees planting and without tree planting on the roadside. The result confirms the effect of tree planting on air quality exposed to CO2 dispersion that emitted from transportation.
After confirming trees planting impact on CO2 dispersion, the next step is providing row positions of trees planting. This second research evaluates the four-row position of trees planting to the road-air quality from CO2 emission. Trees can plant as a one-row position in the middle of the road. Trees also can plant as double-row positions on both sides of the road as a barrier between road, roadside, and building.
Thirdly, this research predicts CO2 dispersion in different design trees planting patterns. This stage carried out five design of tree planting patterns based on the row position, avenue-tree layout, and space. These designs of trees planting can be effective in increasing air quality if the trees species chosen are appropriate. The selection of the trees is related to the tree’s crown shape. So, the last step of this research is analyzing the crown shape of trees planting on the roadside to improve air quality. This study provides five tree’s crown shape.
Therefore, the design of trees planting patterns can improve air quality exposed to CO2
emission from transportation optimally.
Keywords: CO2 emission, Computational fluid dynamics, trees planting pattern, design trees planting, air quality.
IV
5
I. Introduction
Currently, motor vehicle numbers in urban areas always increase every year. Indonesia, as a developing country, has a high of motor-vehicle number, so there is much congestion that can found in the road. Motor vehicles were increased by 300% since the 2008-2018 (Statistics Bureau of Indonesia, 2019). This condition causes degradation in air quality because it will produce CO2 emissions from gasoline and diesel usage as fuel.
Transportation is the primary source of CO2 emission in the air. It will disperse 34% of the total CO2 in the air every day (Sullivan et al., 2004; Jie, 2011; EPA, 2016). CO2 from transportation spread quickly to the roadside, which is a facility for pedestrians who want to travel in public space that separates from roadway vehicles. But currently, Co2 dispersion that effects road-air quality can harm pedestrians. High CO2 concentration can have a devastating effect on human health, such as headaches, sleepiness, stuffy air, stale, poor concentration, loss of attention, increased heart rate, etc.
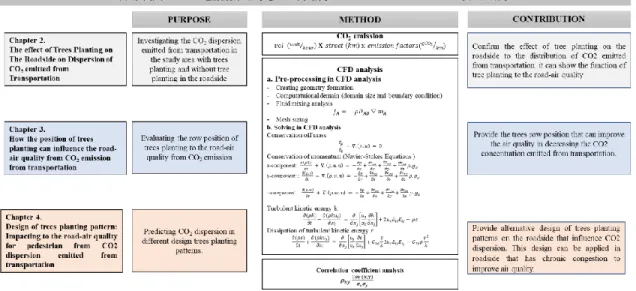
Based on that, this research es expected to deliver the contribution for the body of knowledge by 1) Investigating the CO2 dispersion emitted from transportation in the study area with trees planting and without tree planting on the roadside. This research confirms the effect of tree planting on the roadside to the distribution of CO2 emitted from transportation so that it can be comparative data of air quality in a study area with trees and a study area without trees. 2) Evaluating the row position of trees planting to the road-air quality from CO2 emission. ; 3) Predicting CO2 dispersion in different design trees planting patterns. This design can be applied in roadside that has chronic congestion to improve air quality. So that the results can be used in the tree-side planting design to get the maximum function in improving air quality.
Therefore, the main body in this research divided into four chapters (Figure 1). The first discussion displays investigating the CO2 dispersion emitted from transportation in the study area with trees planting and without tree planting on the roadside. The next discussion is evaluating the row position of trees planting to the road-air quality from CO2 emission. After that, the next section is predicting the CO2 dispersion in different trees planting patterns based on some parameters design.
6
Figure 1 Research framework
1.2.1 The effect of trees planting on the roadside on the dispersion of CO2 emitted from transportation.
This chapter simulates the CO2 dispersion in the real 3D modeling according to the actual physical condition. It is mean that the characteristic of the trees and buildings in the study area were built according to reality. This research displays the comparison of CO2
dispersion in the study area without trees and with trees (Figure 2).
Figure 2 geometry of 3D modeling a) Trees modeling; b) study area with trees; c) study area without trees
This section appearance the distribution of CO2 in the study area. Figure 3 shows the comparison of CO2 dispersion at several heights in both models. Based on that, the model with trees has a higher distribution value. At the height of 1.8 meters, the CO2 distribution in the study area without trees is 19.2%%. While CO2 spread by10.2% in the modeling with trees, this result shows that trees in the roadside can decrease CO2 dispersion by 9% at an altitude of 1.8 meters. It is also displayed in another different height.
7
Figure 3 The comparison of CO2 dispersion on the study area without trees and with trees.
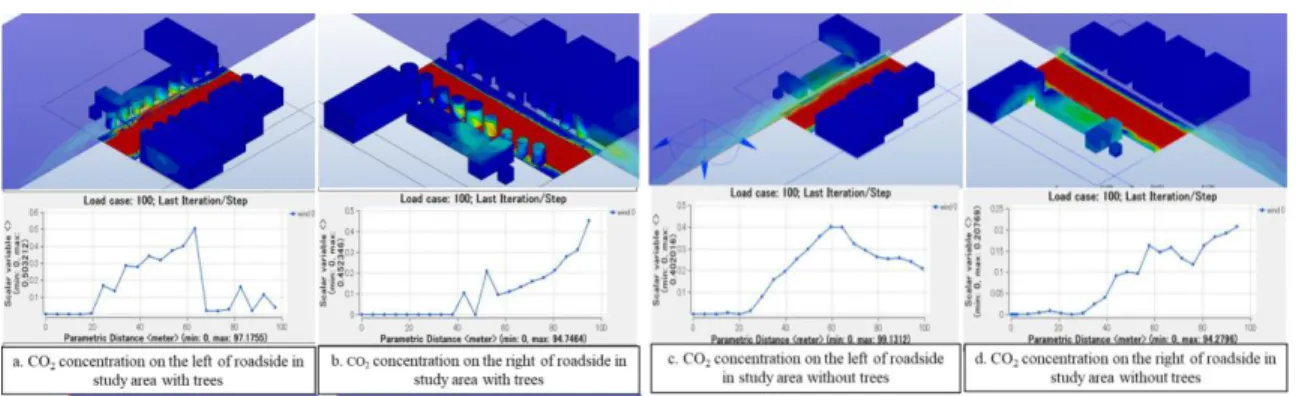
Another result shows the CO2 concentration on the road in both of modeling (Figure 4) and CO2 concentration on the roadside (Figure 5). The result show that study area with trees can decrease CO2 concentration on the road, but has higher CO2 concentration on the roadside. While, study area without trees can decrease CO2 concentration on the road and increase CO2 concentration on the road. Trees can withstand the wind so that CO2 is trapped in the area. This condition is not good for the pedestrian. Then it is necessary to design a better tree planting so that the roadside does not have high CO2 concentrations.
Figure 4 CO2 concentration in the middle of the road and roadside between the area with trees and area without trees
Figure 5 CO2 concentration in the right and left of the roadside
A. Study area with trees
CO2 concentration in the middle of the road at an altitude 1 m
B. Study area without trees
8
3. How positions of trees planting can influence the dispersion of CO2 emission from transportation.
This section discusses the influence of some design positions of trees planting on dispersing CO2. This section provides four position of trees planting on the roadside. This study considers some trees planting position in some road of Surabaya City. Figure 6 shows the position of trees planting in this section.
Figure 6 The position of trees planting in Surabaya city
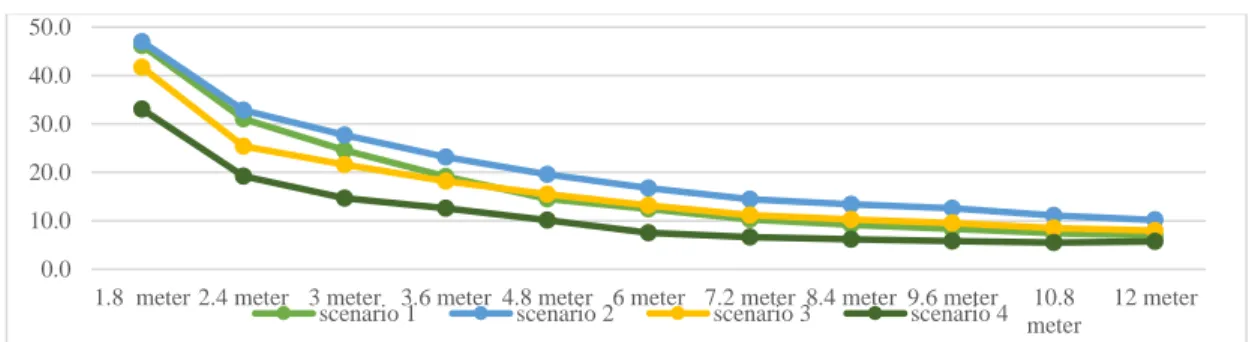
The following figure shows the result of CO2 dispersion simulation at different altitude. The result displays that some row position is not effective in improving the air quality from the distribution of CO2 emission. Therefore, this study evaluates this row position to get the best row position of trees planting in dispersing CO2. Based on that figure, 2nd scenario has the highest CO2 concentration. Then among the four scenarios, 4th scenario, which is trees, are planted on the roadside as a barrier between road and roadside, has the lowest CO2 dispersion than others scenario. 4th Scenario can disperse 33.1% of CO2 emission at an altitude 1.8 meters. It’s mean that this position of trees planting can decrease CO2
dispersion of 13.1%.
Figure 7. CO2 dispersion in some scenario of trees planting position at an different altitude
0.0 10.0 20.0 30.0 40.0 50.0
1.8 meter 2.4 meter 3 meter 3.6 meter 4.8 meter 6 meter 7.2 meter 8.4 meter 9.6 meter 10.8 meter
12 meter scenario 1 scenario 2 scenario 3 scenario 4
9
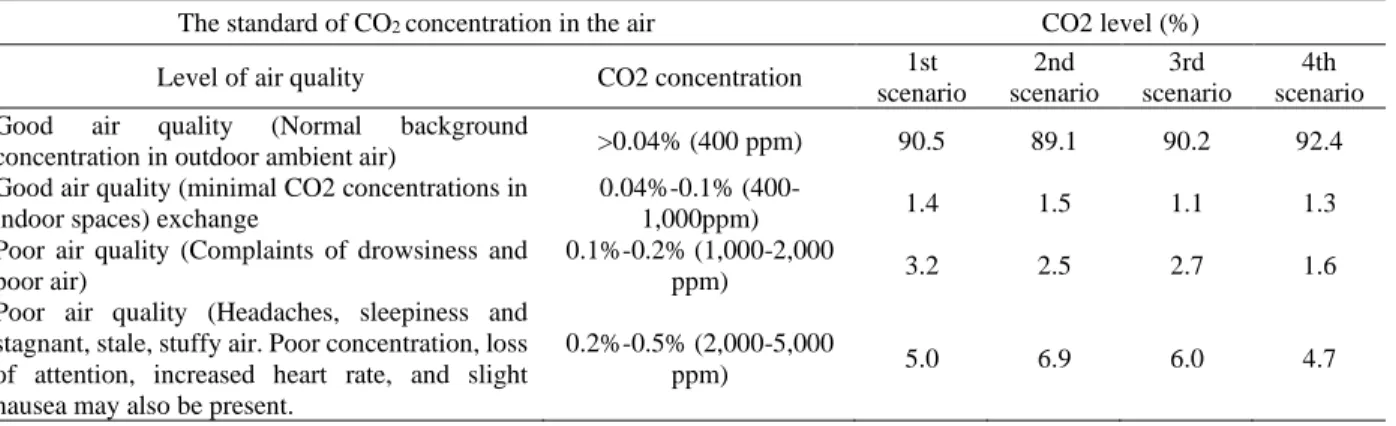
On the other result, this section also shows the analyses of air quality in different tree’s row position (Table 1). Air quality is indicated by CO2 concentration in the study area. This analysis use standard from Wisconsin Department of health service (2019).
Table 1 Level of air quality
The standard of CO2 concentration in the air CO2 level (%)
Level of air quality CO2 concentration 1st
scenario
2nd scenario
3rd scenario
4th scenario Good air quality (Normal background
concentration in outdoor ambient air) >0.04% (400 ppm) 90.5 89.1 90.2 92.4 Good air quality (minimal CO2 concentrations in
indoor spaces) exchange
0.04%-0.1% (400-
1,000ppm) 1.4 1.5 1.1 1.3
Poor air quality (Complaints of drowsiness and poor air)
0.1%-0.2% (1,000-2,000
ppm) 3.2 2.5 2.7 1.6
Poor air quality (Headaches, sleepiness and stagnant, stale, stuffy air. Poor concentration, loss of attention, increased heart rate, and slight nausea may also be present.
0.2%-0.5% (2,000-5,000
ppm) 5.0 6.9 6.0 4.7
Table 1. shows that 4th scenario has the highest good level air quality than other scenarios, which is 92.4% good air quality. While, scenario that has lower percentage of good air quality is 2nd scenario, which is 89.1%. Then 1st and 3rd scenario have similar value of good air quality in outdoor. On the other side, the scenario that has lower percentage of poor air quality is 4th scenario. This scenario only has 6% area that has poor air quality. While, poor air quality in 2nd scenario is 9%, which is the highest area than other scenario.
The conclusion of this section shows that the 4th scenario is better in improving air quality. This scenario plants the trees in the double-row position as a barrier between roadside and road.
4. Impact the design of trees planting patterns on the roadside to the near- road air quality from CO2 dispersion emitted from transportation
This section discusses some design of trees planting patterns to improve the near-road air quality. This chapter displayed five scenarios of trees planting patterns according to some parameters design, which is the position, the avenue-tree layout, and space. So, it can predict the CO2 dispersion in different design trees planting patterns. It will provide some alternatives design of trees planting patterns on the roadside that influence CO2 distribution.
This design can be applied in roadside that has chronic congestion to improve air quality.
Table 2 CO2 dispersion in five scenarios
10
The scenario of trees planting pattern
Parameters of trees planting
pattern
CO2 dispersion at an altitude of 1.8 m
Position of trees row: Double rows Space of trees:
Hedgerow
Avenue-tree layout:
CVF: 21.3%
34.1% of CO2 can disperse in pattern A at an altitude of 1.8 meters.
The range of CO2 concentration in this simulation starts from 0-0.82% (0-8200 ppm) at an altitude of 1.8 meters.
The total area that has poor air quality in this pattern, which has CO2 concentration by >0.1% (>1000 ppm), is 4.35% of the total area at an altitude of 1.8 meters Position of trees
row: Double rows Space of trees:
Hedgerow
Avenue-tree layout:
CVF: 26.6%
Pattern B can distribute CO2 by 28.6% at an altitude of 1.8 meters.
The range of CO2 concentration in this simulation starts from 0-0.78% (0-7800 ppm) at an altitude of 1.8 meters.
Position of trees row: Double rows Space of trees:
Hedgerow
Avenue-tree layout:
CVF: 28.8%
30.1% of CO2 emission can disperse in pattern C at an altitude of 1.8 meters.
The range of CO2 concentrations in the simulation start from 0-0.77% (0-7700 ppm) at an altitude of 1.8 meters.
Position of trees row: Double rows Space of trees:
Hedgerow
Avenue-tree layout:
CVF: 29.8%
Pattern D can distribute CO2 by 32.3% at an altitude of 1.8 meters.
The range of CO2 concentrations in the study area starts from 0-0.79% (0-7900 ppm) at an altitude of 1.8 meters.
Position of trees row: Double rows Space of trees:
Hedgerow
Avenue-tree layout:
CVF: 32%
Pattern E can spread CO2 by 30.06% at an altitude of 1.8 meters.
This pattern has CO2 concentrations in the range from 0- 0.79% (0-7900 ppm) at an altitude of 1.8 meters.
4.0% of the total area at an altitude of 1.8 meters has a poor air quality level, which has >0.1% (>1000 ppm) of CO2 concentration.
the conclusion of trees planting design that can improve air quality is pattern B. Pattern B can decrease CO2 dispersion by 28.6%. It indicates that pattern B with the double-row position, hedgerow space with one by one tree planting (26.6% CVF), can decrease 8% of CO2 dispersion in the study area compared with others. Hence, the area that has poor air quality in this pattern only 3.86% with the Co2 concentration range of 0-0.78%