Structure and biological activities of
calcitonin and procalcitonin amino‑terminal cleavage peptide
著者 加瀬 陽一
著者別表示 Kase Yoichi journal or
publication title
博士論文本文Full 学位授与番号 13301甲第4634号
学位名 博士(理学)
学位授与年月日 2017‑09‑26
URL http://hdl.handle.net/2297/00054260
Creative Commons : 表示 ‑ 非営利 ‑ 改変禁止 http://creativecommons.org/licenses/by‑nc‑nd/3.0/deed.ja
1
Dissertation
Structure and biological activities of calcitonin and procalcitonin amino-terminal cleavage
peptide
Graduate School of Natural Science & Technology Kanazawa University
Major Subject:Division of Natural System Course: Biological Science
School Registration No. 1424062013 Name: Yoichi Kase
Chief Advisor: Nobuo Suzuki Date Submitted: 29 Jun 2017
2
3
CONTENTS
I. General Introduction ... 4
II. The action of the sardine procalcitonin amino-terminal cleavage peptide is different from that of calcitonin and promotes osteoblastic activity in goldfish scales ... 10
1. Introduction ... 11
2. Materials and Methods ... 13
3. Results ... 21
4. Discussion ... 23
III. Partial characterization of a calcitonin-like substance from the Brockmann bodies of medaka (Oryzias latipes) ... 35
1. Introduction ... 36
2. Materials and Methods ... 37
3. Results ... 40
4. Discussion ... 41
IV. Immunoreactive calcitonin cells in the nervous system of the polychaete Perinereis aibuhitensis ... 47
1. Introduction ... 48
2. Materials and Methods ... 50
3. Results ... 53
4. Discussion ... 54
V. General Discussion ... 61
VI. General Summary ... 68
References ... 71
Acknowledgments ... 87
Abbreviation ... 89
4
I. General Introduction
5
In vertebrates, calcium (Ca) is extremely important in several biological processes. For this reason, the Ca concentration in vertebrate plasma is kept almost constant (10 mg/100 ml), regardless of whether they live in an aquatic environment or on land. In addition, the intracellular Ca concentration maintained is about one ten-thousandth of that in plasma. In nerve activity, it is important to maintain the intracellular and extracellular Ca concentration difference. When our plasma Ca concentration rapidly decreases, our nerves and muscles cannot work normally, and abnormal skeletal muscle contraction (tetany) occurs. In addition, Ca plays an important role in blood coagulation, enzyme activation, and hormone secretion, as well as actions in the nerves and muscles.
Therefore, the plasma Ca concentration needs to maintain a constant level. The Ca concentration in plasma does not change significantly even if you eat or drink Ca-rich foods, such as small fried fish or milk. Thus, the roles the endocrine system plays are quite important for maintaining the Ca concentration of plasma.
In this thesis, I focused on calcitonin (CT) as a hormone that regulates the Ca concentration. CT is a peptide hormone consisting of 32 amino acid residues. In mammals, CT suppresses osteoclastic activity and, consequently, decreases blood Ca levels (Azria, 1989). In teleosts, it has been reported that CT suppresses
6
osteoclastic activity in goldfish (fresh water teleosts) (Suzuki et al., 2000a;
Sekiguchi et al., 2009) and nibbler fish (marine teleosts) (Suzuki et al., 2000a). It is highly possible that CT functions to maintain plasma Ca levels in teleosts as well as in mammals.
On the other hand, in the process of CT synthesis, the preprocalcitonin precursor is first synthesized and then separated into 3 peptides—procalcitonin amino-terminal cleavage peptide (N-proCT), CT, and procalcitonin carboxyl-terminal cleavage peptide (C-proCT)—in salmon, chickens, rats, and humans (Burns et al., 1989a; 1989b). In cultured neoplastic C-cells, it has been reported that N-proCT and CT exist nearly equimolar in both cellular extracts and basal medium (Burns et al., 1989a). These facts strongly suggest that N-proCT has some biological activities. Until now, however, the literature has not agreed as to whether N-proCT has biological activity, such as osteoblastic effects. Burns et al. (1989b) reported that nanomolar concentrations of human N-proCT promoted the proliferation of human osteoblasts derived from normal adults and osteosarcomas. However, human N-proCT had no biological activity on the growth and phenotypes of cloned rat osteoblastic and preosteoblastic cells (Guenther and Fleisch, 1991) and has no mitogenic effect on human osteoblasts
7
(Hassager et al., 1991).
Based on this background, I investigate a new function of N-proCT in Chapter 2 of this thesis. First, the full sequence of the preprocalcitonin precursor of the sardine (Sardinops melanostictus) was determined. Then, the biological activity of N-proCT on osteoblasts and osteoclasts was examined using an original bioassay system with fish scales that had both osteoblasts and osteoclasts.
CT is produced in C-cells of the thyroid gland in mammals and in parenchymal cells of the ultimobranchial gland (UBG) in vertebrates other than mammals (Sasayama, 1999a). On the other hand, CT has been found in various tissues such as vertebrate intestines, gonads, lungs, and brains (Azria, 1989). Immunoreactive calcitonin (iCT) has also been found in the central nervous system of several classes of vertebrates (humans: Fischer et al., 1983; rats: Flynn et al., 1981;
pigeons: Galan Galan et al., 1981a; lizards: Galan Galan et al., 1981b; bullfrogs:
Yui, 1983; lamprey and hagfish: Sasayama et al., 1991a). In addition, CT receptors have been found in the brains of flounders (Suzuki et al., 2000b), stingrays (Suzuki et al., 2012), rats (Becskei et al., 2004), and humans (Bower et al., 2016). These facts suggest that CT has not only Ca regulation but also several
8
neurophysiological functions. Indeed, CT has an analgesic effect in mammals, presumably thought to have been caused by elevated plasma β-endorphin levels and interaction with the endogenous opiate system (Hamdy and Daley, 2012). In vertebrates, including teleosts, it is known that various neuropeptides are also produced in pancreas tissues (Jonsson et al., 1993). This suggests that CT may be produced in the pancreatic tissue of teleost fish.
In invertebrates, it has been reported that CT was found in Ciona intestinalis, which is a kind of protochordate (Sekiguchi et al., 2009). Protochordate CT was composed of 30 amino acids with two N-terminal cysteine residues, and it acted to suppress osteoclasts in goldfish (Sekiguchi et al., 2009). This molecule was also reportedly expressed in the neural complexes of juveniles (Sekiguchi et al., 2009). These facts suggest that CT plays some role in invertebrates’ nervous systems.
Taking the facts above into consideration, I next investigated ectopic CT for Chapters 3 and 4 of this thesis. In Chapter 3, I focused on fish. A CT-like substance was detected in the Brockmann bodies of medaka (Oryzias latipes).
Therefore, the biochemical properties and biological activities of the CT-like substance were examined. Then, in Chapter 4, I focused on invertebrates. A
9
CT-like substance in the nervous system of polychaetes (Perinereis aibuhitensis) was identified. Also, the biochemical properties of the CT-like substance were analyzed. In this thesis, the structure and bioactivity of CT and CT-related substances are discussed.
10
II. The action of the sardine procalcitonin amino-terminal cleavage peptide is different from that of calcitonin and
promotes osteoblastic activity in goldfish scales
11
1. Introduction
Calcitonin (CT) is a peptide hormone that consists of 32 amino acid residues. In mammals, CT suppresses osteoclastic activity and, consequently, decreases blood calcium levels (Azria, 1989). In teleosts as well as mammals, it has been reported that CT suppresses osteoclastic activity in goldfish (fresh water teleosts) (Suzuki et al., 2000a; Sekiguchi et al., 2009) and nibbler fish (marine teleosts) (Suzuki et al., 2000a). CT is mainly produced in C-cells of the thyroid gland in mammals and in parenchymal cells of the ultimobranchial gland (UBG) in vertebrates other than mammals (Sasayama, 1999). On the other hand, in the process of CT synthesis, the preprocalcitonin precursor is first synthesized and then separated into 3 peptides—procalcitonin amino-terminal cleavage peptide (N-proCT), CT, and procalcitonin carboxyl-terminal cleavage peptide (C-proCT)—in salmon, chickens, rats, and humans (Burns et al., 1989a; 1989b). In cultured neoplastic C-cells, it has been reported that N-proCT and CT exist nearly equimolar in both cellular extracts and basal medium (Burns et al., 1989a). These facts strongly suggest that N-proCT has some biological activities.
Until now, however, the literature has not agreed as to whether N-proCT has biological activity, such as osteoblastic effects. Namely, human N-proCT had no
12
biological activity on the growth and phenotypes of cloned rat osteoblastic and preosteoblastic cells (Guenther and Fleisch, 1991) and has no mitogenic effect on human osteoblasts (Hassager et al., 1991). In contrast, Burns et al. (1989b) reported that nanomolar levels of human N-proCT promoted the proliferation of human osteoblasts derived from normal adults and osteosarcomas.
Thus, using reversed-phase high performance liquid chromatography (RP-HPLC), CT from sardine (Sardinops melanostictus) UBGs was purified. Then, the amino acid sequence of sardine CT was determined (Suzuki et al., 1994). In addition, the hypocalcemic activities of synthetic salmon CT and synthetic sardine CT were measured and compared using a rat bioassay. Results showed that the hypocalcemic activity of sardine CT was more than twice as high as that of salmon CT (Suzuki et al., 1994). Just as sardine CT has high activity in calcium metabolism, sardine N-proCT may show high activity in osteoblasts. Generally, sardines are readily available in Japan; however, it is difficult to maintain them in the aquarium over the long term. Therefore, this fish is unsuitable for physiological experiments. To analyze the biological activity of both CT and N-proCT, our research group developed a unique in vitro assay system using goldfish. In this assay system, goldfish CT was shown to inhibit osteoclastic
13
activity in goldfish scales (Suzuki et al., 2000a; Suzuki et al., 2008; Sekiguchi et al., 2009). Furthermore, in this assay system, it was shown that parathyroid hormone, an osteoclast-activating hormone, acts on goldfish osteoblasts and osteoclasts and activates osteoclasts (multinucleated osteoclasts) (Suzuki et al., 2011). Thus, our in vitro goldfish bioassay is suitable for elucidating bone metabolic hormone function.
Therefore, in this study, the full-length sequence of the sardine preprocalcitonin precursor from the UBG was determined using 5’ and 3’ rapid amplification of cDNA ends (RACE). Furthermore, both N-proCT and CT were synthesized, and the biological activity of these peptides in osteoblasts and osteoclasts was investigated in our unique assay system using goldfish scales.
2. Materials and Methods
2.1. Animals
Japanese sardines (Sardinops melanostictus) purchased from the Choshi Fishery Cooperative were used to determine the total length sequence of the precalcitonin precursor.
Goldfish (Carassius auratus) (a female and a male, 20-30g) purchased from a
14
commercial source (Higashikawa Fish Farm, Yamatokoriyama, Japan) were artificially fertilized in the Graduate School of Marine Science and Technology, Tokyo University of Marine Science and Technology. The fish were kept in tap water at 26°C and were given a commercially available pellet diet every morning.
Fish that had grown to a weight of approximately 20 g were transferred to Noto Maritime Laboratory at Kanazawa University and used for in vitro experiments.
All experimental procedures were carried out in accordance with the Guide for the Care and Use of Laboratory Animals prepared by Kanazawa University.
2.2. Sequencing of a preprocalcitonin precursor from sardine UBGs
UBG was excised from Japanese sardines (Sardinops melanostictus) and stored in RNAlater® (Sigma-Aldrich, St. Louis, MO, USA). Total RNAs were extracted from the UBGs using a total RNA isolation kit (NucleoSpin RNA II, TaKaRa Bio Inc., Otsu, Japan). The full-length sequence of sardine preprocalcitonin was determined by RACE using the GeneRacer® Kit (Life Technologies, Tokyo, Japan). First-strand cDNA was synthesized from 1 μg of total RNA by reverse transcription using oligo dT adapter primers. The 3’ RACE gene specific primers (5′-GACTCTGAAAGACTGCGCCTTTTTCC-3′) were designed according
15
to the sequence obtained by partial cloning performed previously (Suzuki et al., 1999). PCR fragments were amplified using a 3′ RACE primer and adaptor primer contained in the kit and were sequenced by the ABI PRISMTM 3130 Genetic Analyzer using a 3′ RACE primer. Subsequently, 5′ RACE was
conducted with a 5 ′ RACE primer (5 ′
-GACTCTGAAAGACTGCGCCTTTTTCC-3′) and an adapter primer. The PCR product was subcloned using the pGEM-T Easy (Promega, Madison, WI, USA) and was sequenced with the ABI PRISMTM 3130 Genetic Analyzer using plasmid universal primers.
2.3. Molecular phylogenetic analysis
Molecular phylogenetic analysis was conducted using the method from a previous study (Sekiguchi et al., 2016) with some modifications. Namely, amino acid sequences were aligned using the ClustalW program embedded in MEGA 6.06 software (Tamura et al., 2013). After manually eliminating the gap, alignments were calculated for constructing unrooted phylogenetic trees by analysis using MEGA 6.06 software for the neighbor-joining method. In addition, the bootstrap value was estimated from 1,000 pseudoreplicates using MEGA 6.06
16
software. The sequences of the CT precursors utilized in the analysis are as follows: Japanese medaka, NP_001098365; fugu, CAC81278; Atlantic salmon, NP_001135058; green sea turtle, EMP38282; American alligator, XP_006275102; rock pigeon, EMC88082; chicken, ABY65359; African ostrich, XP_009683015; turkey, XP_003206284; platypus, ENSOANP00000017830;
Tasmanian devil, XP_003773616; nine-banded armadillo, XP_004472573; cattle, NP_001137209; domestic cat, BAO79719; horse, AAF72526; human, AAA58403; rhesus monkey, EHH23079; house mouse, P70160; and Norway rat, AAA40849.
2.4. Peptide synthesis
Sardine CT was donated by the Peptide Institute, Inc. (Osaka, Japan). Sardine N-proCT was synthesized with the Fmoc method using a solid-phase peptide synthesizer (CS36X: CSBio Co., Menlo Park, CA, USA) in accordance with the manufacturer's instructions. Briefly, 0.25 mmol of Fmoc-NH-SAL-PEG resin and 1 mmol of each Fmoc amino acid were utilized for the reaction. Peptides recovered from the reacted resin were purified with an RP-HPLC using a C18 column (Shimadzu LabSolutions: Shimadzu Co., Kyoto, Japan), and the fraction
17
corresponding to the main peak was collected. Mass spectrometric (Ultraflex III:
Bruker Daltonics, Inc., Billerica, MA, USA) analysis of the peptides in the fraction showed a single peak appropriately corresponding to the sardine N-proCT molecular weight.
2.5. Effects of sardine CT and sardine N-proCT on scale osteoblastic and osteoclastic activities using cultured goldfish scales
Scales were excised from goldfish under anesthesia with 0.03% ethyl 3-aminobenzoate methanesulfonic acid salt (Sigma-Aldrich, Inc., St. Louis, MO, USA); aeration was performed using an electric air pump. Using these scales, the effects of both sardine CT and sardine N-proCT on osteoblasts and osteoclasts were investigated using alkaline phosphatase (ALP) and tartrate-resistant acid phosphatase (TRAP) as markers (Suzuki et al., 2000a; Suzuki and Hattori, 2002).
These scales were incubated for 6 hours in Leibovitz's L-15 Medium (Thermo Fisher Scientific Inc., Grand Island, NY, USA) containing a 1%
penicillin-streptomycin mixture (Thermo Fisher Scientific, Inc.), with each peptide added at concentrations of 10-9, 10-8, and 10-7M.
The methods for measuring ALP and TRAP activity are shown below. First, 100
18
μl of alkaline buffer (100 mM Tris-HCl, pH 9.5, 1 mM MgCl2) or acid buffer (0.1 M sodium acetate, 20 mM tartrate, pH 5.3) was added to each well of a 96-well microplate. The scales were then placed in individual wells. This microplate was quickly frozen at -80℃ and stored frozen at -20℃ until analyzed. An alkaline or acidic buffer containing 100 μl of 20 mM para-nitrophenyl phosphate was then added to each well of a microplate with a melted solution of alkaline or acid buffer. The plate was incubated at 23°C for 60 minutes with shaking. After incubation, the reaction was stopped by adding 50 μl of 3N NaOH. After incubation was completed, the reaction was stopped by adding 50 μl of 3N NaOH. One hundred fifty μl of the reacted solution was transferred to a new plate, and the absorbance at 405 nm was measured. ALP activity and TRAP activities were measured by converting the absorbance into the amount of para-nitrophenol (pNP) using the standard pNP curve. Subsequently, ALP and TRAP activities were standardized to the surface area (mm2) of each scale, which was calculated using ImageJ (Suzuki et al., 2009).
2.6. Effects of sardine CT and sardine N-proCT on scale osteoblastic marker mRNA expression using cultured goldfish scales
19
Scales were taken from goldfish under anesthesia with 0.03% ethyl 3-aminobenzoate methanesulfonic acid salt (Sigma-Aldrich). To investigate changes in the genes expressed in osteoblasts in response to sardine N-proCT and sardine CT (10-7 M each), these scales were incubated in Leibovitz's L-15 Medium (Thermo Fisher Scientific, Inc.) containing a 1% penicillin-streptomycin mixture (Thermo Fisher Scientific, Inc.) for 6 hours. After incubation, the scales were stored frozen at -80°C until mRNA analysis.
Total RNAs were isolated from goldfish scales using a total RNA isolation kit for fibrous tissue (QIAGEN GmbH, Hilden, Germany). Complementary DNA was synthesized using a kit (QIAGEN GmbH). In order to investigate the osteoblastic activation of scales by sardine N-proCT treatment, the mRNA expression of osteoblastic markers, type 1 collagen and osteocalcin, was examined. The following gene-specific primers were used: (sense:
5’-TGCAACCAGGATGCCATCAA-3’; antisense:
5’-ATGAGGCGCAGGAAGGTGAG-3’) for type 1 collagen and (sense:
5’-ATGCCTGAGCGCAGGTCTTC-3’; antisense:
5’-CACAGGCCAGGTTTGCTTCA-3’) for osteocalcin (Thamamongood et al., 2012). The EF-1α cDNA was amplified using a primer set (sense:
20
5’-ATTGTTGCTGGTGGTGTTGG-3’; antisense:
5’-GGCACTGACTTCCTTGGTGA-3’) (AB979720). A real-time PCR instrument (Mx3000p, Agilent Technologies, Santa Clara, CA, USA) was used to analyze the PCR amplification (Suzuki et al., 2011; Thamamongood et al., 2012).
The annealing temperature of type 1 collagen, osteocalcin, and IF-1α was 60°C.
Type 1 collagen and osteocalcin mRNA levels were normalized to EF-1α mRNA levels. The annealing temperature was set at 60°C for type 1 collagen, osteocalcin, and EF-1. Type 1 collagen and osteocalcin mRNA levels were normalized to the EF-1 mRNA level.
2.7. Statistical analysis
All results are shown as the means ± SE. The statistical significance between the control and experimental groups was assessed by Student's t-test (in vitro cell activity experiment) or paired t-test (osteoblast marker mRNA expression).
Statistical testing between the control and the experimental groups was conducted using Student’s t-test (in vitro cell activity experiment) or paired t-test (osteoblastic marker mRNA expression). The selected significance level was p <
0.05 in all cases.
21
3. Results
3.1. Sequencing of the preprocalcitonin precursor from sardine UBGs
The sequence of the sardine preprocalcitonin precursor was determined using RACE methods with the RNA of their UBGs. The sardine preprocalcitonin precursor was composed of 134 amino acid residues, including 25 amino acids of signal peptides (Fig. 1). The signal peptide sequence was predicted using the SignalP4 program (Petersen et al., 2011). Sardine procalcitonin was composed of N-proCT (53 amino acids), CT (32 amino acids), and C-proCT (18 amino acids) (Fig. 1).
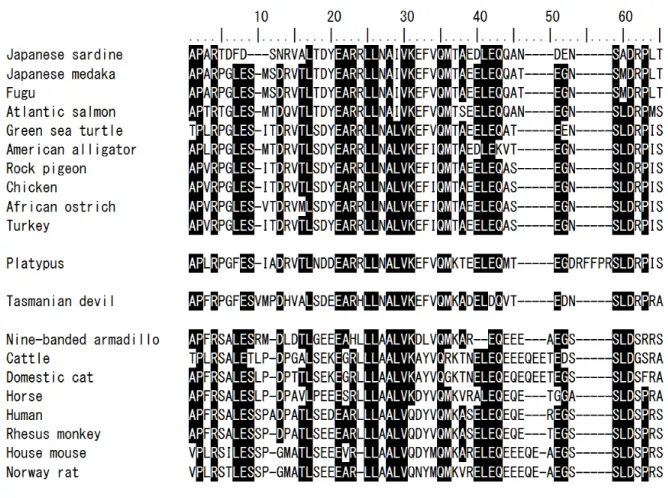
Vertebrate N-proCTs have several common features, as described below (Fig. 2):
1) The leading amino acid residue is predominantly Ala (Thr or Val in some cases); 2) Cys residue is not contained in the N-proCT sequence; 3) 8 residues are well conserved (Lys4, Leu17, Leu25, Leu26, Ala28, Gln35, Ser59, and Asp61) in all N-proCTs; 4) there are insertion/deletion points in the sequence of N-proCT from the 9th to the 11th, from the 46th to the 50th, and from the 54th to the 58th positions.
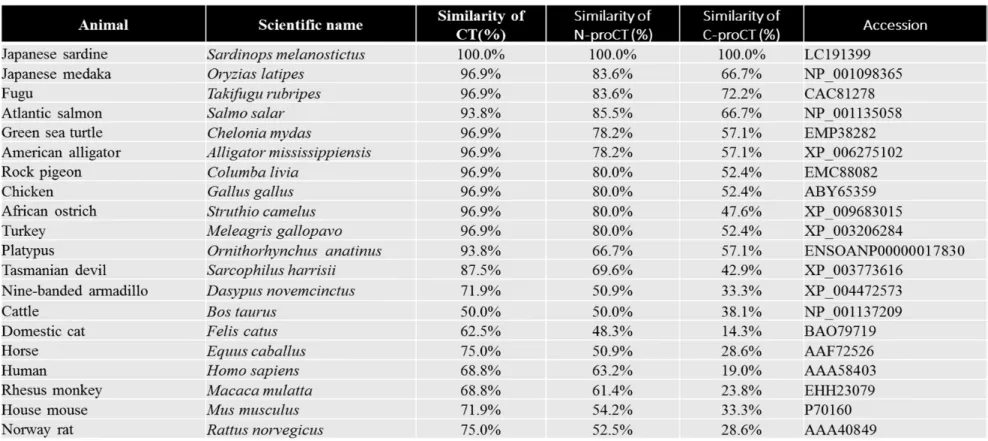
Similar to CT, N-proCT is more highly conserved than C-proCT among vertebrates (Table 1). Specifically, the amino acid sequence of sardine CT was
22
more like that of teleosts, reptiles, and birds (93.8–96.9%) than that of Marsupialia (platypus: 93.8%; Tasmanian devil: 87.5%), and it was relatively different from that of Placentalia (50.0–75.0%) (Table 1). In the same way, the predicted amino acid sequence of sardine N-proCT was more conserved among teleosts, reptiles, and birds (78.2–85.5%) comparing with Marsupialia (platypus 66.7%; Tasmanian devil: 69.6%) and Placentalia (48.3–63.2%) (Table 1).
3.2. Phylogenetic analysis of sardine CT and sardine N-proCT
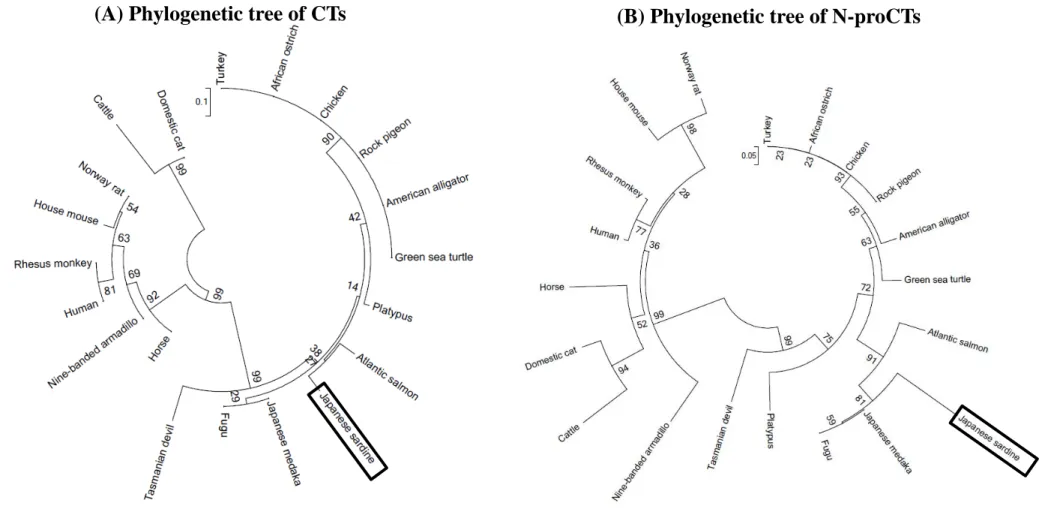
Phylogenetic trees were constructed from sardine CT and sardine N-proCT, together with known CTs and N-proCTs of other animals. The configuration of the molecular phylogenetic tree of N-proCTs was similar to that of CTs (Fig. 3).
Both sardine CT and sardine N-proCT are classified into the group that includes non-mammalian vertebrates and Marsupialia with the high support of bootstrap values. Sardine N-proCT was grouped into the same clade as Atlantic salmon, Japanese medaka, and fugu.
3.3. Effects of sardine CT and sardine N-proCT on scale osteoblastic and osteoclastic activities using cultured goldfish scales
Biological activities of both sardine CT and sardine N-proCT were investigated
23
using a goldfish scale assay system. The results are shown in Figure 4.
Sardine CT did not affect ALP (osteoblast marker enzyme) activity at concentrations of 10-9 to 10-7 M; however, sardine N-proCT increased ALP activity in goldfish scales at a concentration of 10-7 M. In both peptides, ALP activity did not change significantly at concentrations of 10-9 and 10-8 M.
Regarding TRAP activity, sardine CT (10-9 to 10-7 M) affected osteoclasts and inhibited TRAP activity in a dose-dependent manner. However, sardine N-proCT did not alter activity (Fig. 5).
3.4. Effects of sardine CT and sardine N-proCT on scale osteoblastic marker mRNA expressions using cultured goldfish scales
To verify the promoting action of sardine N-proCT in osteoblasts, the expression of osteoblastic marker mRNA in cultured scales was examined.
Results showed that sardine N-proCT (10-7 M) treatment promotes mRNA expressions of osteoblastic markers, such as type 1 collagen and osteocalcin.
However, sardine CT did not affect their expression (Fig. 6).
4. Discussion
The sequence of the full-length sardine preprocalcitonin precursor was
24
determined using the RACE method (Fig. 1). Results showed that sardine procalcitonin was composed of N-proCT (53 amino acids), CT (32 amino acids), and C-proCT (18 amino acids) (Fig. 1). The amino acid sequences of N-proCTs from sardines and other 18 animals were analyzed using MEGA 6.06 software with the neighbor-joining method (Tamura et al., 2013). The molecular phylogenetic tree of CTs and N-proCTs revealed that these peptides are distinguishable between mammals and non-mammals with high bootstrap values (Fig. 3B). It is interesting that CTs and N-proCTs of Marsupialia, which are primitive mammals, are located in the same clade as those of non-mammalian vertebrates (Fig. 3). Sardine N-proCT’s similarity to that of Marsupialia (Platypus: 66.7%; Tasmanian devil: 69.6%) was higher than its similarity to that of Placentalia (50.0–63.2%) (Table 1). A similar relation was found for CT.
Sardine CT was closer to that of Marsupialia (platypus: 93.8%; Tasmanian devil:
87.5%) than to that of Placentalia (50.0–75.0%) (Table 1). Phylogenetic analysis also supported this sequence similarity.
The biological activity of sardine N-proCT was then examined in a goldfish scale in vitro assay system and compared with that of sardine CT. As a result, it was proved for the first time that sardine N-proCT (10-7 M) activates osteoblastic
25
marker enzyme activity; at the same time, sardine CT did not affect osteoblastic marker enzyme activity (Fig. 4). In contrast, sardine CT (10-7 to 10-9 M) suppressed osteoclastic marker enzyme activity, while N-proCT did not affect the enzyme activity (Fig. 5). Furthermore, the mRNA expression of osteoblastic markers (type 1 collagen and osteocalcin) was enhanced by sardine N-proCT (10-7 M) treatment; however, sardine CT did not affect their expression (Fig. 6).
The biological activity of sardine N-proCT observed in this study was supported by a previous report of N-proCT’s mitogenic effect on human osteosarcoma cell lines (Burns et al., 1989b). It was reported that levels of CT and N-proCT in the thyroid increase in parallel in vivo when C-cell hyperplasia is induced with a high-fat diet in rats (Burns et al., 1989a). In addition, in neoplastic C-cell cultures, N-proCT and CT are detected approximately equimolarly in both cell extracts and basal medium; dexamethasone increases both cellular and secreted concentrations of these peptides (Burns et al., 1989a). In light of the report of Burns et al. (1989a, 1989b), it appears that rat N-proCT is present in equimolar amounts with CT and coordinated with CT in vivo and in vitro. N-proCT might act on osteoblasts and regulate bone metabolism in vertebrates, including rats and teleost fish.
26
Many investigators have reported that plasma calcium levels in female teleosts increase markedly during the reproductive period (Watts et al., 1975; Yamauchi et al., 1978; Norberg et al., 1989; Suzuki et al., 2004; Guerreiro et al., 2007).
Estrogen is a hormone considered to be a candidate for causing hypercalcemia.
Estrogen promotes the synthesis of vitellogenin, a major component of egg protein and a calcium-binding protein, in female teleost fish (Kwon et al., 1993;
Tinsley, 1985). At the same time, estrogen promotes calcium resorption from scales by activating osteoclasts (Persson et al., 1995; Suzuki et al., 2000a; Suzuki and Hattori, 2003). It has been reported that when goldfish are injected with estrogen, TRAP and ALP activity in scales (Suzuki and Hattori, 2003) and the plasma calcium level (Suzuki et al., 2003) become elevated. It has been shown that the administration of estrogen to goldfish promotes CT secretion and that estrogen directly acts on UBG, given that an estrogen receptor is present in the UBG (Suzuki et al., 2004). CT functions to suppress the excessive absorption of calcified tissue during the reproductive period in teleosts (Suzuki et al., 2004).
During this period, N-proCT might function effectively in bone formation. That is, both CT and N-proCT cleaved from the precalcitonin precursor appear to affect osteoblasts and osteoclasts and protect against excessive bone resorption,
27
but by different actions.
Due to the very high sensitivity of the scale assay system used in this study, the biological activity of N-proCT could be detected. Furthermore, the parathyroid hormone and prostaglandin E2 are known to function in scale osteoblasts and osteoclasts (Suzuki et al., 2011; Omori et al., 2012). The high sensitivity of the assay system used in this study might be due to the coexistence of osteoblasts, osteoclasts, and the bone matrix (Bereiter-Hahn and Zylberberg, 1993; Suzuki et al., 2000a; Yoshikubo et al., 2005; Redruello et al., 2005; Suzuki et al., 2007;
Ohira et al., 2007; Azuma et al., 2007; Suzuki et al., 2008). Although the mechanism by which N-proCT functions in osteoblasts has not yet been elucidated, a new function of N-proCT in the osteoblasts of teleosts has been discovered. It seems likely that N-proCT binds to a novel receptor in osteoblasts.
Based on the above, we plan to investigate the specific mechanism of N-proCT on osteoblasts using an in vitro assay system with goldfish.
28
Fig. 1. Nucleotide and deduced amino-acid sequences of sardine preprocalcitonin
The deduced amino acid sequence of preprocalcitonin is depicted under the preprocalcitonin cDNA sequence. The signal peptide, N-proCT, CT, and C-proCT are indicated by the dotted underline, box, double underline, and underline, respectively. The stop codon TGA is indicated by an asterisk. This data is available under GenBank accession number LC191399.
29
Fig. 2. Multiple alignments of the amino-acid sequences of N-proCTs
Identical amino acids are shown in black boxes. DDBJ/EMBL/GenBank accession numbers are as follows: Japanese medaka,
NP_001098365; fugu, CAC81278; Atlantic salmon, NP_001135058; green sea turtle, EMP38282; American alligator, XP_006275102;
rock pigeon, EMC88082;chicken, ABY65359; African ostrich, XP_009683015; turkey, XP_003206284; platypus,
ENSOANP00000017830; Tasmanian devil, XP_003773616; nine-banded armadillo, XP_004472573; cattle, NP_001137209; domestic cat, BAO79719; horse, AAF72526; human, AAA58403; rhesus monkey, EHH23079; house mouse, P70160; and Norway rat,
AAA40849.
30
Fig. 3. Phylogenetic tree of CTs and N-proCTs
Phylogenetic trees of CTs (A) and N-proCTs (B) were calculated by the neighbor-joining method. The bootstrap value is shown beside each branch as the percentage of times. Scale bars show an evolutionary distance of 0.1 and 0.05 amino acid substitutions per protein.
(A) Phylogenetic tree of CTs (B) Phylogenetic tree of N-proCTs
31
Fig. 4. Effects of CT (A) and N-proCT (B) on ALP activities in cultured scales incubated for 6 hours
** indicates a statistically significant difference at p < 0.01 from the values of control scales (n = 8).
32
Fig. 5. Effects of CT (A) and N-proCT (B) on TRAP activities in cultured scales incubated for 6 hours
*, **, and *** indicate statistically significant differences at p < 0.05, p < 0.01, and p < 0.001, respectively, from the values of control scales (n = 8).
33
Fig. 6. Effects of CT and N-proCT on type 1 collagen (A: CT; B: N-proCT) and osteocalcin (C: CT; D: N-proCT) mRNA expressions in cultured scales incubated for 6 hours
* and ** indicate statistically significant differences at p < 0.05 and p < 0.01, respectively.
n = 9 samples; one sample from one fish.
34
Table 1. Similarity of sardine CT, N-proCT, and C-proCT to those of others
35
III. Partial characterization of a calcitonin-like substance from the Brockmann bodies of medaka (Oryzias latipes)
36
>
1. Introduction
CT is a peptide hormone that consists of 32 amino acid residues. Administering this hormone to mammals causes hypocalcemia and hypophosphatemia. CT is produced in C cells of the thyroid gland in mammals and in parenchymal cells of the UBG in vertebrates other than mammals (Copp, 1970). On the other hand, it has been reported that CT also functions as a neuromodulator in mammals by suppressing feeding activity or depressing sensitivity to pain (Azria, 1989).
Indeed, there are reports that CT-like substances are produced in nervous systems of vertebrates and invertebrate (Deftos et al., 1978; Azria, 1989; Sasayama et al., 1991b). Also, in embryological studies in mammals and birds, CT-producing cells have been shown to be derived from neural crests (Pearse and Poiak, 1971).
Various neuropeptides are also known to exist in pancreas tissues in teleost fish (Jonsson, 1993). This suggests that CT may be produced in the pancreatic tissue of teleost fish.
Recently, CT-like substances have been reported in the Brockmann bodies of medaka (Oryzias latipes) (Sasayama et al., 1991c). It has also been demonstrated that the Brockmann body extract of medaka shows hypocalcemic and hypophosphatemic activity in rat bioassays. In this study, the biochemical
37
properties of CT-like substances in the Brockmann bodies of medaka were investigated.
2. Materials and Methods
2.1. Preparation of a crudeBrockmann body extract
Approximately 500 medaka (including both sexes) were collected from June 1993 to September 1993 in the suburbs of Toyama City. After anesthetizing the fish with tricaine methanesulfonate diluted 1/3,000, their Brockmann bodies were dissected under a binocular microscope. Dissected Brockmann bodies were immediately frozen and kept at -50°C until used. To analyze the crude extract, Brockmann bodies were boiled with 2 ml of distilled water for 5 minutes to inactivate the proteases. The resulting suspension was immediately cooled with ice and acidified with glacial acetic acid to a final concentration of 1 M. The acid-treated Brockmann bodies were then homogenized at 4°C and centrifuged at 4°C for 10 minutes at 25,000 × g. The supernatant was regarded as a crude Brockmann body extract.
2.2. Reversed-phase high performance liquid chromatography and electrophoresis
38
The Brockmann body crude extract was loaded on a reversed-phase high performance liquid chromatography (RP-HPLC) using an ODS 120 T column (4.6 mm i.d. x 250 mm; Tosoh Co., Ltd., Tokyo, Japan) with a linear concentration gradient of 20% to 80% CH3CN in 0.1% trifluoroacetic acid and fractionated into 20 parts. The obtained fractions (500 μl each) were lyophilized.
These were then solubilized in a lysis buffer containing 4% sodium dodecyl sulfate, 4% 2-mercaptoethanol, 8 M urea, and 10 mM Tris-HCl (pH 6.8) and subjected to electrophoresis (Laemmli, 1970). Separation gels were prepared with a linear concentration gradient of 10% to 20% polyacrylamide.
2.3. Western blotting
The electrophoresed samples were transferred to a polyvinylidene difluoride membrane (Clear Blot Membrane-p; Atto Co., Ltd., Tokyo, Japan) at 16 V/cm for 2.5 hours at room temperature, in accordance with Anderson's method (1984).
Thereafter, the membrane was washed 3 times with a 10-mM phosphate buffer solution containing 0.05% Tween 20 (PBST) adjusted to pH 7.2 with HCl. The membrane was then exposed to PBST containing 1% normal porcine serum for 15 minutes at room temperature to block nonspecific binding to the membrane.
39
The membrane was then treated with salmon CT antiserum (diluted 1/40,000) at room temperature for 12–15 hours. This antiserum was prepared by injecting rabbits with synthetic salmon CT (Teikokuzouki Co., Ltd., Tokyo, Japan) combined with BSA (Sasayama et al., 1986). Unbound antiserum was removed by washing with PBST. Finally, the membrane was immunostained using a labeled streptavidin-biotin kit (Dako Co., Ltd., Tokyo, Japan).
2.4. Rat bioassay
Each fraction (2.5 ml) that showed a positive immune response by Western blotting was divided into 5 samples (500 μl each) and administered to 5 rats by the Uchiyama method (Uchiyama et al., 1978). In order to remove the CH3CN, 500 μl of each fraction was concentrated to 10–20 μl under vacuum, and then vehicle solution (0.9% saline containing 0.1% bovine serum albumin adjusted with HCI to pH 4.6) was added to make up a final volume of 400 µl before administration to rats. The vehicle was also administered to rats as a control.
Blood sampling was performed before (0 hours) and 0.5, 1, 2, and 3 hours after these fractions were administered. Serum Ca and Na levels were measured by atomic absorption photometry (Hitachi-Zeeman 180-70; Hitachi Co., Ltd., Tokyo,
40
Japan). Serum inorganic phosphate (Pi) levels were determined by the modified method of Fiske and Subbarow (1925). Student's t-tests were used to statistically test the obtained data.
3. Results
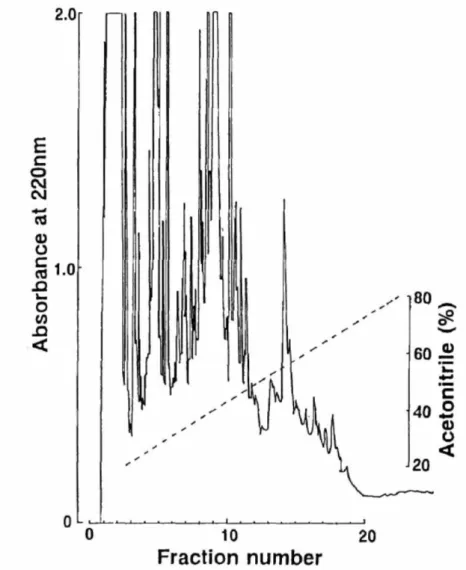
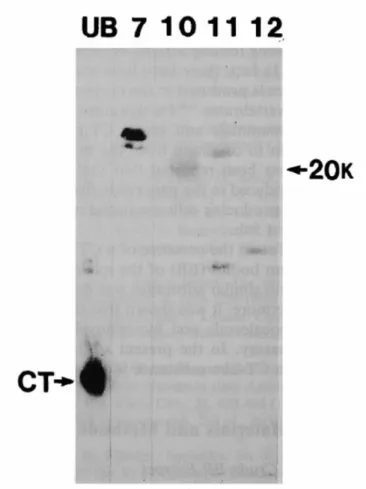
Using HPLC, theBrockmann body crude extract was separated into 20 fractions (Fig. 7). As a result of Western blotting, fractions 7, 10, 11, and 12 eluted with CH3CN concentrations of 30–33%, 39–42%, 42–45%, and 45–48%, respectively, showed positive immunoreactivity (Fig. 8). The MWs of the two immunopositive substances in fractions 7 and 11 were calculated to be 25 and 28 kDa, and 10 and 21 kDa, respectively. In fraction 10, the MW of the immune response-positive substance was 20 kDa, and fraction 12 contained an 11-kDa substance.
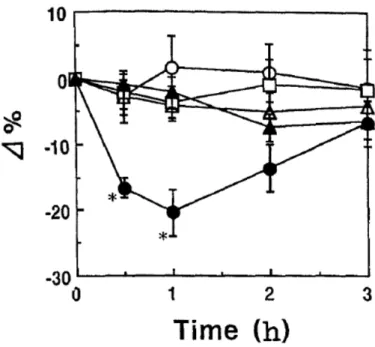
Changes of serum Ca and Pi levels in the rat bioassay are shown in Figures 9 and 10, respectively. Only when fraction 10 was administered was significant hypocalcemia observed 0.5 hours and 1 hour after administration (p < 0.001 and p < 0.001, respectively). The other fractions did not show hypocalcemic activity.
The administration of fraction 10 also caused hypophosphatemia over the entire 3 hours of the analysis period. In contrast, the serum Na concentration showed no
41
change; it was around 330 mg/dl regardless of which fraction was administered.
Considering these results, it was concluded that the MW of the CT-like substance in the medaka Brockmann body is 20 kDa.
4. Discussion
Ultimobranchial and C-cell CTs have been reported to be eluted with RP-HPLC at CH3CN concentrations of 35% to 40% (Noda and Narita, 1976; Buck and Maxl, 1990; Takei et al., 1991; Sasayama et al., 1993; Suzuki et al., 1994). In this study, the immunoreactive fraction obtained with similar concentrations of CH3CN was No. 10. This result shows that the hydrophobicity of the CT-like substance contained in fraction 10 is similar to the genuine CT of other vertebrates. However, the molecular weight of this CT-like substance was estimated to be 20 kDa. Considering that the molecular weight of the CT of other vertebrates is 3.5 kDa, this is considerably higher. Many peptide hormones, such as glucagon, insulin, and peptides YY, PP, and even NPY, have been found in the Brockmann bodies of teleosts (Jonsson, 1993). However, the primary structure homology between CT and these hormones is very low. The specificity of the antisera used in our experiments was confirmed in our previous study (Sasayama
42
et al., 1991b). Therefore, it can be understood that a substance similar to CT is partially contained in a substance of 20 kDa. On the other hand, the MW of the salmon CT precursor is known to be about 18 kDa (Poschl et al., 1978). It has recently been reported that the hepatopancreases of crustaceans such as the Norway lobster, Nephrops norvegicus, and the marine blue crab, Callinectes sapidus, contain salmon CT-like substances with MWs of 22 and 27 kDa, respectively (Van Wormhoudt and Fouchereau-Peron, 1987; Cameron and Thomas, 1992). In addition, it was revealed that the amino acid composition of these substances is similar to that of the human CT precursor (Van Wormhoudt and Fouchereau-Peron, 1987; Cameron and Thomas, 1992). Although the meaning of the CT precursor present in the Brockmann body is not yet clear, it is also possible that the 20-kDa substance obtained in the medaka Brockmann body may be a CT precursor.
43
Fig. 7. Reversed-phase HPLC on an ODS-120T column.
Sample: crude extract of medaka Brockmann bodies; flow rate, 1 ml/min; fraction size, 3 m/tube. Solvent system: linear-gradient elution from 20% to 80% CH3CN in 0.1%
TFA for 60 min.
44
Fig. 8. Molecular weights of immunoreactive calcitonin (CT) in medaka Brockmann body extract. The positive fractions (Nos. 7, 10, 11, and 12) from Western blotting with anti-calcitonin antiserum and extracts of the ultimobranchial glands of stingrays are compared. The arrows show immunoreactive CT of 20 kDa in Fraction 10 and stingray CT.
45
Fig. 9. Changes in serum calcium (Ca) levels in rats after the administration of Fraction 7 (○), 10 (●), 11 (△), 12 (□), or the vehicle (▲).
The vertical bars show the SE. n = 5 for each fraction; n = 6 for the vehicle.
*Significantly different from the value for the vehicle only (p < 0.001)
46
Fig. 10. Changes in serum inorganic phosphorus (Pi) levels in rats after the administration of Fraction 7 (○), 10 (●), 11 (△), 12 (□), or the vehicle (▲).
The vertical bars show the SE. n = 5 for each fraction; n = 6 for the vehicle.
Significantly different from the value for the vehicle: * p < 0.05, **p < 0.01, ***p <
0.005, ****p < 0.001
47
IV. Immunoreactive calcitonin cells in the nervous system of the polychaete Perinereis aibuhitensis
48
1. Introduction
CT is a peptide hormone that consists of 32 amino acids with two N-terminal cysteine residues. CT is produced in C cells of the thyroid gland in mammals and in parenchymal cells of the UBG in vertebrates other than mammals (Sasayama, 1999). CT shows a hypocalcemic activity that is attributed to the suppression of osteoclasts in mammals (Wimalawansa, 1997). It has also been reported that CT suppresses osteoclastic activity in goldfish (fresh water teleosts) (Suzuki et al., 2000a; Sekiguchi et al., 2009) and nibbler fish (marine teleosts) (Suzuki et al., 2000a). In addition, CT has been shown to play a role in the excretion of extra calcium after calcium injections in eels (Suzuki et al., 1999) and stone fish (Kaida and Sasayama, 2003).
On the other hand, CT has been found in various tissues such as intestines, gonads, lungs, and brains of some vertebrates (Azria, 1989). Immunoreactive calcitonin (iCT) has also been found in the central nervous system of several classes of vertebrates (humans: Fischer et al., 1983; rats: Flynn et al., 1981;
pigeons: Galan Galan et al., 1981a; lizards: Galan Galan et al., 1981b; bullfrogs:
Yui, 1983; and lampreys and hagfish: Sasayama et al., 1991a). In addition, CT receptors have been found in the brains of flounders (Suzuki et al., 2000b),
49
stingrays (Suzuki et al., 2012), rats (Becskei et al., 2004), and humans (Bower et al., 2016). These facts suggest that CT has not only calcium regulation but also several neurophysiological functions. CT has an analgesic effect in mammals, which might be caused by elevated plasma β-endorphin levels and interaction with the endogenous opiate system (Hamdy and Daley, 2012).
The CT of a species of protochordate (Ciona intestinalis) consisted of 30 amino acids with two N-terminal cysteine residues, and it had biological activity to suppress the osteoclasts of goldfish (Sekiguchi et al., 2009). Furthermore, this molecule has also been found to be expressed in the neural complex of juveniles (Sekiguchi et al., 2009). These facts suggest that CT may also play some roles in the nervous systems of invertebrates. I chose one species of polychaeata, Perinereis aibuhitensis, as the subject for this study. Since this species is imported from Korea for bait of fishing, it can be collected easily. Therefore, CT-producing cells were studied by an immunohistochemical method. First, I conducted experiments to detect CT-producing cells by immunohistochemical methods. Then, to investigate the biochemical characteristics of the iCT substance, the MW of the substance was examined by Western blotting.
50
2. Materials and Methods 2.1. Animals
Polychaetes sold as fishing bait were purchased from a fishing store. For the purpose of acclimatization, the worms were kept for 3 days in a seawater tank with aeration.
2.2. Detection of iCT cells
The bodies of worms (n = 10) were divided into 12 parts. One part is considered to be composed of nine segments. These parts were fixed with acetic acid-free Bouin’s solution (Okuda et al., 1999) and stored in 70% ethyl alcohol.
Paraffin-embedded tissues were sequentially sectioned at 10 μm using a conventional paraffin-sectioning method. Paraffin sections were incubated with anti-salmon CT polyclonal antibody after deparaffinization treatment (1/100,000 dilution). This antiserum was prepared by injecting synthetic serum CT (Teikokuzouki Co., Ltd., Tokyo, Japan) combined with bovine serum albumin into rabbits. The specificity of this antiserum has been analyzed by enzyme-linked immunosorbent assay (Suzuki, 2001). Paraffin sections were then incubated with biotinylated anti-rabbit immunoglobulin goat antibody (E 432,
51
Dako Japan Co., Ltd., Kyoto, Japan) diluted to 1/2,000. Thereafter, iCT cells were detected using a labeled streptavidin-biotin kit (Dako Japan Co., Ltd., Kyoto, Japan). All incubation processes were done while shaking horizontally.
2.3. Determination of iCT substance
The worms were dissected under a binocular microscope, and the cerebral ganglia were eviscerated. The tissues were immediately frozen and stored at -80°C until use. The protocol for preparing and fractionating the crude extracts is outlined in Figure 11. To inactivate the endogenous protease, ganglia were boiled with 5 ml of distilled water for 10 minutes. The resulting suspension was immediately cooled in ice and acidified by adding glacial acetic acid to a final concentration of 1 M. The acid-treated samples were then homogenized with a glass homogenizer at 4°C and centrifuged at 4°C, 25,000 x g, for 10 minutes.
To remove macromolecular proteins, the crude extract was treated with 66%
acetone. After centrifugation, the low-MW material (less than 2,000) was removed by dialyzing the supernatant with dialysis tubing (Spectra/Por, MWCO 2000, Spectrum Laboratories, Inc., Rancho Dominguez, CA, USA) at 4°C. After freeze-drying, the sample was reconstituted with 1-M acetic acid and then
52
fractionated with ultrafiltration membrane systems into MWs of 3,000 to 10,000 (Centricon, Merck Millipore Corporation, Darmstadt, Germany). In other words, it was filtered by an ultrafiltration membrane with a cut-off MW of 10,000 (Centricon, Merck Millipore Corporation), and the filtered sample was further filtered by an ultrafiltration membrane with a cut-off MW of 3,000 (Centricon, Merck Millipore Corporation).
The fractionated samples (MWs of 3,000 to 10,000) were lyophilized and solubilized in lysis buffer containing 4% sodium dodecyl sulfate, 4%
2-mercaptoethanol, 8-M urea, and 10-mM Tris-HCl (pH 6.8) and then subjected to electrophoresis. Eel CT (Wako Pure Chemical Industries, Ltd., Osaka, Japan) was also subjected to electrophoresis as a positive control. The separation gel was prepared by polyacrylamide with a linear gradient of 10% to 20%. After electrophoresis, the samples in the separation gel were transferred to a polyvinylidene difluoride membrane (Clear Blot Membrane-p; Atto Co., Ltd., Tokyo, Japan) at room temperature for 2.5 hours at 16 V/cm (Suzuki et al., 1995).
Subsequently, the membrane was washed in a 10-mM phosphate buffer solution containing 0.05% Tween 20 (PBST) adjusted to pH 7.2 by adding HCl. The membrane was then immersed (room temperature, 30 minutes) in PBST
53
containing 1% normal swine serum to prevent nonspecific binding of the antibody to the membrane. After washing with PBST, the membrane was then treated with salmon CT antiserum at room temperature for 12–15 hours. To remove unbound antiserum, the membrane was washed with PBST. The membrane was then incubated with biotinylated anti-rabbit immunoglobulin goat antibody (E 432, Dako Japan Co. Ltd., Kyoto, Japan). After washing with PBST, the target protein present on the membrane was detected by immunostaining using a labeled streptavidin-biotin kit (Dako Japan Co. Ltd., Kyoto, Japan).
3. Results
3.1. Detecting iCT-producing cells by immunohistochemical methods
The distribution of iCT-producing cells is illustrated in Figure 12. Most iCT-producing cells (53–70 cells) presented in the cerebral ganglion (Figs. 13A and 13B), the portion including the head. In other parts, iCT-producing cells were found in the subpharyngeal ganglion (4–6 cells). Furthermore, 4 iCT-producing cells were detected in each segment of the ventral nerve cord (Fig. 13C). These iCT-producing cells were found in two pairs—right and left sides—in each segment (Fig. 12).
54
3.2. Analysis of the iCT substance in polychaetes
The outcome of the Western blotting of cerebral ganglia (200 individuals) is shown in Figure 4. The molecular weight of iCT material in this polychaete was shown to be close to that of CT (3.5 kDa) in teleost fish (Fig. 14).
4. Discussion
iCT-producing cells were found not only in cerebral ganglia, but also in subpharyngeal ganglia and ventral nerve cords of the polychaete Perinereis aibuhitensis (Figs. 12 and 13). It has been reported that in a gastropod, Physella heterostropha, synthetic somatostatin and salmon CT promoted the formation of neurite in a dose-related fashion, although some other hormones, such as thyrotropin-releasing hormones, arginine vasotocin, and eledoisin, did not promote neurite outgrowth (Grimm-Jørgensen, 1987). Additionally, in one species of gastropod, Aplysia kurodai, it has been reported that salmon CT affected the neurons of the abdominal ganglion (R 9 and R 10) (Sawada et al., 1993). The study using Aplysia indicated that micropressure-ejected salmon CT caused a slow outward current associated with a decrease in Na+ conductance,
55
resulting in membrane hyperpolarization (Sawada et al., 1993). These results indicate that CT can act as an inhibitory neurotransmitter regulating the firing pattern of major neurons in abdominal ganglia in Aplysia. It is remarkable that, in the present study, iCT-producing cells were also found in the subpharyngeal nerve and ventral nerve cord as well as the central ganglion. Furthermore, this study revealed that these cells are systematically aligned in each body segment (Fig. 12). The arrangement of these iCT-producing cells suggests that the cells have physiological meaning in this worm.
In Aplysia, the extra-cellular micropressure ejection of forskolin (an activator of cyclic adenosine 3',5'-monophosphate) was reported to cause hyperpolarization in the R9 neuron of abdominal ganglia (Sawada et al., 1993). This phenomenon appears to be mediated by a receptor that regulates the increase of intracellular cyclic adenosine 3',5'-monophosphate. In the polychaete Perinereis aibuhitensis, therefore, the iCT substance may act as a neurohormone via the CT receptor because CT increases the intracellular cyclic adenosine 3',5'-monophosphate after binding the CT receptor (Goldring et al., 1993). The sequence of CT family receptors has been determined in invertebrates such as the bivalve mollusk (Crassostrea gigas: Dubos et al., 2003) and chordates (Ciona intestinalis:
56
Sekiguchi et al., 2009; Branchiostoma floridae: Sekiguchi et al., 2016). The CTs of both Ciona intestinalis and Branchiostoma floridae showed biological activity in fish osteoclasts (Sekiguchi et al., 2009; Sekiguchi et al., 2017). In the annelid Capitella teleta, it has been reported that two genes encode CT-like peptides—one encodes a CT-type peptide (31 amino acid residues) with two N-terminal cysteine residues, and the other encodes a diuretic hormone 31-type peptide without two N-terminal cysteine residues (Rowe et al., 2014). The present study revealed that the MW of the iCT substance in this polychaete approximates that of teleost fish CT (3.5 kDa) (Fig. 14). Thus, the iCT substance in Perinereis aibuhitensis may include amino acid residues similar to fish CT and may belong to the CT family.
57
Fig. 11. The procedure for preparing and fractionating crude extracts from cerebral ganglia in the polychaete Perinereis aibuhitensis
Cerebral ganglia were collected from 200 individuals. These ganglia were homogenized and centrifuged. The separated supernatants were treated with 66% acetone and then dialyzed to remove low molecular weight (MW) substances (less than 2,000). Thereafter, the sample was fractionated with an ultrafiltration membrane system into MWs of 3,000 to 10,000.
58
Fig. 12. Schematic drawings showing the distribution and number of immunoreactive calcitonin cells (black spots) in the polychaete Perinereis aibuhitensis
The size of the black spots indicates the strength of the positive reaction.
CG: cerebral ganglion; SG: subpharyngeal ganglion; VNC: ventral nerve cord
59
Fig. 13. Immunoreactive calcitonin (iCT) cells in the polychaete Perinereis aibuhitensis
A: cerebral ganglion (anterior region); B: cerebral ganglion (posterior region); C: ventral nerve cord. Arrowheads indicate iCT cells.
60
Fig. 14. Analysis of an immunoreactive calcitonin (iCT) substance by Western blotting
The molecular weight of the iCT substance in the polychaete Perinereis aibuhitensis was close to that of eel calcitonin (CT) (3.5 kDa) (arrow).
61
V. General Discussion
62
1. Structure and biological activities of N-proCT of Japanese sardines
The present study showed that sardine procalcitonin was composed of N-proCT (53 amino acids), CT (32 amino acids), and C-proCT (18 amino acids). The similarity of the primary structure of the N-proCT of the sardine to that of Marsupialia (Platypus: 66.7%, Tasmanian devil: 69.6%) was higher than to that of Placentalia (50.0–63.2%). A similar relationship was found for CT. As compared with C-proCT, N-proCT has maintained a highly conserved sequence among teleosts, reptiles, and birds, which suggests that N-proCT has a physiological role in those animals. In addition, the secondary structures of sardine N-proCT were predicted based on the position-specific scoring matrices using the Web server PSIPREDICT version 3.3 (Sekiguchi et al., 2016). This prediction revealed that there is an alpha-helix in the secondary structure of N-proCT (Fig. 15). Since N-proCT has features in common with secretin family peptides in having an alpha helix structure, it is strongly believed that N-proCT has a structure as a physiologically active peptide.
Actually, sardine N-proCT (10-7 M) was proven to activate osteoblastic marker