A prospective study of knee pain, low back pain, and risk of dementia:
the JAGes project
Keiko Yamada 1,2,3, Yasuhiko Kubota4, takahiro tabuchi5, Kokoro shirai1, Hiroyasu Iso1, Naoki Kondo6 & Katsunori Kondo7
the aim of this prospective study was to investigate the associations of knee and low back pain with dementia development. Participants were 14,627 older people with no history of stroke, cancer, injuries, depression, parkinson’s disease, or dementia who did not require support for daily living completed self-administered questionnaires with 3-years follow-up. A Cox regression model was used to calculate hazard ratios (HRs) and 95% confidence intervals (CIs) for dementia development.
Stratified analyses by age and regular walking were conducted. Dementia risk was higher in participants aged 65–79 years with knee pain and without low back pain than in those without knee and low back pain [HR: 1.73 (95% CI: 1.11–2.68)]. Dementia risk was lower in participants ≥80 years with low back pain but no knee pain than in those without low back or knee pain [HR: 0.50 (95% CI: 0.31–0.80)].
Participants with knee pain who did not walk regularly had the highest dementia risk [HR: 1.71 (95%
CI: 1.26–2.33)]. Knee pain may increase dementia risk among individuals aged 65–79 years, and may further increase risk in non-regular walkers. Low back pain may be a marker of maintained cognitive function despite age for individuals ≥80 years.
Pain is a major cause of reduced activities of daily living (ADL)1, which can increase dementia risk among older people. Thus, pain may be a dementia risk factor. However, previous study findings on pain and dementia are inconsistent. A prospective cohort study in the United States identified persistent pain as a risk factor for cogni- tive impairment and dementia2, whereas pain was not associated with cognitive decline among older people in a prospective cohort study in the United Kingdom3.
To explain this inconsistency, it may be useful to consider pain sites. Although both knee pain and low back pain can reduce ADL, they may differentially affect cognitive functions, and an investigation of the associations between knee/low back pain and dementia risk may be useful for dementia prevention. The only previous study on pain sites reported that osteoarthritis (OA) was independently associated with increased risk of dementia development4. However, the study did not consider physical activities or psychosocial factors, which are impor- tant for dementia development. Furthermore, no studies have investigated the association between low back pain and dementia risk.
Therefore, the aim of this Japanese prospective cohort study was to examine the associations of knee pain and low back pain with dementia development, considering physical activities, psychosocial factors, and differences in underlying mechanisms of knee/low back pain.
1Public Health, Department of Social Medicine, Osaka University Graduate School of Medicine, Suita, Japan.
2Department of Anesthesiology and Pain Medicine, Juntendo University faculty of Medicine, tokyo, Japan.
3Department of Psychology, McGill University, Montreal, canada. 4Osaka center for cancer and cardiovascular Diseases Prevention, Osaka, Japan. 5cancer control center, Osaka international cancer institute, Osaka, Japan.
6Departments of Health education and Health Sociology, the School of Public Health, the University of tokyo, tokyo, Japan. 7Department of Social Preventive Medical Sciences, center for Preventive Medical Sciences, chiba University, chiba, Japan. correspondence and requests for materials should be addressed to K.Y. (email: keiko- [email protected])
Received: 18 March 2019 Accepted: 9 July 2019 Published: xx xx xxxx
opeN
Methods
study population. We mailed self-administered questionnaires to older residents (aged ≥65 years) iden- tified from official residential registers of 30 local governments throughout Japan at baseline in 2013. The ques- tionnaires assessed the experience of knee pain and low back pain. Participation was voluntary. The response rate was 71.5%, which is comparable to other surveys of community-dwelling residents. Respondents were linked to the national long-term care insurance registry, which includes information about cognitive impairment based on in-home assessment by trained investigators (e.g. public health nurses)5. Under the Long-Term Care Insurance Act, all local governments in Japan retain data on cognitive impairment for all applicants of the national long- term care program.
We identified 17,290 participants who completed the questionnaires and did not received benefits from the national long-term care insurance at baseline. We excluded 1,745 participants with a history of stroke, cancer, injuries, depression, or Parkinson’s disease, dementia at baseline, and we also excluded 918 participants who reported a need for support for daily living or who had missing ADL data. Data from 14,627 participants were analysed. None of the participants had a documented disability.
Knee pain and low back pain. We used two simple sequential yes/no questions to detect knee pain and low back pain.
Knee pain. “Have you had any pain around your knee during the last year? (yes)” and “Has your knee pain inter- fered with your daily activities? (yes)” defined knee pain.
Low back pain. “Have you had any pain around your low back during the last year? (yes)” and “Has your low back pain interfered with your daily activities? (yes)” defined low back pain.
Adjusted variables. Demographic factors. These were age (65–69, 70–74, 75–79, 80–84, or ≥85 years), sex, body mass index (10 percentiles), alcohol consumption (non-drinker, ex-drinker, or drinker), smoking (non-smoker, ex-smoker, or smoker), and history of diabetes mellitus and hypertension (yes or no).
The following single questions were used to measure drinking and smoking status: “Do you drink alcohol?
–‘Yes’, ‘Ceased drinking’, or ‘No’” and “Do you smoke? –‘Yes’, ‘Ceased smoking’, or ‘No’.”
Socioeconomic factors. Education (<6 years, 6 to <9 years, 9 to <12 years, or ≥12 years), marital status (mar- ried, divorced, single, widowed, or other), income divided into quartiles of equivalised income in 2012, including tax: Q1 (men <1.31; women <1.23), Q2 (men 1.31–1.93; women 1.23–1.70), Q3 (men 1.94–2.46; women 1.71–
2.46), Q4 (men 2.47–3.19; women 2.47–3.20), and Q5 (men >3.19; women >3.20) million Japanese yen [JPY]), employment status (employee, retired, or unemployed), loss events (loss of spouse, family member, close friend, or relative; yes or no), frequency of social interaction (≥4 per week, 2–3 per week, once a week, 1–3 per month, several times per year, or never), and frequency of going out (≥4 per week, 2–3 per week, once a week, 1–3 per month, several times per year, or never). Equivalised income was calculated by dividing the median value of the multiple-choice annual household income by the square root of the number of people living together. The annual household income question had 15 categories (<0.5, 0.5–0.9, 1–1.4, 1.5–1.9, 2.0–2.4, 2.5–2.9, 3.0–3.9, 4.0–4.9, 5.0–5.9, 6.0–6.9, 7.0–7.9, 8.0–8.9, 9.0–9.9, 10.0–11.9, and >11.9 million JPY). We defined low income as less than 1.22 million JPY of equivalised income above the poverty line in Japan in 20156.
Psychological factor. Mood or anxiety disorder (yes or no). When participants had 13 points or more in the Kessler Psychological Distress Scale (K6), they were considered to have mood or anxiety disorder7.
Others. We additionally adjusted for knee pain or low back pain when we used low back pain or knee pain as a main exposure, respectively.
Definition of dementia development. We used data from a standardized in-home assessment carried out under the national long-term care insurance scheme established in 20005. The primary assessment was con- ducted for applicants of the long-term care program by trained investigators dispatched from the certification committee in each municipality. During home visits, each applicant was assessed on their ADL and instrumental ADL status, cognitive function (e.g. short-term memory, orientation, and communication) and the presence of mental and behavioural disorders using a standardized government assessment manual8.
Cognitive disability grade was categorized into eight levels: 0, I, IIa, IIb, IIIa, IIIb, IV, and M (0 = Independent, M = Needs constant treatment in a specialized medical facility). This cognitive impairment categorization strongly correlated with Mini-Mental State Examination scores (Spearman’s rank correlation r =−0.73, p < 0.001)9, and ‘level I’ corresponded with a 0.5 point rating on the Clinical Dementia Rating scale (specificity and sensitivity, 0.88)10.
The certification committee also asked a panel of physicians to independently assess the applicants’ cognitive disability levels to determine the applicants’ care requirements11. The medical assessment was conducted inde- pendently of the in-home assessment11. In our analysis, we used the in-home assessment, but a previous study using some of the JAGES data found a high correlation between in-home assessment and the committee medical assessment (Pearson’s correlation r = 0.80, p < 0.001)12.
We defined cases more than IIa as dementia development, as validated by a previous study13. The stand- ardized assessment manual for the cognitive disability in older people defines IIa as “individuals who had dementia-related symptoms, behavioural disturbance and/or difficulty in communication that limited daily living outside the home, but who were capable of daily living under someone’s care”8.
Definition of regular walking. We assessed average walking time per a day (<30, 30–59, 60–89, and ≥90 minutes), and we defined walking time per a day ≥30 minutes as regular walking.
statistical analysis. We calculated person-months of follow-up from baseline to the first endpoint: demen- tia, death, moving away from the local government area where they were registered, loss to follow-up, or admin- istrative censoring at February 21, 2017.
Multivariable adjusted hazard ratios (HRs) with 95% confidence intervals (CIs) for dementia development according to existence of knee/low back pain were calculated using a Cox regression model. We also reran the main model after stratifying participants by age group or regular walking. As a sensitivity analysis, we reran the models after excluding participants suspected of mood or anxiety disorder (K6 ≥ 13 points) and those with both knee and low back pain.
P-values < 0.05 (two-tailed tests) were considered statistically significant. All statistical analyses were per- formed using SAS version 9.4 (SAS Institute Inc., Cary, NC, USA).
statement of ethics. All procedures were in accordance with the ethical standards of the Helsinki Declaration of 1975, as revised in 2013. All respondents were regarded as having provided their informed consent by returning the questionnaire. The Japan Gerontological Evaluation Study was approved by the Nihon Hukushi University Institutional Review Boards on human research (No. 13–14; date of approval: August 6, 2013). The title of the research was “The Japan Gerontological Evaluation Study (JAGES) project: the population-based large cohort.”
Results
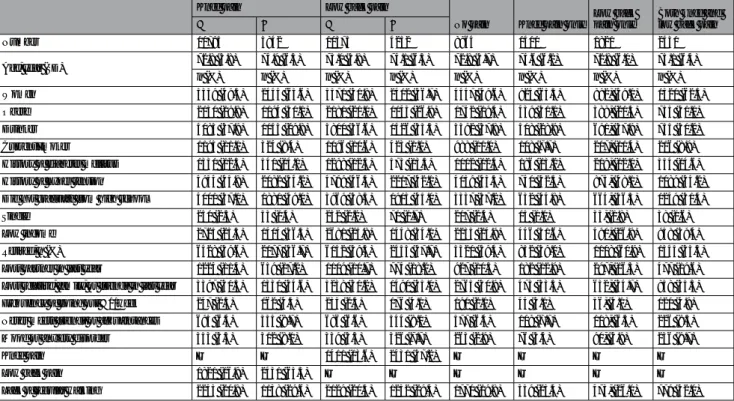
Table 1 shows the mean values and proportions for participant characteristics according to existence of knee pain or low back pain, and according to no pain, knee pain only, low back pain only, and both knee pain and low back pain during the past year. Compared with participants without knee pain or low back pain, those with knee pain or low back pain were more likely to be obese; to have high blood pressure, low income, and mood or anxiety disorder; to have lost a partner, relative, family, or friends in the last year; to go out less than once a week; and were less likely to be single, meet friends or acquaintances, and walk regularly.
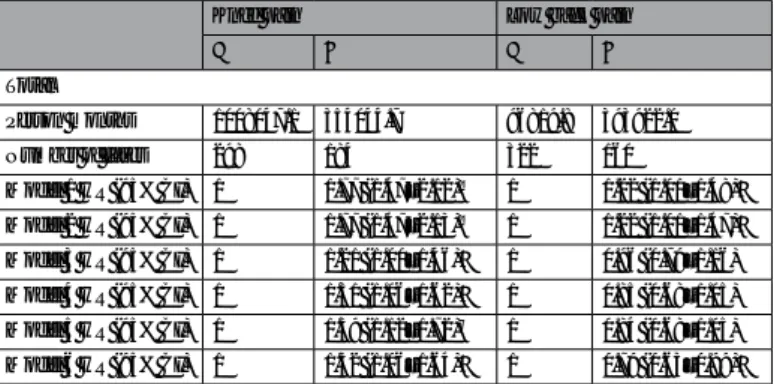
In total, 482 (3.3%) developed dementia during follow-up. Table 2 shows the multivariable HRs for dementia development according to existence of knee or low back pain. Compared with participants without knee pain, those with knee pain had increased risk of dementia development [Model 6, HR 1.32 (95% CI: 1.06–1.64)].
In contrast, those with low back pain had decreased risk of dementia development compared with those without low back pain [Model 6, HR 0.79 (95% CI: 0.63–0.99)]. In model 1 and model 2 (the crude model and the sex-adjusted model), those with low back pain had an increased risk of dementia development. However, after adjusting for age, those with low back pain had a decreased risk of dementia development compared with those without low back pain. Therefore, we calculated HRs of dementia stratified by age group (Table 3). Both knee pain and low back pain increased the dementia risk among individuals aged ≤79 years, and decreased the dementia risk among individuals aged ≥80 years after adjusting for knee pain and low back pain.
Knee pain Low back pain
No pain Knee pain only Low back
pain only Both knee and low back pain
− + − +
Number 10785 3842 10375 4252 8964 1411 1821 2431
Age, year (SD) 72.8 (5.8) 74.9 (6.3) 73.0 (5.8) 74.1 (6.3) 72.8 (5.7) 74.6 (6.2) 72.8 (6.0) 75.1 (6.4)
n (%) n (%) n (%) n (%) n (%) n (%) n (%) n (%)
Women 5339 (49.5) 2444 (63.6) 5371 (51.8) 2412 (56.7) 4447 (49.6) 924 (65.5) 892, (49.0) 1520 (62.5)
Obese 2130 (19.8) 1194 (31.1) 2181 (21.0) 1143 (26.9) 1742 (19.4) 439 (31.1) 388, (21.3) 755 (31.1)
Drinker 4083 (37.9) 1143 (29.8) 3800 (36.6) 1426 (33.5) 3392 (37.8) 408 (28.9) 691, (37.9) 735 (30.2) Current smoker 1195 (11.1) 324 (8.4) 1096 (10.6) 423 (1.0) 988 (11.0) 108 (7.7) 207, (11.4) 216 (8.9) History of diabetes mellitus 1331 (12.3) 540 (14.1) 1298 (12.5) 573 (13.5) 1112 (12.4) 186 (13.2) 219, (12.0) 354 (14.6) History of hyper tension 4934 (45.8) 2082 (54.2) 4799 (46.3) 2217 (52.1) 4059 (45.3) 740 (52.5) 875, (48.1) 1089 (55.2) Did not graduate from high school 4001 (37.1) 1881 (49.0) 3969 (38.3) 1913 (45.0) 3337 (37.2) 632 (44.8) 664, (36.5) 1249 (51.4)
Single 250 (2.3) 53 (1.4) 232 (2.2) 71 (1.7) 217 (2.4) 15 (1.1) 33, (1.8) 38 (1.6)
Low income 2725 (25.3) 1404 (36.5) 2681 (25.8) 1448 (34.1) 2235 (24.9) 446 (31.6) 490, (26.9) 958 (39.4) Retired, n (%) 6428 (59.6) 2177 (56.7) 6152 (59.3) 2453 (57.7) 5320 (59.4) 832 (59.0) 1108 (60.9) 1345 (55.3) Lost partner in last year 1224 (11.4) 659 (17.2) 1109 (10.7) 774 (18.2) 927 (10.3) 182 (12.9) 297, (16.3) 477 (19.6) Lost relative, family, or friends in last year 3397 (31.5) 1331 (34.6) 3238 (31.2) 1490 (35.0) 2765 (30.9) 473 (33.5) 632, (34.7) 858 (35.3) Frequency of going out <1/week 247 (2.3) 162 (4.3) 235 (2.3) 176 (4.1) 191 (2.1) 44 (3.1) 56, (3.1) 120 (4.9) Never meets friends or acquaintances 695 (6.4) 335 (8.7) 686 (6.6) 344 (8.1) 577 (6.4) 109 (7.7) 118, (6.5) 226 (9.3) Mood or anxiety disorder 353 (3.3) 312 (8.1) 339 (3.3) 326 (7.7) 263 (2.9) 76 (5.4) 90, (4.9) 236 (9.7)
Knee pain — — 1411 (13.6) 2431 (57.2) — — — —
Low back pain 1821 (16.9) 2431 (63.3) — — — — — —
Lack of regular walking 2243 (20.8) 1138 (29.6) 2129 (20.5) 1252 (29.4) 1770 (19.8) 359 (25.4) 473, (26.0) 779 (32.0)
Table 1. Mean values and proportions for participant characteristics. Abbreviations: SD: standard deviation.
Note: Definition of obese: body mass index ≥25.
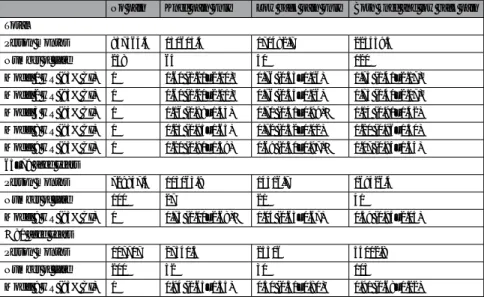
Table 4 shows the multivariable HRs for dementia development according to no pain, knee pain only, low back pain only, and both knee pain and low back pain during the past year stratified by age group; 65–79 and ≥80 years old. Participants with knee pain only aged 65–79 years had an increased risk of dementia development [Model 9,
Knee pain Low back pain
− + − +
Total
Person months 1008047.1 354044.7 96819.8 393922.0
Number of cases 298 184 322 160
Model 1 HR (95% CI) 1 1.77 (1.47–2.12)‡ 1 1.22 (1.01–1.48)*
Model 2 HR (95% CI) 1 1.77 (1.47–2.13)‡ 1 1.22 (1.01–1.47)*
Model 3 HR (95% CI) 1 1.21 (1.00–1.46)* 1 0.96 (0.79–1.16) Model 4 HR (95% CI) 1 1.31 (1.06–1.62)* 1 0.85 (0.68–1.05) Model 5 HR (95% CI) 1 1.39 (1.12–1.72)† 1 0.84 (0.68–1.05) Model 6 HR (95% CI) 1 1.32 (1.06–1.64)* 1 0.79 (0.63–0.99)*
Table 2. Hazard ratios for dementia development according to knee pain and low back pain. Model 1: Crude model. Model 2: Adjusted for sex. Model 3: Adjusted for sex and age. Model 4: Adjusted for above-mentioned variables plus knee pain or low back pain. Model 5: Adjusted for above-mentioned variables plus body mass index, alcohol consumption, smoking, history of diabetes mellitus, and history of hyper tension. Model 6:
Adjusted for above-mentioned variables plus education, marital status, equivalised income, employment status, loss events, frequency of going out, frequency of social interaction and mood or anxiety disorder. Abbreviations:
HR: hazard ratio, CI: confidence interval. *p < 0.05, **p < 0.01.
p for interaction
Knee pain
p for interaction
Low back pain
− + − +
65–69 aged years
Person months — 345697.9 80076.4 — 315241.7 110532.7
Number of cases — 30 4 — 29 5
Model 2 HR (95% CI) — 1 N/A — 1 N/A
Model 7 HR (95% CI) — 1 N/A — 1 N/A
70–74 aged years
Person months — 329330.5 105478.5 — 318097.8 116711.2
Number of cases — 38 25 — 41 22
Model 2 HR (95% CI) p = 0.01 1 2.09 (1.26–3.49)† p = 0.02 1 1.47 (0.88–2.47)
Model 7 HR (95% CI) p = 0.02 1 2.04 (1.14–3.64)* p = 0.02 1 1.41 (0.93–2.15)
75–79 aged years
Person months — 199995.7 86935.5 — 199571.9 87359.30
Number of cases — 53 39 — 57 35
Model 2 HR (95% CI) — 1 1.72 (1.13–2.62)* — 1 1.41 (0.92–2.15)
Model 7 HR (95% CI) — 1 1.63 (1.01–2.64)* — 1 1.11 (0.68–1.80)
80–84 aged years
Person months — 94293.8 55026.1 — 95807.3 53512.60
Number of cases — 91 51 — 95 47
Model 2 HR (95% CI) — 1 0.93 (0.66–1.32) — 1 0.87 (0.62–1.24)
Model 7 HR (95% CI) — 1 0.99 (0.67–1.47) — 1 0.88 (0.59–1.30)
85–89 aged years
Person months — 31497.3 20941.6 — 32105.7 20333.30
Number of cases — 59 44 — 72 31
Model 2 HR (95% CI) — 1 1.11 (0.75–1.65) — 1 0.67 (0.44–1.03)
Model 7 HR (95% CI) — 1 1.45 (0.94–2.25) — 1 0.56 (0.35–0.90)*
≥90 aged years
Person months — 7231.8 5586.7 — 7345.5 5473.00
Number of cases — 27 21 — 28 20
Model 2 HR (95% CI) — 1 1.15 (0.64–2.09) — 1 1.03 (0.58–1.84)
Model 7 HR (95% CI) — 1 1.18 (0.60–2.33) — 1 0.95 (0.49–1.85)
Table 3. Hazard ratios of dementia stratified by age group. Model 2: Adjusted for sex. Model 7: Adjusted for sex and knee pain or low back pain. Abbreviations: HR: hazard ratio, CI: confidence interval. *p < 0.05, **p < 0.01.
HR 1.73 (95% CI: 1.11–2.68)]. Those with low back pain aged ≥80 years had a decreased risk of dementia devel- opment [Model 9, HR 0.50 (95% CI: 0.31–0.80)].
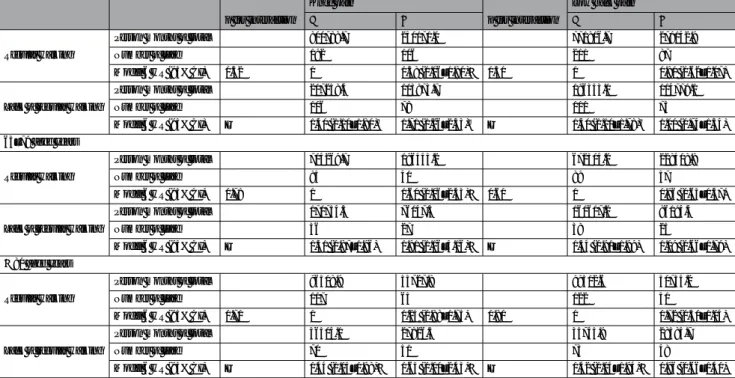
Table 5 shows the multivariable HRs for dementia development stratified by regular walking. The associations of knee pain and low back pain with dementia risk were similar to the main results, regardless of regular walk- ing. Individuals aged 65–79 years and ≥80 years who did not walk regularly and had knee pain had the highest dementia risk of the four groups (with/without knee pain; regular walking/no regular walking) [Model 6, HR:
1.91 (95% CI: 1.16–3.16), and HR: 1.63 (95% CI: 1.10–2.43), respectively]. Participants who experienced low back pain and did not walk regularly did not have an increased risk of dementia development compared with those with no low back pain who walked regularly.
The sensitivity analysis showed similar results to the main results (data not shown).
Discussion
In this sample of the Japanese general population, knee pain was prospectively associated with increased risk of dementia development particularly in individuals aged 65–79 years. The increased dementia risk in these individuals may be enhanced if they do not walk regularly. Low back pain was associated with reduced risk of dementia development among individuals ≥80 aged years, independent of physical activity, socioeconomic and psychosocial factors.
Knee pain among older people, which is usually caused by OA, is associated with inflammation14,15. Persistent inflammation damages cerebral blood vessels and induces neuroinflammation14,15. Research shows that both vas- cular dementia and Alzheimer’s dementia are caused by inflammation14,15. Individuals with knee pain are likely to have a high sedative load, which can increase dementia risk. However, we suggest that knee pain (possibly accompanied by inflammation) itself, as well as physical inactivity, might increase dementia risk. Inflammation also contributes to some subtypes of low back pain, but the prevalence of inflammatory low back pain in one population-based study was only 5–6%16.
A previous cohort study in Taiwan reported an association between OA and dementia development4. However, this previous observational study had several limitations. First, it used data from a health insurance database based on physicians’ diagnoses in medical settings, and included only patients visiting hospitals or clin- ics; thus, the study did not consider individuals who had knee pain but did not consult a doctor. Second, this previous study did not account for socioeconomic and psychosocial factors in addition to physical activity; all of these are important risk factors for dementia. The present study did not have these limitations.
Approximately 85% of low back pain is a non-specific type of pain related to central nerve system17. A system- atic literature review reported that OA pain including knee pain was also associated with central nerve system18. For a person to perceive a centralized pain, it is necessary for the prefrontal brain area to pay “sustained attention”
to the pain19, and sustained attention requires maintaining a certain level of brain function. For example, patients with cognitive disorder owing to dementia or Parkinson’s disease often have decreased sustained attention20,21. Participants with low back pain aged ≥80 years had a decreased risk of dementia compared with those without low back pain. These findings may suggest that experiencing low back pain may be a marker of relatively main- tained brain function among old-old people. We found that participants aged 65–79 years with knee pain only
No pain Knee pain only Low back pain only Both knee and low back pain Total
Person months 837564.4 130605.4 170482.7 223439.3
Number of case 258 64 40 120
Model 1 HR (95% CI) 1 1.60 (1.21–2.10)‡ 0.76 (0.55–1.06) 1.75 (1.41–2.17)‡ Model 2 HR (95% CI) 1 1.60 (1.21–2.11)‡ 0.76 (0.55–1.06) 1.75 (1.41–2.17)‡ Model 3 HR (95% CI) 1 1.16 (0.88–1.53) 0.71 (0.51–0.99)* 1.14 (0.91–1.42) Model 8 HR (95% CI) 1 1.25 (0.95–1.65) 0.72 (0.52–1.02) 1.20 (0.96–1.50) Model 9 HR (95% CI) 1 1.20 (0.91–1.59) 0.69 (0.50–0.97)* 1.07 (0.84–1.34) 65–79 aged years
Person months 729847.4 103063.9 14516.7 169426.4
Number of case 100 27 21 41
Model 9 HR (95% CI) 1 1.73 (1.11–2.68)* 1.04 (0.65–1.67) 1.39 (0.94–2.05)
≥80 aged years
Person months 107717 27541.5 25306 54012.8
Number of case 200 52 30 103
Model 9 HR (95% CI) 1 0.94 (0.65–1.35) 0.50 (0.31–0.80)† 0.91 (0.68–1.22)
Table 4. Hazard ratios of dementia development according to no pain, knee pain only, low back pain only, and both knee pain and low back pain during the past year stratified by age group. Model 1: Crude. Model 2:
Adjusted for sex. Model 3: Adjusted for sex and age. Model 8: Adjusted for above-mentioned variables plus body mass index, alcohol consumption, smoking, history of diabetes mellitus, and history of hyper tension. Model 9: Adjusted for above-mentioned variables plus education, marital status, equivalised income, employment status, loss events, frequency of going out, frequency of social interaction, and mood or anxiety disorder.
Abbreviations: HR, hazard ratio; CI, confidence interval. *p < 0.05, ‡p < 0.001.
had an increased risk of dementia, but those aged ≥80 years did not. Although inflammation related to knee pain may increase dementia risk, experiencing knee pain may be associated with maintained brain function particularly for old-old people; thus, old-old people (unlike other generations) may not have an increased risk of dementia.
One of the strengths of the present study is that we used a community-based prospective large cohort study design. However, the study has several limitations. First, data on the development of dementia were obtained from the results of an examination and assessment for a national Long-Term Care scheme. Residents aged ≥40 years with specific diseases and all residents aged ≥65 years can apply for the long-term care program if they wish;
participants with dementia development who did not apply for the national long-term care program were not identified. Therefore, the number of individuals with dementia development might have been underestimated.
Second, we were unable to differentiate dementia type (e.g., vascular or Alzheimer’s dementia). Analysis of patho- logical information may have elucidated the mechanisms underlying the associations found here. Third, we did not measure pain intensity and therefore could not examine dose–response relationships between low back and knee pain and dementia risk. Fourth, we did not collect information about medical treatments. Treatment for pain, dementia, and other comorbidities may affect dementia development; however, we could not examine this potential confounding effect.
In conclusion, knee pain may increase dementia risk among Japanese older people aged 65–79 years, and this increased dementia risk may be enhanced if they do not walk regularly, independent of socioeconimic and psy- chosocial factors. Experience of low back pain may be a marker of maintained cognitive function despite age in old-old people aged ≥80 years, independent of physical activity, socioeconomic and psychosocial factors.
Data Availability
All enquiries should be addressed to the data management committee via e-mail: [email protected]. All JAGES datasets have ethical or legal restrictions for public deposition owing to inclusion of sensitive information from the human participants. Following the regulation of the local governments that cooperated with our survey, the JAGES data management committee has imposed restrictions upon the data.
References
1. Fauth, E. B. et al. Baseline disability in activities of daily living predicts dementia risk even after controlling for baseline global cognitive ability and depressive symptoms. Int. J. Geriatr. Psychiatry 28, 597–606 (2013).
2. Whitlock, E. L. et al. Association between persistent pain and memory decline and dementia in a longitudinal cohort of elders.
JAMA Intern. Med. 177, 1146–1153 (2017).
3. Veronese, N. et al. Pain is not associated with cognitive decline in older adults: A four-year longitudinal study. Maturitas 115, 92–96 (2018).
4. Huang, S. W. et al. Osteoarthritis Increases the Risk of Dementia: A Nationwide Cohort Study in Taiwan. Sci. Rep. 5, 10145 (2015).
p for interaction
Knee pain
p for interaction
Low back pain
− + − +
Regular walking
Person months of total 800788.7 250171.0 771816.7 279142.9
Number of case 192 106 211 87
Model 6 HR (95% CI) 0.52 1 1.38 (1.06–1.80)* 0.51 1 0.81 (0.62–1.07)
Lack of regular walking
Person months of total 207258.4 103873.7 196353.1 114779.1
Number of case 106 78 111 73
Model 6 HR (95% CI) — 1.40 (1.10–1.80)† 1.71 (1.26–2.33)‡ — 1.40 (1.10–1.78)† 1.00 (0.74–1.34) 65–79 aged years
Regular walking
Person months of total 704269.7 196443.2 672304.2 228408.8
Number of case 85 41 89 37
Model 6 HR (95% CI) 0.78 1 1.60 (1.06–2.43)* 0.60 1 0.96 (0.63–1.47)
Lack of regular walking
Person months of total 170754.3 76047.3 160607.2 86194.4
Number of case 36 27 38 25
Model 6 HR (95% CI) — 1.31 (0.87–1.96) 1.91 (1.16–3.16)* — 1.34 (0.91–1.99) 1.09 (0.66–1.79)
≥80 aged years Regular walking
Person months of total 96518.9 53727.8 99512.6 50734.2
Number of case 107 65 122 50
Model 6 HR (95% CI) 0.71 1 1.25 (0.88–1.75) 0.80 1 0.72 (0.50–1.04)
Lack of regular walking
Person months of total 36504.1 27826.5 35745.9 28584.7
Number of case 70 51 73 48
Model 6 HR (95% CI) — 1.44 (1.05–1.98)* 1.63 (1.10–2.43)* — 1.42 (1.04–1.94)* 0.96 (0.66–1.40)
Table 5. Hazard ratios of dementia stratified by regular walking. Model 6: Adjusted for age, sex, body mass index, knee pain or low back pain, alcohol consumption, smoking, history of diabetes mellitus, history of hyper tension, education, marital status, equivalised income, employment status, loss events, frequency of going out, frequency of social interaction, and mood or anxiety disorder. Abbreviations: HR, hazard ratio; CI, confidence interval. *p < 0.05, †p < 0.01, ‡p < 0.001.
5. Tamiya, N. et al. Population ageing and wellbeing: lessons from Japan’s long-term care insurance policy. Lancet (London, England) 378, 1183–92 (2011).
6. The Ministry of Health Labour and Welfare. Comprehensive Survey of Living Conditions, Summary Report 2016, Income etc. of various types of households, Table 10 Yearly trends in poverty rate. Available at, https://www.mhlw.go.jp/english/database/db-hss/
cslc-report2016.html (Accessed: 6th September 2018) (2016).
7. Furukawa, T. A. et al. The performance of the Japanese version of the K6 and K10 in the World Mental Health Survey Japan. Int. J.
Methods Psychiatr. Res. 17, 152–8 (2008).
8. The Ministry of Health Labour and Welfare. Standardized assessment manual for the grade of activity daily living related to dementia among elderly with dementia (in Japanese) (1993).
9. Hisano, S. Kaitei Hasegawa shiki Kan’i Chinou Hyouka Scale (HDS-R), Mini-Mental State Examination (MMSE) to Syōgai Rōjin no Nichijyō Seikatsu Jiritsu do no Kanren ni tsuite (in Japanese). Japanese J. Geriatr. psychiatry 20, 883–891 (2009).
10. Meguro, K. et al. Prevalence of dementia and dementing diseases in the old-old population in Japan: the Kurihara Project.
Implications for Long-Term Care Insurance data. Psychogeriatrics 12, 226–34 (2012).
11. Olivares-Tirado, P. & Tamiya, N. Development of the Long-Term Care Insurance System in Japan. In Trends and Factors in Japan’s Long-Term Care Insurance System 15–42 (Springer, 2014).
12. Hikichi, H. et al. Social capital and cognitive decline in the aftermath of a natural disaster: a natural experiment from the 2011 Great East Japan Earthquake and Tsunami. Lancet. Planet. Heal. 1, e105–e113 (2017).
13. Noda, H., Yamagishi, K., Ikeda, A., Asada, T. & Iso, H. Identification of dementia using standard clinical assessments by primary care physicians in Japan. Geriatr. Gerontol. Int. 1–7 (2018).
14. Heneka, M. T. et al. Neuroinflammation in Alzheimer’ s Disease. 14, 388–405 (2018).
15. Wyss-coray, T. Inflammation in Alzheimer disease: driving force, bystander or beneficial response? 12, 1005–1015 (2006).
16. Weisman, M. H., Witter, J. P. & Reveille, J. D. The prevalence of inflammatory back pain: population-based estimates from the US National Health and Nutrition Examination Survey, 2009–10. Ann. Rheum. Dis. 72, 369–73 (2013).
17. Deyo, R. A., Rainville, J. & Kent, D. L. What Can the History and Physical Examination Tell Us. Ration. Clin. Exam. 268, 760–765 (1992).
18. Lluch, E., Torres, R., Nijs, J. & Van Oosterwijck, J. Evidence for central sensitization in patients with osteoarthritis pain: a systematic literature review. Eur. J. Pain 18, 1367–75 (2014).
19. Mao, C. P. et al. Decreased activation of cingulo-frontal-parietal cognitive/attention network during an attention-demanding task in patients with chronic low back pain. Neuroradiology 56, 903–912 (2014).
20. McGuinness, B., Barrett, S. L., Craig, D., Lawson, J. & Passmore, A. P. Attention deficits in Alzheimer’s disease and vascular dementia. J. Neurol. Neurosurg. Psychiatry 81, 157–159 (2010).
21. Park, M., Hood, M. M., Shah, R. C., Fogg, L. F. & Wyatt, J. K. Sleepiness, parkinsonian features and sustained attention in mild Alzheimer’s disease. Age Ageing 41, 765–770 (2012).
Acknowledgements
The authors thank Dr. Masahiko Shibata, Dr. Daita Kaneda, and Dr. Kenta Wakaizumi for their professional advice. We thank Diane Williams, PhD, from Edanz Group (www.edanzediting.com/ac) for editing a draft of this manuscript. This study used data from the Japan Gerontological Evaluation Study (JAGES), which was supported by MEXT (Ministry of Education, Culture, Sports, Science and Technology-Japan)-Supported Program for the Strategic Research Foundation at Private Universities (2009-2013), the JSPS (Japan Society for the Promotion of Science) KAKENHI Grant Numbers (JP15H01972, JP18390200, JP22330172, JP22390400, JP23243070, JP23590786, JP23790710, JP24390469, JP24530698, JP24683018, JP25253052, JP25870573, JP25870881,JP26285138, JP26882010), Health Labour Sciences Research Grants (H22-Choju-Shitei-008, H24- Junkanki [Seishu]-Ippan-007, H24-Chikyukibo-Ippan-009, H24-Choju-Wakate-009, H25-Kenki-Wakate-015, H25-Choju-Ippan-003, H26-Irryo-Shitei-003 [Fukkou], H26-Choju-Ippan-006, H27-Ninchisyou-Ippan-001, H28-Choju-Ippan-002, H28-Ninchisyou-Ippan-002, H30-Kenki-Ippan-006, H30-Junkankitou-Ippan-004), Japan Agency for Medical Research and Development (AMED) (JP17dk0110017, JP18dk0110027, JP18ls0110002, JP18le0110009, JP19dk0110034), and the Research Funding for Longevity Sciences from National Center for Geriatrics and Gerontology (24-17, 24-23, 29–42, 30-22)). This research was also supported in part by a fellowship to Keiko Yamada from the Astellas Foundation for Research on Metabolic Disorders. The views and opinions expressed in this article are those of the authors and do not necessarily reflect the official policy or position of the respective funding organizations.
Author Contributions
Design and conceptualized study, analyzed the data and drafted the manuscript for intellectual content (K.Y.); and interpreted the data, revised the manuscript for intellectual content (Y.K., T.T., K.S., H.I., N.K. and K.K.).
Additional Information
Competing Interests: The authors declare no competing interests.
Publisher’s note: Springer Nature remains neutral with regard to jurisdictional claims in published maps and institutional affiliations.
Open Access This article is licensed under a Creative Commons Attribution 4.0 International License, which permits use, sharing, adaptation, distribution and reproduction in any medium or format, as long as you give appropriate credit to the original author(s) and the source, provide a link to the Cre- ative Commons license, and indicate if changes were made. The images or other third party material in this article are included in the article’s Creative Commons license, unless indicated otherwise in a credit line to the material. If material is not included in the article’s Creative Commons license and your intended use is not per- mitted by statutory regulation or exceeds the permitted use, you will need to obtain permission directly from the copyright holder. To view a copy of this license, visit http://creativecommons.org/licenses/by/4.0/.
© The Author(s) 2019