correlation with the thickness and volume of the mammary gland
著者 北岡 ひとみ
著者別表示 Kitaoka Hitomi journal or
publication title
博士論文本文Full 学位授与番号 13301甲第4800号
学位名 博士(保健学)
学位授与年月日 2018‑09‑26
URL http://hdl.handle.net/2297/00053131
Creative Commons : 表示 ‑ 非営利 ‑ 改変禁止 http://creativecommons.org/licenses/by‑nc‑nd/3.0/deed.ja
Influence of the menstrual cycle on compression-induced pain during
mammography: correlation with the thickness and volume of the mammary gland
Hitomi Kitaoka MS1,2,Hiroko Kawashima MD1
1Graduate School of Health Sciences, College of Medical, Pharmaceutical and Health Sciences, Kanazawa University, 5-11-80 Kodatsuno, Kanazawa, Ishikawa, 920-0942, Japan
2Department of Radiological Technology, Faculty of Health Science, Suzuka University of Medical Science, 1001-1, Kishioka, Suzuka, Mie, 510-0293, Japan
Abstract
In mammography, breast compression is necessary and an important factor influencing image quality. The purpose of this study was to determine the influence of the menstrual cycle on compression-induced pain during mammography and to evaluate the association between the thickness and volume of the mammary gland and pain. We examined basal body temperature and categorized the menstrual cycle into five phases. We executed breast compression in the craniocaudal view using a customized compression plate, to which we introduced an opening. We measured the thickness of the mammary gland under compression using echography. Immediately after releasing the compression, we evaluated pain using the visual analogue scale. We performed magnetic resonance imaging (MRI) on the same day and measured the volume of the mammary gland. The thickness of the mammary gland, pain, and the volume of the mammary gland were minimal in the late follicular phase and maximal in the late luteal and early follicular phases. It was shown that the changes in the thickness and volume of the mammary gland during the menstrual cycle accounted for the changes in compression-induced pain. On MRI examination of each breast quadrant, the same changes were observed in areas A and C. In area A, it was shown that both the anatomical characteristics and the increase in volume of the mammary gland were associated with pain. We concluded that the late follicular phase constitutes the optimal timing for mammography.
Keywords: Mammography; Menstrual cycle; Compression-induced pain
Introduction
The most common type of cancer affecting Japanese women is breast cancer, and it is believed that 1 in 11 Japanese women will be affected by breast cancer during their lifetime [1]. Breast cancer screening with mammography is standard in Japan; however, there is much hesitation about undergoing mammography because of fear of the pain associated with compression. Additionally, a feeling of turgescence and pain appears before menses; therefore, it is preferable to avoid performing mammography during that time.
Vogal et al. classified the menstrual cycle into five phases: proliferative (days 3–7), follicular phase of differentiation (days 8–14), luteal phase of differentiation (days 15–
20), secretory (days 21–27), and menstrual (days 28–2) [2]. During the luteal phase, progesterone increases and the blood flow in microvessels also increases with a slight proliferation of epithelial cells in the mammary gland tissue. As a result, the interstitial connective tissue of the breasts becomes edematous. Feelings of turgescence and pain, therefore, appear before menses. At the end of menses, these changes reverse and the feeling of turgescence disappears [3].
Many studies have reported changes in breast imaging findings in accordance with the menstrual cycle [4-10]. Using magnetic resonance imaging (MRI), Kuhl et al. evaluated the contrast effect of mammary gland parenchyma according to the menstrual cycle and reported that the contrast effect is at the lowest level during the second week [6]. Delille et al. recommended that breast MRI be performed during the first half of the menstrual cycle (days 3–14) because gadolinium assimilation of normal breast tissue is minimum during this period [9]. Moreover, Amarosa et al. also proved that the contrast effect of mammary gland parenchyma and lesions change according to the phase of the menstrual
cycle [10]. On ultrasound, Onoda et al. compared the degree of strain of mammary gland parenchyma according to the menstrual cycle using elastography. They reported that there was no significant difference among the menstrual phases [11]. Wojcinski et al. reported that healthy volunteers showed elasticity with relatively soft breast parenchyma in the menstrual and follicular phases and harder parenchyma in the luteal phase [12]. There have been few studies, however, regarding changes in compression thickness of the breast parenchyma during mammography according to the phases of the menstrual cycle. The purpose of this study was to determine the influence of the menstrual cycle on compression-induced pain during mammography and to evaluate the association between the thickness and volume of the mammary gland and pain.
Materials and methods
The participants were women with abundant breast parenchyma, aged 22 ± 0.77 years old. They had no experience of pregnancy and childbirth. This study was approved by our Institutional Review Board (IRB), and informed consent was obtained from all participants. Eleven women were evaluated; one person dropped out after a unilateral mammography. Another person was not able to undergo the MRI examination due to orthodontic treatment. As a result, mammography was performed on 21 breasts and MRI was performed on 20 breasts.
First, we monitored body temperature in the oral cavity as soon as possible after the women woke up from at least 4 h of sleep.Accordingly, we determined their menstrual cycle by determining the ovulation day based on when it changed from the high- temperature phase to the low-temperature phase. We classified the menstrual cycle into the five phases shown in Table 1.
During mammography, we executed positioning in the craniocaudal (CC) view during each menstrual phase in each case. We used a commercially available device (MGU- 1000A; TOSHIBA, Tokyo, Japan) and our own compression plate, as described below.
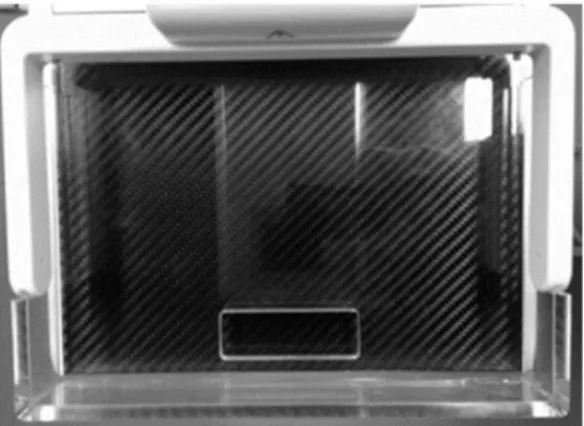
We pierced the compression plate such that the center was at a position 3.5 cm from the chest wall, the area through which an ultrasound probe was to be placed (Fig. 1). Because the participants were young, high breast tissue density was expected and since none of them had voluminous breasts, we set the position that would correspond to the largest volume of mammary gland to 3.5 cm, not 4 cm, from the chest wall. Positioning was executed by a radiological technologist who had received certification for mammography screening from The Japan Central Organization on Quality Assurance of Breast Cancer Screening. The breast was pressed using the customized compression plate until breast compression thickness remained unchanged. We started the measurement from Phase III of the menstrual cycle. We recorded the compression pressure applied during Phase III, and compression was performed using the same pressure in the remaining four phases.
After pressing, we inserted a probe in the hole (Fig. 2) and imaged the echogram to specifically measure the thickness of breast parenchyma. A UIPS-640A instrument (TOSHIBA, Tokyo, Japan) equipped with a 7.5-MHz linear probe was used. We defined an area 2 cm inside from the center of the breast as the “inside”, and 2 cm outside as the
“outside” . We measured the inside and outside thickness of the mammary gland (Fig. 3).
We recorded positional relations of the hole and nipple in Phase III and the measurement was conducted in the same position in the remaining four phases. We calculated the thickness of the mammary gland in each menstrual phase.
Measurement of pain was performed just after the positioning for mammography. We
used the visual analogue scale (VAS), defining the maximum value as 100 (Fig. 4). We also calculated the volume of the mammary gland using MRI. The MRI scan was performed by a radiological technologist on the same day as the positioning for mammography. We attached nifedipine (Adalat capsule, 5 mg; Bayer Yakuhin, Osaka, Japan) to the nipple, which demonstrated a high-intensity appearance on the image. All MRI examinations were performed using a MR-SW-150A 1.5-Tesla device (HITACHI, Tokyo, Japan). We acquired the fat-suppressed, T1-weighted image [repetition time/echo time (TR/TE),639/8 ms; a flip angle, 90°; number of signal averages (NSA), 3; matrix, 320 × 320; field of view (FOV), 320 mm; slice thickness/gap, 4/5.8 mm; number of slices,36] in the prone position. We separated the breast into an upper and lower territory, with the nipples as anchoring points, and further separated it into the inside and outside territory, based on the line connecting the nipple and the midpoint between the two breast side walls (Fig. 5). Next, we calculated the volume of the mammary gland in each quadrant: areas A, B, C, and D. We calculated the mammary gland volume of each quadrant in each menstrual phase using the Sync Measure 3D plug-in for ImageJ (National Institutes of Health, Bethesda, MD, USA). The same radiological technologist performed the measurements in all participants for all five menstrual phases.
The statistical analysis was performed using SPSS Statistics 22 (IBM, Chicago, IL, USA). Using Phase I as the base value, comparisons of the thickness of the mammary gland were analyzed using the paired t test. Measurement of pain between the groups was analyzed using the Tukey–Kramer test. Again, using Phase I as the base value, comparisons of the volume of the mammary gland were analyzed using the paired t test.
A probability value (P value) of < 0.05 was considered statistically significant.
Results
We measured the thickness of the mammary gland, pain on compression during mammography, and the volume of the mammary gland using MRI for each participant during each menstrual phase.
We calculated the thickness of the mammary gland in each menstrual phase (Table 2).
Mammary gland thickness on the inside and outside was the thinnest during Phase III.
There were significant differences between Phases I and II, Phases I and III, and Phases I and IV (Fig. 6a, b). The width of the standard deviation was widened due to individual differences in mammary gland thickness. Based on these results, it was shown that the thickness of the mammary gland was greatest during Phase I and it decreased until Phase III. After Phase III, it increased.
Regarding the pain on compression, we calculated it using the VAS, defining the maximum value as 100. The averages of the VAS for each phase were 69.34 ± 19.86 for Phase I, 51.43 ± 18.75 for Phase II, 46.83 ± 16.47 for Phase III, 53.99 ± 16.92 for Phase IV, and 53.69 ± 21.65 for Phase V. Pain was minimal during Phase III, and there were significant differences between Phases I and II, and between Phases I and III (Fig. 7).
Based on these results, it was shown that pain was at its maximum during Phase I, and it decreased until Phase III. After Phase III, it increased.
Furthermore, regarding the MRI examination, we calculated the volume of the mammary gland in each quadrant. We calculated of the mammary gland volume of each quadrant in each menstrual phase (Table 3, Fig. 8). The width of the standard deviation was widened due to individual differences in mammary gland volume. The total volume of the mammary gland was most decreased during Phase III, and there were significant differences between Phases I and II, Phases I and III, and Phases I and IV.In areas A,
volume was most decreased during Phase III, and there were significant differences between Phases I and II, and between Phases I and III. In areas C, volume was most decreased during Phase III, and there were significant differences between Phases I and II, Phases I and III, and Phases I and IV. In area B, volume was most decreased during Phase II and there was a significant difference between Phases I and II. In area D, volume was most decreased during Phase IV, and there were significant differences between Phase I and all other phases.
Discussion
Although mammography is usually performed for breast cancer screening in Japan, many women forgo the examination to avoid experiencing compression-associated pain.
As women may experience pain and turgescence prior to menses, it is preferable to perform mammography outside that time.
There has been limited research regarding changes in compression thickness of the breast parenchyma during mammography, according to the phases of the menstrual cycle.
Moreover, women undergoing mammography more frequently complain of stronger pain in the CC view than in the mediolateral-oblique view. We examined the influence of the menstrual cycle on mammary gland thickness in the CC view, because of avoidance of the stronger pain performing mammography.
On both the inside and outside views, mammary gland thickness was greatest during Phase I. It decreased after day 4 of menses and it became lowest during Phase III. In Phase V, it increased to a value almost identical to that of Phase I. Pain in the CC positioning became strongest during Phase I, and it decreased after day 4 of menses, becoming weakest during Phase III. Subsequently, it became strong again after ovulation. It was
shown that the change in thickness of the mammary gland during the menstrual cycle accounted for the change in pain on compression.
We measured the change in volume of the mammary gland during the menstrual cycle using MRI. The total volume was most increased during Phase I and most decreased during Phase III. After Phase III, it gradually increased. On examination of each quadrant, areas A and C showed a tendency similar to this. It was shown that the change in volume of the mammary gland during the menstrual cycle accounted for the change in pain on compression. However, in areas B and D, the volume decreased in all phases compared to that of Phase I. Area C was the quadrant most abundant in mammary gland tissue, followed by area A; therefore, it was supposed that changes in areas C and A reflected changes in the total volume of the mammary gland. Accordingly, the change of the inside mammary gland thickness on compression was attributable to area A, and the change of the outside mammary gland thickness was attributable to area C.
It is believed that area A contributes more to the pain on compression than the other quadrants because it is fixed. From our results, it was shown that both the anatomical characteristics and the increase in volume of the mammary gland were involved in pain experienced in area A. It is an essential requirement that the CC view include an adequate portion of the inner region of the breast [13]. However, breast cancer mostly appears in area C [14]. Therefore, it is necessary to depict both the inside and outside of the CC view.
Therefore, it can be concluded that the best time for CC image acquisition is during Phase III, the late follicular phase. In Phase III, the mammary gland is thinnest and most compressible, and pain is at its lowest. Acquiring the mammographic images while paying particular attention to areas A and C is conducive to both pain reduction and lesion detectability.
There are several limitations to our study. First, the number of participants was small.
Second, the participants were all in their twenties. Third, only one radiological technologist performed the positioning for mammography. Further study is needed with a larger sample size with a wider age distribution. Moreover, it is necessary to investigate how the results may change if more than one radiological technologist performs the examinations.
Conclusions
In the CC view, pain was maximum during Phase I and minimal during Phase III.
Correspondingly, the thickness and volume of the mammary gland were maximum during Phase I and minimal during Phase III. The changes in the upper mammary gland greatly contributed to these results. Phase III, the late follicular phase, is the most appropriate phase for mammography. If it is not possible to perform mammography during Phase III, it is necessary to pay particular attention to the upper part of the breast and to conduct proper positioning.
Acknowledgements
The authors thank Nana Hayashi, Marino Hamada, Miki Sakamoto, Haruka Babano, Rika Miyoshi, Rina Konatu,
Yumi Shiroyama, Natumi Kawaguchi, Yuuka Itou, Moe Urata, and Akari Shirasaka for their excellent technical
assistance and kind support.
Compliance with ethical standards
Conflict of interest
The authors declare that they have no conflict of interest.
Ethical approval
All procedures performed in studies involving human participants were in accordance with the ethical standards of the Institutional Review Board (IRB) and with the 1964 Helsinki Declaration and its later amendments or comparable ethical standards. This article does not report any studies involving animals that were performed by any of the authors.
Informed consent
Informed consent was obtained from all individual participants included in the study.
References
1. Latest cancer statistics. National Cancer Center. Center for cancer control and information services. 2012.
http://ganjoho.jp/reg_stat/statistics/stat/summary.html .Accessed 4 Jul 2017.
2. Vogel P, Georgiade N, Fetter B, Vogel F, McCarty KJ. The correlation of histologic changes in the human breast with the menstrual cycle. Am J Pathol.
1981;104:23-34.
3. Sakamoto G. Clinical breast disease. Tokyo: Kanehara; 2006. p. 19-20.
4. Fowler PA, Casey CE, Cameron GG, Foster MA, Knight CH. Cyclic changes in composition and volume of the breast during the menstrual cycle, measured by magnetic resonance imaging. Br J Obstet Gynaecol. 1990;97:595-602.
5. Graham SJ, Stanchev PL, Lloyd-Smith JO, Bronskill MJ, Plewes DB. Changes in fibroglandular volume and water content of breast tissue during the menstrual cycle observed by MR imaging at 1.5 T. J Magn Reson Imaging. 1995;5:695-701.
6. Kuhl CK, Bieling HB, Gieseke J, Kreft BP, Sommer T, Lutterbey G, Schild HH.
Healthy premenopausal breast parenchyma in dynamic contrast-enhanced MR imaging of the breast: normal contrast medium enhancement and cyclical-phase dependency. Radiology. 1997;203:137-44.
7. Muller-Schimpfle M, Ohmenhauser K, Stoll P, Dietz K, Claussen CD. Menstrual cycle and age: influence on parenchymal contrast medium enhancement in MR imaging of the breast. Radiology. 1997;203:145-9.
8. Hussain Z, Roberts N, Whitehouse GH, Garcia-Finana M, Percy D. Estimation of breast volume and its variation during the menstrual cycle using MRI and
stereology. Br J Radiol. 1999;72:236-45.
9. Delille JP, Slanetz PJ, Yeh ED, Kopans DB, Garrido L. Physiologic changes in breast magnetic resonance imaging during the menstrual cycle: perfusion imaging, signal enhancement, and influence of the T1 relaxation time of breast tissue. Breast J .2005;11:236–41.
10. Amarosa AR, McKellop J, Klautau Leite AP, Moccaldi M, Clendenen TV, Babb JS, Zeleniuch-Jacquotte A, Moy L, Kim S. Evaluation of the kinetic properties of background parenchymal enhancement throughout the phases of the menstrual cycle.
Radiology. 2013;268:356-65.
11. Onoda Y, Tsunoda H, Kikuchi M, Nozaki T, Kawauchi N, Ooide S, Saida Y.Influence of menstrual cycle on parenchymal strain in ultrasound elastography of the breast.
Med Ultrason. 2009;36:201–4 (article in Japanese).
12. Wojcinski S, Cassel M, Farrokh A, Soliman AA, Hille U, Schmidt W, Degenhardt F, Hillemanns P. Variations in the elasticity of breast tissue during the menstrual cycle determined by real-time sonoelastography. J Ultrasound Med. 2012;31:63-72.
13. Ishiguri K. Technique of mammography. Tokyo: Iryokagakusya; 2009. p 161.
14. National breast cancer registration of patient survey. Japanese Breast Cancer Society. http://jbcs.gr.jp. Accessed 4 Jul 2017.
Table 1: Classification of the menstrual cycle
Phase Period
I Late luteal and early follicular phase, from 3 days before menstruation to menstruation day 3
Ⅱ Middle follicular phase, from day 4 to the last day of menstruation
Ⅲ Late follicular phase, from the next day after the end of menstruation to the day before ovulation
Ⅳ Ovulatory and early luteal phase, from the day of ovulation until 4 days later
Ⅴ Late luteal phase, from 5 days after ovulation day to 4 days before menstruation
Table2: Mammary gland thickness in each menstrual phase (mm)
Phase
Ⅰ Ⅱ Ⅲ Ⅳ Ⅴ
Inside 31.00 ± 8.39 29.31 ± 8.88
28.37 ±
8.20 29.09 ± 8.38 30.77 ± 8.68 Outside
31.59 ± 8.71 30.43 ± 8.32
29.11 ±
8.53 29.78 ± 8.98 31.64 ± 9.38 Data are expressed as mean values ± standard deviations.
Table3: Mammary gland thickness in each menstrual phase (mm3)
Phase
Ⅰ Ⅱ Ⅲ Ⅳ Ⅴ
A 51241 ±
28754
45074 ± 24571
41134 ± 24241
45057 ± 26841
47490 ± 27598
B 40708 ±
26325
36459 ± 29019
39579 ± 33871
36225 ± 31129
37179 ± 32754
C 52274 ±
31099
45949 ± 25957
42424 ± 26589
45434 ± 28861
48670 ± 32237
D 39738 ±
26265 36474 ±
25092 36877 ±
25624 34585 ±
24058 35397 ± 25333 Total 183961 ±
108911
163955 ± 100689
160013 ± 104939
161301 ± 108573
168737 ± 112486 Data are expressed as mean values ± standard deviations.
Figure legends