A Solution of Front-back Confusion within Binaural Processing by an Estimation Method of Sound
Source Direction on Sagittal Coordinate
Tsuyoshi Usagawa, Atsuya Saho, Kojiro Imamura and Yoshifumi Chisaki Graudate School of Science and Technology, Kumamoto University,
2–39–1 Kurokami, Kumamoto, 860–8555, Japan Email: { tuie, chisaki } @cs.kumamoto-u.ac.jp
Abstract—There are many proposals for binaural processing
models and their applications for a hearing assistance system.
These models attracts attention because of their directional selectivity in frontal direction of user. Not only binaural models but also any of two-element array system have a well know ambi- guity in front-back discrimination which is called as ”front-back confusion” or called as ”cone of confusion” in psychoacoustics.
Recently it was found that spectral cue of sound provides keys to solve this confusion in binaural listening condition and it was also reported the peaks and notches of spectral components play main role to estimate the vertical angle in sagittal coordinate.
In this paper, a new method to estimate sound source direction on sagittal coordinate is proposed in order to solve the front- back confusion. It is implemented on an artificial neural network using interaural level and phase differences as input. The results of simulation using a set of Head Related Transfer Function of dummy head show that the averaged estimation error in quadrant segmentation is less than 1.0% for various types of sound.
5 dB 0 dB -10 dB -20 dB -20 dB -10 dB 0 dB 5 dB
0 -10 -20 -20 -10 0
-90
Whitenoise Pinknoise Female Male Front
Left Right
Back -60
-30 0
30
0 60
Fig. 1. Directional characteristics of the binaural hearing assistance system based on the frequency domain binaural model (FDBM) implemented on a portable device, iPod Touch(R). Set directivity is between−20∼+20◦, but the sensitivity is shown between−160∼ −180◦and+160∼+180◦as the front-back confusion. The system is implemented on iPod TouchR. (Signal:
White noise, pink noise, male speech and female speech at0◦in elevation.
Processing: 16 bits PCM at 8kHz Sampling.)
I. I
NTRODUCTIONThere are many methods to estimate sound source direction based on the binaural signal or two-element microphone array signal. Because of symmetrical configuration of sensors, there are few information to distinguish positions on the circle of ambiguity including front-back’s. A frequency domain binaural model(FDBM)[1] is one of those methods and works on horizontal coordinate system using interaural phase dif- ference(IPD) and interaural level difference(ILD). FDBM is used for binaural hearing assistance system and it works well for frontal half sphere, however it has front-back confusion as shown in Fig.1[2] using a combined microphone and earphone shown in Fig.2.
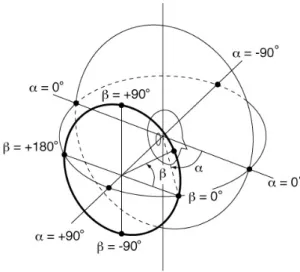
Some studies utilize the sagittal coordinates shown in Fig.
3 using a lateral angle α and a vertical angle β for analyzing the characteristics of spatial hearing[3]. Psychoacoustical ex- periments show that a lateral angle had relations to interaural phase difference (IPD) and interaural level difference (ILD), where a vertical angle contributed to spectral cues in the sagittal coordinate[4]. This evidence provides the chance to solve the front-back confusion by means of modeling the psychoacoustic phenomenon related to spectral cues.
In this paper, an estimation method of sound source direc- tion on sagittal coordinate is proposed using an artificial neural network (ANN)[6] as a solution of front-back confusion. The proposed method can estimate the direction of sound source in whole sagittal coordinate using two ANNs; the first ANN
Fig. 2. Canal type actuator and combined sensor used for an implementation of binaural hearing assistance system whose directivity pattern is shown Fig.1.
Fig. 3. The sagittal coordinate system. A lateral angleαis varied−90∼ +90◦and a vertical angleβis between−180∼+180◦whereα= 0◦for front direction of horizontal plan andβ= 0◦for horizontal plan.
provides only quadrant segmentation, and the second ANN provides lateral and vertical direction of sound source. Also the simplified estimation method of sound source direction is discussed based on quadrant segmentation. The possibility to realize the directional selectivity without front-back confusion is shown.
II. E
STIMATIONM
ETHOD OFS
OUNDS
OURCED
IRECTION INS
AGITTALC
OORDINATE USINGILD
ANDIPD A block diagram of the proposed estimation method of sound source direction using ILD and IPD is shown in Fig.4.
As shown in this figure, this method has three subblocks;
•
Subblock #1: Calculation of IPD and ILD from spectra of left and right channel signals,
•
Subblock #2: Quadrant segmentation of direction as nπ/2 < α < (n + 1)π/2 where (n = − 2, − 1, 0, 1),
•
Subblock #3: Estimation of sound source direction within the estimated quadrant segment.
The feedback type ANN is used for Subblock#2 and Sub- block#3, and an error back propagation algorithm is used for both ANN.
A. Subblock #1: Calculation of IPD and ILD
Spectra L(k) and R(k) of left and right channels are obtained by Fast Fourier Transform (FFT) of the input signals l(n) and r(n), where k is the frequency index. IPD θ(k) and ILD ξ(k) are calculated from L(k) and R(k) for each frequency bin by Eq.(1) and Eq.(2).
θ
lr(k) = tan
−1(Im[C
lr(k)]/Re[C
lr(k)]), (1) ξ
lr(k) = 20 log { C
lr(k)/C
ll(k) } , (2) where C
ll(k) is power spectrum of L(k), and C
lr(k) is defined by Eq.(3) as cross-spectral,
C
lr(k) = L(k)R(k)
∗. (3)
FFT FFT
IPD / ILD IPD / ILD IPD / ILD
・・・ ・・・・・・
○
○
○ ○ ○ ○ ○ ○ ○ ○
ANN ANN ANN ANN
Clasification of quadrant of direction by ANN
Direction of sound source (αʼ ,βʼ ) subblock#1
subblock#2 subblock#3
input signal
l(n) r(n)
input signal
Fig. 4. Block diagram of the method to estimate sound source direction on sagittal coordinate using IPD and ILD.
B. Subblock #2: Quadrant Segmentation of Direction A feed-forward back propagation algorithm[6] is used to train network shown in Fig.5. ANN has three layers: input layer, interlayer, and output layer. Input layer receives L ILD data obtained in Subblock#1 where L is the number of frequency bins. The input layer has L + 1 neurones where L neurones for ILD data and a neuron is used to train the threshold of logistic function receiving the constant 1.0. The number of neurons in the interlayer is fixed to 21 based on the preliminary simulation results.
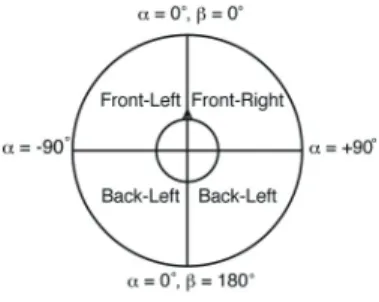
In this method, the quadrant segmentation is performed into four direction as shown in Fig.6 : front-right (FR), front- left(FL), back-right(BR) and back-left(BL). The output layer of ANN for the quadrant segmentation are consists of four neurons which are produced (O
F R, O
F L, O
BR, O
BL). They are bounded between 0 and 1. Table I shows the angle range corresponding to each quadrant segment.
TABLE I
RANGE IN QUADRANT SEGMENTATION.
quadrant lateral angle[◦] vertical angle[◦] OF R,F L,BR,BL
Front-Right 0≤α≤90 −90≤β≤90 1 0 0 0 Front-Left −90≤α <0 −90≤β≤90 0 1 0 0 Back-Right 0≤α≤90 β <−90, 0 0 1 0
90< β
Back-Left −90≤α <0 β <−90, 0 0 0 1 90< β
Training data are pairs of ILD and corresponding segmented quadrant. Sound source is locate on whole spherical direction;
− 90
◦∼ +90
◦of lateral angles and − 180
◦∼ +180
◦of vertical angles.
C. Subblock #3: Estimation of sound source direction on Sagittal coordinate
Like ANN in Subblock #2, a feed-forward back propagation
algorithm is used to train ANN shown in Fig.7. ANN has
three layers: input layer, interlayer, and output layer. Input
O 1
O N
ILD 1
ILD 2
ILD 3
ILD L
1 1
Fig. 5. Structure of ANN for Subblock #2 for each quadrantN. (•: Neurons of input layer,2: interlayer,⃝: output layer.)
Fig. 6. Quadrant segmentation.
layer receives N ILD and N IPD data obtained in Subblock#1 where N is the number of frequency bins. The input layer has 2N + 1 neurones where N neurones for ILD data, N for IPD data, and a neuron is used to train the threshold of logistic function receiving the constant 1.0. The output layer has two neurons; O
αcorresponding to lateral angle and O
βcorresponding to vertical angle. The value of O
αis bounded between 0 and 1 which corresponds to − 90
◦∼ +90
◦, and the value of O
βis between 0 and 1 for − 180
◦∼ +180
◦.
III. S
IMULATIONS
ETUP ANDR
ESULTSA. Setup
Training data are made for the case of a humanoid robot.
In this case, the sampling frequency of the signal is 16 kHz.
Quantization is done in 16 bits. HRTFs of the KEMAR Dummy-Head microphone, which are provided by Nagoya university[7], are measured on sagittal coordinates. Sound source is white noise, and it is located at lateral angles from
− 90
◦to 90
◦and at vertical angles from − 180
◦to 180
◦except at elevation angles under − 50
◦due to the limitation of the measurement equipment’s specifications. Training data which are constructed of training data are made 20 frames for all angles. And input signals are obtained by convolving
O
αO
βIPD
1ILD
1IPD
2ILD
2IPD
NILD
N1 1
Fig. 7. Structure of ANN for Subblock #3 to estimate the direction of sound source using IPD and ILD. (•: Neurons of input layer,2: interlayer, ⃝: output layer.)
white noise with a head related impulse response for the corresponding direction of sound source. The distance between loudspeaker and the center of both ears is 1.0 m. The frame length for the FFT analysis is 512.
B. Estimation Results of Sound Source Direction
Results of lateral angles estimation when a vertical angle of sound source is fixed at − 80
◦, − 40
◦and 0
◦are shown in Fig.8(a), (b) and (c), respectively. Results (a) and (b) show that the proposed method estimate the vertical angle β for whole range; − 180
◦∼ +180
◦with very small error for those lateral angles. The tendency of the estimation error is almost the same except 0
◦of the lateral angle shown in Results (c).
Note that a.
C. Results of Quadrant Segmentation
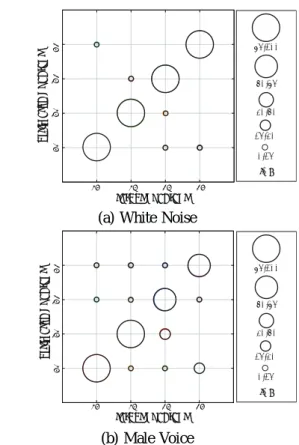
Figure 9 shows the intermediate results in the estimation of sound source direction at Subblock #2; Quadrant segmentation of sound source direction. The vertical and horizontal axes are target quadrant of sound source direction and ones of estimation. The size of the circles corresponds to the ratio of the number of candidates for the sound source against the total number of frames. As shown in this figure, error in quadrant segmentation is small for both type of signals and the averaged error for white noise is less 5.0%.
This results show the possibility that Subblock #1 and #2 can be combined with conventional binaural processing to reduce the front-back confusion.
IV. C
ONCLUSIONThis paper proposed a solution of front-back confusion for
binaural processing by means of estimation method of sound
source direction on the sagittal coordinate using ANN. The re-
sults of simulation show that the front-back confusion is solved
-160 -120 -80 -40 0 40 80 120 160
-160 -120-80 -40 0 40 80 120 160
estimated vertical angles β’[deg.]
target vertical angles β[deg.]
80 60 40 20 0 [ % ]
(a) Lateral angle α = − 80
◦.
-160 -120 -80 -40 0 40 80 120 160
-160-120 -80 -40 0 40 80 120 160
80
60 40 20 0 [ % ]
estimated vertical angles β’[deg.]
target vertical angles β[deg.]
(b) Lateral angle α = − 40
◦.
-160 -120 -80 -40 0 40 80 120 160
-160 -120-80 -40 0 40 80 120 160
80 60 40 20 0 [ % ]
estimated vertical angles β’[deg.]
target vertical angles β[deg.]
(c) Lateral angle α = 0
◦; median plan
Fig. 8. Results of vertical angle estimation when the lateral angle of sound source is−80◦for (a),−40◦for (b) and0◦for (c). Horizontal axis shows the direction of a sound source and vertical axis shows the estimated direction.
by the proposed estimation method. Also the intermediate results shows the possibility to reduce the front-back confusion of conventional binaural processing system by combining with the part of the proposed method.
A
CKNOWLEDGMENTPart of this work was carried out by Grant-in-Aid for Scien- tific Research (C) No. 22500508 and the Cooperative Research
BR BL FL FR estimated quadrant
FR FL BL BR target quadrant
0-15 [%]
85-100
15-30 70-85 30-70
(a) White Noise
0-15 [%]
85-100
15-30 70-85 30-70 BR BL FL FR estimated quadrant
FR FL BL BR target quadrant
(b) Male Voice
Fig. 9. Results of Subblock #2, Quadrant estimation. The horizontal axis shows the direction of sound source and the vertical axis shows the estimated directions. Size of⃝represents the accuracy of estimation.
Project of the Research Institute of Electrical Communication, Tohoku University (H22/A12).
R
EFERENCES[1] H. Nakashima, Y. Chisaki, T. Usagawa and M. Ebata, ”Frequency domain binaural model based on interaural phase and level differences, Acoustical Science and Technology, 24, 172-178, (2003).
[2] T. Usagawa, N. V. Duc and Y. Chisaki, ”Frequency domain binaural model and its application for hearing assistance system - implemented on a portable device,” Proc. ISMAC2010(International Symposium on Multimedia and Communication Technology, Manila, 189-192 (2010).
[3] H. Iida, M.Morimoto,K. Fukudome, M. Miyoshi, T. Usagawa, ”Spatial Hearing,” Corona publishing Co. Ltd., 2010 Tokyo. (in Japanese) [4] M. Morimoto and H. Aokata, ”Localization cues of sound sources in
the upper hemisphere,” Acoustical Science and Technology, 5, 165-173 (1984).
[5] K. Imamura, Y. Chisaki and T. Usagawa ”An estimation method of sound source direction in sagittal coordinate utilizing binaural input : Improvement of an estimation accuracy based on classification of quadrant of sound source directions,” Technical report of IEICE. EA, 106(286), 55-60 (2009). (in Japanese)
[6] D. E. Rumelhart, J. L. McClelland, et al., Parallel Distributed Process- ing, 1,2, MIT.Press (1986).
[7] T. Nakado, T. Nishino and K. Takeda, ”Head-Related Transfer Function Measurement in sagittal and frontal coordinates, Acoustical Science and Technology, 29, 335-337 (2008).