GIS‑based Spatial Analysis
著者(英) Hirofumi Teramura
journal or
publication title
Senri Ethnological Studies
volume 103
page range 207‑219
year 2020‑11‑24
URL http://doi.org/10.15021/00009630
207 Abstract
The purpose of archeology is to support people’s lives, culture, and history by interpreting the materials and remains of past cultures. Distribution theory, which emphasizes the spatial extent of archaeological sites and materials, has been applied to material research on human history; this emphasizes a spatial axis in addition to the temporal axis common in archaeological research.
However, traditional archaeology has represented spatial information by freehand drawings and point-based maps, which are highly subject to arbitrary personal bias in both creation and interpretation. Instead, archaeology should focus on more analytical methods that emphasize objective and quantitative analysis, such as Geographic Information Systems (GIS) that allow the comprehensive analysis of spatiotemporal information using trend surface analysis that recognizes cultural elements in their spatial element.
In this context, the difference between Euclidean space and real geographical features is quite important with respect to difference. For example, if there is a high mountain between points A and B, the shortest path leads over the mountain but traveling around it on lower ground imposes a lower movement cost. Trend surface analysis, which views cultural elements as the “trend” of surface spread, is thus very effective when cultural diversity exists in variable geographic environments, such as in Taiwan.
Such analysis methods can be used to better grasp these various cultural elements in the context of surrounding geographical information (i.e., topography, rivers, elevation, etc.).
Therefore, in this article I consider how GIS spatial analysis and remote sensing resources can be applied to cultural research in this context.
I. Introduction: GIS and Trend Surface Analysis
Geographic Information Systems (GIS) refers to a software framework for managing and analysing spatial information such as point distributions and area coverages along with various attributes associated with such data. This was first developed in the 1960s, with research on the system itself and its application ongoing since the 1970s and 80s. As
seen in the Oxford University Press “Spatial Information Systems” series, GIS-based research has been applied to many disciplines (Aldenderfer and Maschner eds. 1996).
One important spatial analysis tool in GIS is “trend surface analysis” or “trend surface mapping”. For example, assume that a database stores point-based information for villages on an island (such as population). Such data define the population at the villages’ locations but do not allow a researcher to determine any information about population density in areas between the villages without collecting impractically large further datasets. GIS analysis uses the statistical interpolation to predict information for unmeasured locations based on already measured data. This is based on the assumption that predicted values are related to known values by spatial distance (closer distance implies stronger correlation) and allows the creation of a continuous surface map from limited data points. One approach to spatial interpolation is the Inverse Distance Weighting (IDW) method, which calculates an average based on the values of close points to obtain an estimated value. GIS analysis also allows researchers to examine the relationship between spatial data (such as village location) and topography more clearly.
For example, visualizing highly accurate three-dimensional terrain information (longitude, latitude, and altitude) overlaid by other data is far easier to understand than conventional two-dimensional maps. In the next section, I mentioned to present some of the trend surface for the distribution of the speaker of the language / dialect, that these are expressed is merely “tendency”, not a real circumstance. However, for trend surface analysis, as far as arbitrary range setting such as “approximately, this range is the residence area of the dialect speaker” in the previous distribution research is excluded as much as possible. It has the advantage of being able to present different distribution trends according to certain principles.
Volume 22−10 of the International Journal of Geographical Information Science presented a special feature on the principles and applications of digital location indices with regard to linguistics. Research papers relating spatial analysis to language (Lee and Kretzschmar 1993) or place names (Luo et al. 2010) have been rare, though research is now increasing as GIS is increasingly recognized as being suitable for this purpose given its ability to consistently analyse spatial attributes when geographically describing a language. In this study, I demonstrate the use of GIS trend surface analysis for the improved mapping and visualization of language speaker distribution based on a prior survey on Bougainville Island in Papua New Guinea (Teramura and Inagaki 2011).
II. Distribution and tendency of language as a cultural element
In this section, I would like to introduce an example of using trend surface analysis in the language (speaker) distribution survey that we conducted on Bougainville Island in Papua New Guinea, which has an environment similar to that of Taiwan, which is an island area. The details of the survey contents are discussed in the manuscript (Teramura and Inagaki 2011), so please refer to that, but in this section, we will only discuss the effectiveness of the results of the trend surface analysis.
Using data from a previous survey of languages on Bougainville Island (Teramura
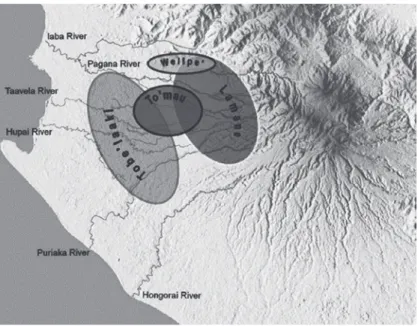
and Inagaki 2011), I applied GIS spatial trend analysis to better map the distribution of four dialects (Lamane, Welipe’, To’mau, and Tobe’laaki) of the Sibe language as originally identified by village location (Figure 1). Each of the four dialects had a characteristic and easily identifiable distribution tendency within the study area: Lamane was broadly concentrated in the northeast and east, Welipe’ was concentrated in the far north with a limited distribution range, To’mau was concentrated in the central region with a more extensive distribution than Welipe’, and Tobe’laaki was widely distributed in the western half. Lamane and Tobe’laaki had a mutually exclusive distribution tendency, with speakers of To’mau concentrated between them and Welipe’ isolated to the north.
Without the use of GIS, the dialect distribution map would have been drawn freehand (Figure 2); while convention opinion may hold that this is sufficient, the GIS approach is far more detailed and accurate while being less prone to illustrator bias.
GIS analysis can also provide further insights into the relationship between dialect distribution and geography. While the distribution shown in Figure 1 uses a two-dimensional plane, elevation can also be incorporated using an ASTER Global Digital Elevation Model (GDEM) for the study area. This product has a resolution of 30
Figure 1 GIS-interpolated distribution map of the (a) Lamane, (b) Tobe’laak, (c) To’mau, and (d) Welipe’
dialects in Bougainville Island based on % speakers in village locations (Teramura and Inagaki 2011)
(c) To’mau (d) Welipe’
(a) Lamane (b) Tobe’laak
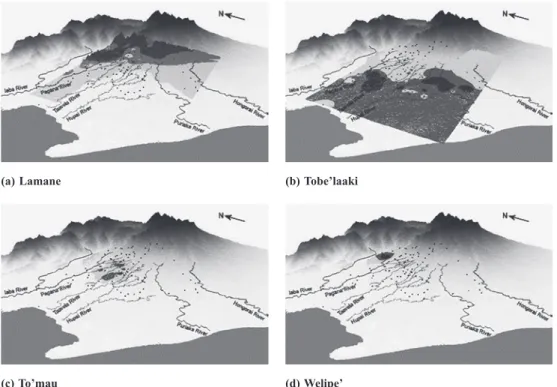
m/pixel, thus providing higher accuracy than SRTM3 data (90 m) published by NASA and the US Geological Survey (USGS). Overlaying the data from Figure 1 on the GDEM creates a bird’s eye view with a coordinated presentation of (a) the trend surface analysis results, (b) the location of all 94 villages in the study area, and (c) vector data obtained by digitizing major rivers described in the 1:50,000 map made by RAS (Royal Australian Survey, 1989) (Figure 3).
Broadly speaking, Sibe speakers are distributed between the Iaba River to the north and the Hongorai River to the south, though this can be constrained to between the Pagana and Puriaka rivers (Figure 3). Lamane crosses the headwaters of multiple rivers and is primarily distributed in the foothills of the eastern mountains. Tobe’laaki is widely distributed further west, in the middle basins of the Taavela, Hupai, and Puriaka Rivers.
To’mau is concentrated in the narrow central and upper reaches of the Pagana and Taavela Rivers. Welipe’, the most narrowly constrained dialect, is confined to the northern headwaters of the Pagana River.
Further analysis shows that each dialect has a clear relationship with village elevation and longitude (chosen as elevation changes more rapidly in this direction than for latitude) (Figure 4). Lamane villages have an average elevation of ~300 m and are characterized by their distribution in the highlands. The average Lamane elevation is higher than the maximum elevation of Tobe’laaki and To’mau villages elevation (169 and 288 m, respectively); Tobe’laaki is distributed at the lowest elevations (average ~80 m).
Tobe’laaki and To’mau have a low standard deviation and are located in a gentle plains.
Tobe’laaki and To’mau vary most by longitude.
These examples demonstrate how GIS makes it possible to visually grasp and consider the relationships between dialect distribution and geography through quantitative
Figure 2 Freehand dialect distribution map (Teramura and Inagaki 2011)
Figure 3 Use of GIS analysis to create a bird’s eye view of dialect distribution overlaid on GDEM
topography data for (a) Lamane, (b) Tobe’laaki, (c) To’mau, and (d) Welipe’ (Teramura and Inagaki 2011)
(c) To’mau (d) Welipe’
(a) Lamane (b) Tobe’laaki
Figure 4 Trends in village dialects by elevation and longitude (Teramura and Inagaki 2011)
Lamane Tobe’laaki To’mau Welipe’
,,,
Lamane Tobe’laaki To’mau Welipe’
,,,,,,,,,,,,,,
analysis. In a broader sense, if languages “A” and “B “ are used in each village, “C” is used in common, and “M” is used exclusively, the relevant social mechanisms and norms could be better understood through GIS analysis.
III. Advancing toward an ecological approach to cultural elements: Taiwan’s Digital Elevation Model (DEM) and satellite imagery
The analytical methods demonstrated above could also be applied to the linguistic distribution of indigenous Taiwanese tribes thought to retain the same Austronesian ancestry as those in Papua New Guinea. Therefore, I present an initial attempt at spatial analysis in Taiwan using DEMs and satellite imagery to inform a comparative examination of past cultures that considers the affinity between languages over a wide range and includes archaeological phenomena as analytical subjects.
First, I would like to touch on the use of DEM and satellite imagery for consideration to the ecological approach of cultural elements in Taiwan.
Figure 5 presents an ASTER GDEM for Taiwan that presents elevation in a colour-
Figure 5 Digital Elevation Model of Taiwan (ASTER GDEM provided by ERSDAC, NASA/ LPDAAC)
coded range, clearly showing the dominant NNE-SSW mountain range along the island’s spine and its broader plains to the west. As Taiwan’s cultural diversity exists within its diverse geographical settings, GIS spatial analysis can play an important role in examining its cultural ecology from past to present.
Figure 6 presents a closer view of the area around the cities of Miaoli and Taichung;
the DEM clearly delineates coastal areas, rivers, floodplains, terraces, and mountain ridges. The application of hillshade further emphasizes terrain details for easier visual interpretation (Figure 7). Even if it is only the display of topography, being able to operate such various expression methods on a computer is also a merit of using GIS.
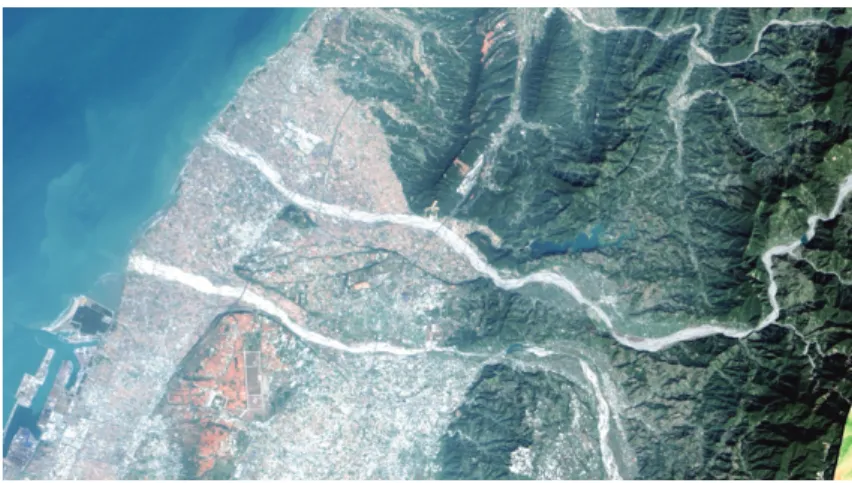
Furthermore, satellite imagery and aerial photographs can be used to evaluate the surrounding environment. For example, Figure 8 shows a USGS Landsat-8 image for the same region as Figures 6 and 7. Landsat has been operating satellites with different performances of the onboard sensors since the launch of the first unit, but the most
Figure 6 Enlarged DEM of the area around the cities of Miaoli and Taichung in Taiwan (ASTER GDEM provided by ERSDAC, NASA/ LPDAAC)
Figure 7 Enlarged DEM of the area in Figure 6 with hillshade applied for improved visual interpretation (ASTER GDEM provided by ERSDAC, NASA/
LPDAAC)
widely used ones now are Landsat-4 or later TM (Thematic Mapper) / ETM + (Enhanced Thematic Mapper Plus) image taken with the sensor. Here, GIS was used to create a true-colour images using Bands 1, 2, and 3 (corresponding to the blue, green, and red wavelengths of visible light). Such colour assignment allows images to be expressed in natural colour tones as seen by the human eye.
Other band combinations can be used to create a composite image in which vegetation activity is detected using the near-infrared band and assigned a green colour (Band 4 = Green, Band 2 = Blue, and Band 3 = Red). In this approach, colour intensity represents vegetation activity; this is useful for acquiring and analysing environmental and landscape information (Figure 9). Such imagery allows viewers to identify boundaries between urban and forest areas while distinguishing between rivers, and sea/lake surfaces.
Figure 8 True-colour satellite image of the area in Figures 6 and 7 (Landsat-8 image provided by the USGS)
Figure 9 Colour-composite satellite image using the infrared band to highlight vegetation activity (green) in the area shown in Figures 6, 7, and 8 (Landsat-8 image provided by the USGS)
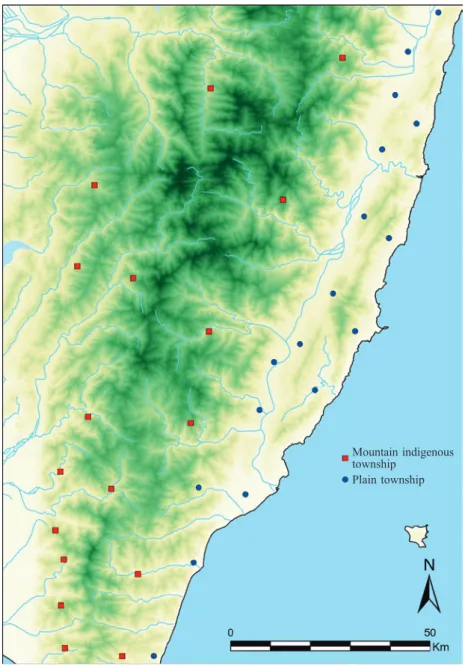
Second, I would like to describe how GIS can analyze the distribution of the inhabited areas of indigenous peoples in Taiwan. Figure 10 shows a DEM plotted major river layers and indigenous peoples’ settlements. The location of habitation in mountain indigenous township and plain township use squares and circles to distinguish the marks plotted on DEM, but the positions of the marks are plotted on the center of the village as
Figure 10 Location of the inhabited areas of indigenous peoples in Taiwan (ASTER GDEM provided by ERSDAC, NASA/ LPDAAC. Inland water data provided by Digital Chart of the World)
Mountain indigenous township Plain township
a representative point, so that the actual range of habitation is much wider. The distribution shows that many of them are located in the vicinity of the central mountain range, where they are easily accessible to the plain. It can be seen that in the east side of central mountain range was scattered from north to south at similar intervals (Figure 11).
Figure 12 shows the river basin boundary created by recognizing the ridge line from
Figure 11 Enlarged map of the southeast area in Figure 10 (ASTER GDEM provided by ERSDAC, NASA/ LPDAAC. Inland water data provided by Digital Chart of the World)
Mountain indigenous township
Plain township
DEM within the analysis range. A GIS analysis extracts a series of cells belonging to the same watershed, and areas belonging to the same water system are painted in the same colour. Particularly in the east, it can be seen that there are places where squares and circles are plotted in the same water system (Figure 13). In terms of residential areas, there are groups of residential areas in the same river basin region, but there is not only
Figure 12 Result of watershed analysis with GIS in Taiwan (ASTER GDEM provided by ERSDAC, NASA/ LPDAAC. Inland water data provided by Digital Chart of the World)
Mountain indigenous township
Plain township
one ethnic group, and there are also cases where flatland people and mountain people coexist. It is possible that there was some social relationship between the upstream and downstream regions of the same water system.
There is a possibility to develop a model that can explain the risk of considering the settlements distribution based on ecological adaptation as the same social group or,
Figure 13 Enlarged map of the southeast area in Figure 12 (ASTER GDEM provided by ERSDAC, NASA/ LPDAAC. Inland water data provided by Digital Chart of the World)
Mountain indigenous township
Plain township
Acknowledgements
I would like to thank Prof. Atsushi Nobayashi (National Museum of Ethnology) for sharing his dataset about the settlement location of the indigenous Taiwanese tribes and useful comments.
References
English
Aldenderfer, M. and H. D. G. Maschner (eds.)
1996 Anthropology, Space, and Geographic Information Systems (Spatial Information Systems). New York: Oxford University Press.
Lee, J. and W. A. Kretzschmar
1993 Spatial Analysis of Linguistic Data with GIS Functions. International Journal of Geographical Information Systems 7(6): 541−560.
Luo, W., J. F. Hartmann, and F. Wang
2010 Terrain characteristics and Tai Toponyms: A GIS Analysis of Muang, Chiang and Viang. GeoJournal 75(1): 93−104.
Japanese
Teramura, H. and K. Inagaki
2011 GIS wo mochiita hougenbunpu no chiritekibunseki- minami Bougainville no shibe (nagovishi) go no hougenchizu. In M. Onishi, and K. Inagaki (eds.) RIHN Descriptive Linguistics Series, pp. 183−208. Kyoto: RIHN.