JAIST Repository
https://dspace.jaist.ac.jp/
Title
キヤノンの高収益を可能にする好循環メカニズム : シ
ステム・ダイナミックスによる構造分析(技術経営
(6),一般講演,第22回年次学術大会)
Author(s)
大内, 紀知; 渡辺, 千仭
Citation
年次学術大会講演要旨集, 22: 534-537
Issue Date
2007-10-27
Type
Conference Paper
Text version
publisher
URL
http://hdl.handle.net/10119/7329
Rights
本著作物は研究・技術計画学会の許可のもとに掲載す
るものです。This material is posted here with
permission of the Japan Society for Science
Policy and Research Management.
2C12
キヤノンの高収益を可能にする好循環メカニズム
- システム・ダイナミックスによる構造分析
○大内紀知,渡辺千仭(東京工業大学)
1. 序
今日のような成熟化社会においては、技術革新 (イノベーショ ン) が企業の収益性を高めるために、より一層重要になってきて いる。 しかしながら、日本は、研究開発費については世界トップレベ ルにあるものの、その効率性の低さが問題視されている。当然、 企業レベルにおいても、榊原 (2005) などが指摘しているように、 多くの日本企業で研究開発効率の低さが見られる。 そのように多くの企業が収益に苦しむ中で、一部の企業は高収 益を達成することができている。その中でも、キヤノンの収益性 の高さは特筆すべきものである。また、その収益性の高さが一過 性のものではなく、1980 年代の工業化社会、1990 年代の情報化 社会、2000 年以降のポスト情報化社会というパラダイムシフトを 超越した持続的なものであることは注目すべきものである。 キヤノンに見られるような持続的な高収益を達成するために は、何が必要なのかということについては、様々な視点から多く の研究がされている。例えば、Arrow (1969) が Learning by Doing の概念を提示して 以来、学習の重要性は多くの研究によって実証されている。また、 スピルオーバー (Grilliches, 1979), Absorptive Capacity (Cohen and Levinthal, 1989)の重要性も多くの研究者が主張している。 しかし、これらの研究の多くは、特定の要素間の関係だけを分 析したものである (例えば、コストと累積生産量の関係など)。実 際の企業活動は、数多くのフィードバックループを含む複雑なシ ステムであるため、特定の要素間の関係だけでは、それぞれの要 素が収益に与えるインパクトを十分には認識できない。 また、これらの研究は主に供給者サイドのみを取り扱っている という問題もある。
Watanabe et al. (2003, 2004) は、表 1 に示すように Industrial Society から Information Society にパラダイムシフトするなかで、 技術の性格形成のプロセスが、供給者サイドで決定されていたも のから、イノベーションの普及過程の中でインスティテューショ ンとの相互作用の中で性格が形成されていくものに変化してい る こ と を 指 摘し て い る1 (Watanabe et al. (2003. 2004) で は 、
Industrial Society と Information Society におけるコア・テクノロジ ー を そ れ ぞ れ Manufacturing Technology (MT) 、 Information Technology (IT) としている。本分析でも、同様の意味で MT と IT という言葉を用いる)。
表 1 Industrial society と Information society の比較 Paradigm Industrial society Information society Core technology Manufacturing
technology (MT)
IT Key features Given, Provided
by suppliers
To be formed during the course of interaction
with institutions Actors responsible for
formation of features Individual firms/organizations Institutions as a whole 出所: Watanabe et al. (2003). すなわち、供給者サイドだけでなく、消費者サイドのイノベー
1 この顕著な例としては、携帯電話がその普及過程において、消 費者との相互作用の中で、当初の通話機能にメール機能やカメラ 機能などを次々に新機能が付加されつつ進化していったことが 挙げられるだろう。詳細は Chen et al. (2007) を参照。 ションに果たす役割が大きくなってきているということであり、 企業の消費者サイドからのフィードバックを考慮した分析が必 要となってきている。 そこで、本分析では、イノベーションが普及することにより、 消費者サイドで生まれるアイデア (Users Ideas) を新機能に結び つける能力を Market Learning、企業が生産活動をする中で行われ る企業内の学習を Internal Learning とし、それぞれ MT と IT の特 徴を有するイノベーションにおいて、企業の収益にどのようなイ ンパクトを与えるのかを分析する。その上で、高収益企業の代表 例であるキヤノンを例に、具体的にどのような取り組みがされて いるかを分析する。
2. 分析のフレームワーク
本分析では、第 1 に Market Learning と Internal Learning が企業 収益に与える影響を分析するためのモデルをシステム・ダイナミ ックスを用いて構築する。システム・ダイナミックスは 1956 年 に MIT の Forrester により創案され、システム・ダイナミックスは、 いくつものフィードバックループをもつダイナミックで複雑な モデルを分析するのに非常に適した手法である。そのため、本分 析で取り扱う、消費者サイドからのフィードバックを含む複雑な システムを分析するのに適している。 次に、シミュレーションをするために、MT と IT の特徴が表れ るようにパラメータを設定し、Internal Learning と Market Learning を表すパラメータを変化させることにより、それぞれが収益に与 える影響をシミュレーションする。
そのシミュレーションの結果を踏まえて、キヤノンではどのよ うなことを行っているのかについて調査していく。
3. モデル構築
本分析で構築したモデルは、1) Research and Development, 2) Production and Delivery, 3) Finance, 4) Internal Experience and Knowledge, 5) Product Functionality and 6) Market の 6 つのセクター からなる。
モデルの一部は、Forrester (1961), Sterman (2000), Rydzak (2006), Ouchi and Watanabe (2007) らを基に構築されている。モデル構 築・シミュレーション用のソフトは Vensim を用いた。
以下で各セクターのモデルについて、紙面の都合上ポイントの み説明する。
(1) Research and Development
新しい R&D プロジェクトが始まると Project in RD にストック として蓄積される。新しいプロジェクトを始めるのに必要な費用 (RD Project Start Level) はスピルオーバー (Spillover Effect)を利用 すれば下げることが出来る。また R&D プロジェクトにかかる時 間 (RD Time) は企業内知識 (Knowledge) により短くすることが できるとする。 Projects in RD Ready Products Design RD Projects Start Rate Projects RD Completion Rate Product Designs Decay Rate Average Product Design Lifetime RD Time RPD Initial P RD Initial Knowledge Ratio Effect of Knowledge on RD Time RD Project Start Level Possible Projects RD Start Rate RD Projects Start Volume Min RD Project Start Level Max RD Project Start Level
Normal RD Time Knowledge Ratio Elasticity of RD Time Spillover Effect
RD Expenditure
Knowlege Initial Knowledge
(2) Production and Delivery
生 産 に 必 要 な 時 間 (Manufacturing Time) は 累 積 経 験 (Cumulative Experience) と企業内知識 (Knowledge) によって短く することができるとする。
図 2. Model structure for Production and Delivery.
(3) Finance
Finance は Cost、Price、Profit、R&D Funds の 4 つのサブセクタ ーから成る。
① Cost
Two-factor learning curve (Klassen et al., 2005) の考え方に基づき、 単位コスト (Unit Cost) は累積経験 (Cumulative Experience) と企 業内知識 (Knowledge) によって低下させることができるとする。
Initial Unit Cost
Cumulative Experience Unit Cost Effect of Experience on Unit Cost Initial CE Cumulative Experience Ratio Elasticity of Cost Effect of Knowledge on Unit Cost Knowledge Ratio Elasticity of Cost Total Cost Production Completion Rate Total Repayment Initial knowledge Knowledge
図 3. Model Structure for Cost Calculation. ② Price
価格は製品の持つ機能 (Product Functionality) と需給のギャッ プ (Inventory Ratio) の影響を受けるとする。
図 4. Model Structure for Price Calculation. ③ Profit
期間内の利益 (Periodic Profit) は総収入 (Revenue) と総コスト (Total Cost) の差で計算される。 Total Cost Revenue Periodic Profit Cumulative Profit Change in Profit Price Delivery Rate
図 5. Model structure for profit calculation. ④ R&D Funds
企業は利益の一定割合 (Percent Periodic Profit for RD) を研究開 発費に回すとする。また、ローンなどの外部資金 (Additional RD
Funds) も考慮する。
図 6. Funds for R&D Activities Model Structure.
(4) Internal Experience and Knowledge
① Internal Experience
企業に蓄えられる経験 (Cumulative Experience) は生産活動に 依存する。
図 7. Internal Experience and Experience Formalization. ② Internal Knowledge
生産活動を通して得られた累積経験 (Cumulative Experiences) は、レポートや調査によって、データとして蓄積される (Data
Acquisition)。このデータによって、企業内知識 (Knowledge) が形
成されていくとする。すなわち、企業内知識を増やすためには、 累積経験からデータにする割合 (Fraction of Experience Reported
and Investigated)、すなわちレポートや調査の能力がポイントとな
る。そこで、本分析では、このパラメータを Internal Learning の 能力を示すパラメータとし、この値を変化させてシミュレーショ ンする。
図 8. Internal Knowledge and the Impact of Spillover Effect.
(5) Product Functionality
製品の機能 (Product Functionality) は R&D プロジェクトが終了 すれば増加するとする。その増加する割合 (Average Functionality
Increase per RD) は、企業内知識 (Knowledge) と消費者のもつア
イデア (Users Ideas) が影響するとする。消費者のもつアイデアを いかに機能に結び付けられるかは、その弾性値 (Users Ideas Ratio
Elasticity of AFI) により決定される。そこで、本分析ではこのパラ
メータ (Users Ideas Ratio Elasticity of AFI) を Market Learning の 能力を示すパラメータとし、この値を変化させてシミュレーショ ンする。 Knowledge Initial Knowledge Knowledge Ratio Product Functionality Product Functionality
Increase Rate Product FunctionalityDecrease Rate Fractional Product Functionality Decay Max Product
Functionality Time to IncreaseProduct Functionality Knowledge Ratio Elasticity of AFI Product Functionality Ratio Initial ProductFunctionality Average Functionality Increase per RD Project
Compleation
Users Ideas Initial Users ideas Users Ideas Ratio
User Ideas Ratio Elasticity of AFI Projects RD
Completion Rate
Initial AFI
図 9. Model structure of product functionality.
Price Inventory Ratio Elasticity of Price
Product Functionality Ratio Elasticity Initial Price
Price Ratio
Effect of Inventory Ratio on Price Effect of Product Functionality Ratio on Price Price Increase Rate Price Decrease rate Price Decrease Fraction Price Change Delay
Desired Price Inventory
Initial Inventory
Product Functionality Initial Product Functionality Inventory Ratio Product Functionality Ratio Cumulative Experience Data Acquisition Reporting and Investigating Fraction of Experience Reported and Investigated Time to Report and Investigate Knowledge Knowledge Increase Knowledge Decrease Max Knowledge Min Time to Assimilate
Knowledge Average Knowledge from Investigation Fractional Knowledge Decay Spillover Effect Technology Distance Spillover Effect Function Inflection Point Spillover Effect Function Steepness Work in Process Inventory Production Start Rate Production Completion Rate Cumulative Experience Experience Increase Experience Decay Average Experience from Production Max Cumulative Experience Fractional Experience Decay Min Time for
Experience Assimilation
Delivery Rate Min Delivery Time Additional
RD Funds Additional RD Funds Increase
Percent of Periodic Profit for
RD RD Available Funds RD Saving RD Expenditure RD Project Start Level <TIME STEP> Periodoc Profit RD Funds Change in RD Funds Interest Repayment Interest Rate Payback Period Periodic Repayment Level of Additional Funds Additional RD Funds Rate Planned Repayment
Loan Loan Time
Time Between RD Projects Repayment Rate <TIME STEP> Possible Projects RD Start Rate Work in Process Inventory Production Start Rate Production Completion Rate Manufacturing Time Knowledge Ratio Delivery Rate Desired Work in Process Adjustment for Work in Process Work in Process Adjustment Time Indicated Orders Desired Inventory Coverage Desired Inventory Inventory Adjustment Time Adjustment for Inventory KR Elasticity of MT Effect of Knowledge Ratio on Manufacturing Time Normal Manufacturing Time Effect of Experience Ratio on Manufacturing Time Cumulative Experience Ratio CER Elasticity of MT
Min Delivery Time
Users Demand Adoption Rate Knowledge Initial Knowledge Cumulative Experience Initial CE
(6) Market
① Diffusion Process
Bass Model (Bass, 1969) を基に、製品の繰り返し購入する人 (Discard Rate)、製品の使用をやめる人 (Resignation Rate) を考慮し た。また、製品を購入する割合は価格 (Price) と製品の機能 (Product Functionality) の影響を受けるとする。
Potential Users Users
Adoption Rate Adoption from Advertising Adoption from Word of Mouth Total Market Adoption Fraction Contact Rate Advertising Effectiveness Average Product Life Discard Rate Resignation Rate Not Users Average Duration of being a User Potential Users Increase Rate Net Change in Total Market Normal Adoption Fraction Product Functionality Elasticity of Adoption Fraction Number of Products per User
Users Demand
Price Ratio Elasticity of Adption Fraction Effect of Product Functionality on Adoption Fraction Effect of Price on Adoption Fraction Penetration Price Product Functionality Initial Price Price Ratio Initial Product Functionality Product Functionality Ratio
図 10. Model Structure for Diffusion Process. ② Total Market
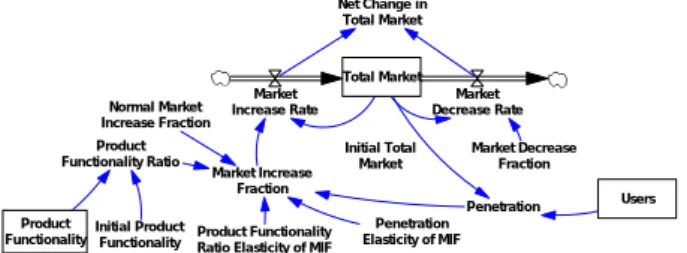
製品の機能 (Product Functionality) が高まれば、これまでその製 品に興味のなかった人も興味を持つようになるため、製品の潜在 的市場 (Total Market) は、高くなる。また、ネットワークの外部 性により、普及率 (Penetration) が高まることにより、潜在的市場 (Total Market) は大きくなる。Ruttan (2001) や Watanabe et al. (2003, 2004) によれば、IT はネットワークの外部性が強い。そこ で、本分析では、普及率が潜在的市場の増加率 (Market Increase
Fraction) に与える影響の強さを表す弾性値 (Penetration Elasticity of MIF) を MT と IT の特徴を表すパラメータと考える。この値が 大きいほど IT の特性が強い。 Users Total Market Market Decrease Rate Market Increase Rate Market Increase Fraction Market Decrease Fraction Net Change in Total Market Initial Total Market Normal Market Increase Fraction Penetration Product Functionality
Ratio Elasticity of MIF
Penetration Elasticity of MIF Product Functionality Ratio Initial Product Functionality Product Functionality
図 11. Model Structure of Total Market. ③ Users ideas
ユーザーのアイデア (Users Ideas) は各ユーザーがもつ平均の アイデアの数 (Average Users Ideas) と新しいユーザー (Adoption
Rate) に依存する。Watanabe et al (2003) では、技術の性格形成の
プロセスにおけるユーザーの参加が IT の特徴だとしている。すな わち、IT の方がユーザーの持っているアイデア数が多いと考えら れる。そこで Average Users Ideas も IT の特徴を表すパラメータと する。この値が高い方が IT の特徴が強い。
図 12. Model Structure of Users Ideas.
4. シミュレーション
(1) シナリオ
上述した各セクターのモデルを統合したモデルを使用し、6 つ のシナリオを用いてシミュレーションを行う。まず、MT と IT の 特徴を区別するために、IT の特徴を表すパラメータ a: Penetration Elasticity of Market Increase Fraction (MIF), b: Average Users Ideas
を表 2 のように設定した。M1~M3 は MT の特徴を表し、I1~I3 は IT の特徴を表す。次に、表 3 に示すように、Internal Leaning を 示すパラメータ c: Fraction of Experience Reported an investigated と Market Learning を 示 す パ ラ メ ー タ d: Fraction of Experience Reported an investigated を設定する。M1 と I1 は Internal Leaning が 強い企業、M2 と I2 は Market Learning が強い企業、M3 と I3 は両 方とも強い企業を表している。 表 2 MT と IT のパラメータ設定 Scenario Characteristic of innovation a b M.1 MT 0.00001 0.00001 M.2 MT 0.00001 0.00001 M.3 MT 0.00001 0.00001 I.1 IT 0.001 0.001 I.2 IT 0.001 0.001 I.3 IT 0.001 0.001 a パラメータ a, b は以下の通り
a: Penetration Elasticity of Market Increase Fraction (MIF) b: Average Users Ideas
表 3 Internal Leaning と Market Learning のパラメータの設定 Scenario Firm’s strong point c d
M.1 Internal learning High (0.5) Low (0.1) M.2 Market learning Low (0.1) High (0.5) M.3 Internal leaning and
External learning
High (0.5) High (0.5) I.1 Internal learning High (0.5) Low (0.1) I.2 Market learning Low (0.1) High (0.5) I.3 Internal leaning and
External learning
High (0.5) High (0.5) a パラメータ c, d は以下の通り
c: Fraction of Experience Reported an investigated, d: Fraction of Experience Reported an investigated (2) シミュレーション結果 シミュレーションによる各シナリオの累積の利益 (Cumulative Profit) の推移を図 13 に示す。 図 13. シミュレーション結果. MT のシナリオを比較すると、シナリオ M.1 の方が M.2 より高 く Cumulative Profit が高い。また、シナリオ M.1 と M.3 ではほと んど差がない。この結果からは、MT の条件においては、Internal Learning の 能 力 の み が 重 要 だ と い う こ と が わ か る 。 Internal Learning の能力が高い企業が、Market Learning の能力を高くして も、収益はそれほど変わらない。それゆえ、MT の条件において は、企業は Internal Learning の能力を高めることにのみ集中すると 考えられる。 IT のシナリオを比較するとシナリオ I.2 の方がシナリオ I.1 より 高い。すなわち Market Leaning が重要であるということである。 これは、MT のときに Internal Leaning を高めることだけを追い求 めていた企業が、パラダイムがシフトしているにも関わらず、 Internal Leaning を高めることに固執し続けると、収益の悪化をも たらすということを示唆するものである。また、MT と異なり、 Internal Learning と Market Learning の両方が高い企業は、その収 益性が圧倒的に高い。Market Leaning による需要の増大は、Internal Learning によるコスト削減と機能創出、リードタイムの削減を誘 発し、それにより更なるユーザーの増加が導かれることにより、 相乗効果が発揮されている。MT のときに、高い Internal Learning の能力を身に付けた企業が、その能力を維持発展させつつ、パラ ダイムの変化にあわせて Market Learning の能力を高めることが 出来た場合は、非常に高い収益性を得ることができることを示唆 Users Ideas Users Ideas Increase Users Ideas Decrease Max Users Ideas
Time to Users Ideas
Fractional Users Ideas Decay Initial Users ideas
Users Ideas Ratio
Average Users Ideas Adoption Rate Cumulative Profit 600,000 450,000 300,000 150,000 0 0 50 100150200250 300350 400450500 Time (Week) $ Cumulative Profit : M-3 Cumulative Profit : M-2 Cumulative Profit : M-1 Cumulative Profit 800,000 600,000 400,000 200,000 0 0 50 100150200250300350400 450500 Time (Week) $
Cumulative Profit : I-3 Cumulative Profit : I-2 Cumulative Profit : I-1
M.3 M.2 M.1 I.3 I.2 I.1
するものである。
5. キヤノンの事例
キヤノンは、一貫して高い収益性を維持している。そして、近 年の収益性は他者を圧倒して高い。上述のシミュレーション結果 に照らして考えると、高い Internal Learning の能力を維持発展させ つつ、Market Learning の能力を高めていると考えられる。 ここで、具体的にどのような取り組みが行われているのかを分 析する。2 (1) Internal Learning キヤノンの Internal Learning の能力を高めている特徴的なもの はセル生産であろう。セル生産が 1998 年に導入されて以来、キ ヤノンの生産性は大きく工場した。セル生産では、ベルトコンベ アによる流れ作業を廃し、少人数のチーム単位の区画 (セル) で ひとつの製品を完成させる。スタッフ各人の技能レベルに応じて 工程数を調整でき、生産数の増減もフレキシブルに対応できる。 フォーディズムの大量生産の現場では標準化、分業の一方で、 個人の技能は軽視されがちだった。標準化のレベルは作業者の平 均値か、それより低い水準で設定し、現場従業員の努力は計算に 入っていなかった。これに対し、セル方式では埋もれていた個人 の技を顕在化させる。それが、自主性を重んじるキヤノンの伝統 と一致したと言われている。それだけでなく、カイゼンを成功さ えてきたように、現場の個々人の能力の高さと日本人の特性にも マッチしていると言えるだろう。 また、セル生産をすすめるなか、一人ひとりが作業をより効率 化する工具や設備を、自らの創意工夫によって作り出すようにな った。従来に比べ、有用で、しかも数十分の一という低コストの 工具・設備が数多く誕生している。 そして、このセル生産に合わせて、キヤノンでは、マイスター 制度と呼ばれる評価システムが導入されている。この制度は、1 人でこなせる工程の数、専門知識、技能速度などでの評価から、 S 級、1 級、2 級といった等級が設定され、技能が認められると認 定される。これが社員のモチベーションを高めているのは間違い ない。 セル生産は、個人個人の能力を最大限に発揮させることにより、 企業としての Internal Learning の能力を飛躍的に高める仕組みと 言える。 (2) Market learning ここでは、複写機を例に考える。ユーザーは、その普及過程に おいて、複写機に単なるコピー機能だけでなく、様々な機能の付 加を求めてきた。その結果、複写機は単なるコピー機としての機 能のみではなく、Fax 機能、スキャナ機能、プリンタ機能、ネッ トワーク機能など様々な機能が次々に付加され、ネットワーク複 合機と進化した。 これらのたくさんの機能を実現するために、キヤノンの複写機に は、独自に開発された専用システム LSI が搭載され、上記の様々な 機能を実現するための入出力データを“同時複合処理”している。 また、普及が進み、利用頻度が高くなるとともに、セキュリテ ィ対策のニーズが高まった。それに対し、「電子透かし技術」、「地 紋技術」、「暗号化 PDF 生成技術」、「書名付き PDF」、「タイムスタ ンプ」などの技術を開発し、市場のニーズに応えてきた。 キ ヤ ノ ン の デ ジ タ ル 複 合 機 に は 、 MEAP (Multifunctional Embedded Application Platform) と呼ばれる、業務や目的に応じて 機能や操作のカスタマイズを自在に行なえる、最先端プラットフ ォームが搭載されている。この MEAP を搭載した複合機では、Java 言語を使用して開発されたアプリケーションを稼動させること が可能になる。Java 言語は移植性に優れ、携帯電話をはじめとす る様々な機器のアプリケーションとして利用されている。MEAP によって、ネットワーク複合機は、IT 端末としての可能性を飛躍 的に拡大し、外部の機器やソフトウェアとの連携も広がる。これ により、ユーザーの個別ニーズに合わせて、一台一台をより使い やすいようにカスタマイズできるようにした。 このように、ユーザーが何を求めているのか、また普及の過程 で求められる機能がどのように変化していくのかを、しっかり認2 この節の技術的な内容については、キヤノン (2007)、日本経済 新聞 (2004) に基づく。 知して、それに応えてきたといえる。 しかし、それが可能になったのは、しっかりとした技術力があ ったからということも忘れてはならない。 キヤノンの御手洗富士夫会長も、「付加価値の高い製品を出し ていく。値段だけの勝負はしない。そのためには技術力が大切。 いろいろな基礎技術を高めておかないと、チャンスが来たときに 対応できなくなる。」(「読売新聞」2004 年 1 月 30 日付け) と述べ ている。このコメントからもわかるように、キヤノンは自らの強 い技術力を生かして、ユーザーのニーズの変化に素早く対応して きたといえる。
6. 結 論
本分析では、イノベーションにおける消費者の重要性が高まっ ていることを踏まえて、消費者からのフィードバックループを考 慮したモデルをシステム・ダイナミックスを用いて構築し、シミ ュレーションを行った。 その結果、MT から IT へとパラダイムシフトする中で、Market Learning の重要性が高まっていることを示すとともに、Internal Leaning のみを追求することに固執している企業は収益が悪化す ることを示した。そして、Internal Learning の能力を維持発展させ つつ、パラダイムシフトに対応して、Market Learning を高めるこ とのできた企業は圧倒的に高い収益を得ることができることを 示唆した。また、キヤノンを例に、Internal Learning、Market Learning を高 めるためにどのようなことを行っているのかを分析した。 今後の課題としては、競合他社の行動や、補完財・代替財の影 響を考慮したモデルを構築することが必要となる。また、他の製 品、他の企業に関する分析を行って、今回の分析結果の一般化を 行うことが望まれる。
参考文献
[1] Arrow, K.J. (1962). The economic implications of learning by doing, Review
of Economic Studies, 29, 155–173.
[2] Bass, F.M. (1969) A new product growth model for consumer durables.
Management Science, 15(5), 215-227.
[3] Chen, C., Watanabe, C. and Griffy-Brown, C. (2007). The co-evolution process of technological innovation - An empirical study of mobile phone vendors and telecommunication service operators in Japan. Technology in
Society, 29(1), 1-22.
[4] Cohen, W.M., Levinthal, D.A., 1989. Innovation and learning: the two faces of R&D. The Economic Journal, 99, 569-596.
[5] Forrester, J.W. (1961). Industrial dynamics, Productivity Press, Cambridge, MA. [6] Grilliches, Z. (1979). Issues in assessing the contribution of research and
development to productivity growth. Bell Journal of Economics, 10(1), 92-116.
[7] Klaassen, G, Miketa, A., Larsen, K. and Sundqvist, T. (2005). The impact of R&D on innovation for wind energy in Denmark, Germany and the United Kingdom, Ecological Economics, 54(2-3), 227–240.
[8] Ouchi. N. and Watanabe, C. (2007). An analysis of high profitability mechanism by means of dynamism between technological diversification, learning and functionality development. IAMOT (International Association for Management of Technology) 2007 - 16th International Conference on Management of Technology - Management of Technology for the Service Economy, Florida, USA, May 13-17.
[9] Ruttan, V.W. (2001). Technology, growth, and development - An induced innovation perspective. Oxford University Press, New York.
[10] Rydzak, F. (2006). The impact of weather forecast on oil & gas industry
operations - System Dynamics model. Report on the project “Global Earth
Observation – Benefit Estimation: Now, Next and Emerging.” International Institute for Applied Systems Analysis, Laxenburg.
[11] Sterman, J.D. (2000). Business dynamics: Systems thinking and modeling for
a complex world, Irwin/McGraw-Hill, Boston.
[12] Watanabe, C. (1995). The feedback loop between technology and economic development: an examination of Japanese industry, Technological
Forecasting and Social Change, 49(2), 127–145.
[13] Watanabe, C., Kondo, R., Ouchi, N. and Wei, H. (2003). Formation of IT features through interaction with institutional systems - Empirical evidence of unique epidemic behavior. Technovation, 23(3), 205-219.
[14] Watanabe, C., Kondo, R., Ouchi, N., Wei H.,& Griffy-Brown, C. (2004) Institutional elasticity as a significant driver of IT functionality development.
Technological Forecasting and Social Change, 71(7), 723-750.
[15] キヤノン株式会社 (2007) 『Canon Technology Highlights 2007』キヤノ ン株式会社.
[16] 榊原清則 (2005)『イノベーションの収益化』有斐閣.
[17] 日本経済新聞社編 (2004)『キヤノン式 高収益を生み出す和魂洋才経 営』日経ビジネス文庫.