Title
The Nature of Reentry Shock of Women: A Survey Among the
Wives of Japanese Corporate Sojourners
Author(s)
Isa, Masako
Citation
沖縄短大論叢 = OKINAWA TANDAI RONSO, 13(1): 57-
121
Issue Date
1999-03-01
URL
http://hdl.handle.net/20.500.12001/10681
The Nature of Reentry Shock of Women:
A Survey Among the Wives of
Japanese Corporate Sojourners
Masako lsa
I . Introduction
Because of Japan's direct investment in, and the rapid surge of business and trade with the United States, the number of Japanese living in the U.S. have grown substantially.
In the mid 1960s, as a part of a general international expansion of Japanese business, Japanese corporations began to assign increasing num-bers of their employees to temporary overseas assignments. Corporate transfers who stay and become involved in market and trade activities overseas are called Chuzaiin (Japanese corporate sojourners). The duration of their assignments usually range from three to five years. After their job assignments they are supposed to return to Japan. They are usually accompanied by their wives and children.
Reacculturation, or the reentry transition is the long-term process of readaptation after returning home, and is widely considered by researchers to be the most difficult aspect of sojourners (Sussman, 1986). Most researchers have examined reentry in terms of students (e.g., Brabant, Palmer & Grambling, 1990; Carlson & Widaman, 1988; Kidder, 1992; Martin, 1986: 1993; Martin, Bradford & Rohrich, 1995; Rohrlich & Martin, 1991; Wilson, 1993; Uehara, 1986), businessmen (Cagney, 1975; Clague & Krupp, 1978; Clark, 1995; Harvey, 1989), and children (Kobayashi, 1981; Goodman, 1990; La Brack, 1983; Minoura, 1984; Inamura, 1984). Fewer studies have examined corporate wives' repatriation. The review of the literature on
culture shock and reentry shock revealed lack of research on women. The study of gender roles, marriage and family, which will greatly influence the readjustment process of women, has not yet integrated into studies of culture shock and reentry shock in communication fields. One important question is whether the theoretical explanation of culture shock and reentry shock is applicable to the wives of Japanese corporate sojourners who had returned home from the U.S. It is important to test the validity of the theoretical model in Japanese context.
Many Japanese researchers have spotlighted the educational problems of children of Japanese corporate sojourners on reentry which cause psycho-logical stress for mothers as well as children (Yamada, 1993). However, housewives and mothers encounter their own special problems reintegrating into Japanese society. After their children reintegrate, some housewives became isolated and neurotic, and others faced marital crisis (Muto, 1995). There is a strong need for investigating the socio-cultural reintegration problems of Japanese housewives. The purpose of the present study is to discover some major factors which may influence reentry adjustment of Japanese housewives after returning from the U.S.
II. Review of Literature
In spite of the general acceptance of culture shock and reentry shock as an important aspect of the international experience, the definition and characterization of the phenomenon is not consistent in the literature, and has undergone many changes and revisions (Brabandt & Grambling, 1990). Oberg (1960) defined culture shock as normal in situations of learning new cultural and social knowledge, providing an opportunity for growth. Kim (1988) conceptualized cross-cultural adaptation as a process of dynamic "stress-adaptation-growth interplay." Reentry shock is also described as a process of adaptation in a foreign country and readaptation at home (Gama
& Pedersen, 1977; Adler, 1976; Adler, 1981; Martin, 1982; Uehara, 1981). Intercultural and reentry transitions involve complex processes. Each researcher revealed different important factors influencing reentry adjust-ment problems.
The communication perspective by Church (1982) is a promising one because it provides an integrating framework in which change and aware-ness of change in communication is understood as a result of the intercultur-al experience, at both the individuintercultur-al and sociintercultur-al levels. The criticintercultur-al variable approach in reentry shock identifies three sets of variables (background, host culture and reentry). However, research has not systematically attempted to examine the differential impact of these background, host culture, and reentry variables.
Background Variable
Earlier studies have found that the age of the sojourner is a predictor of his/her level of adjustment to an overseas sojourn (e.g., Deutch, 1970; Hull, 1978; Martin, 1984). Support for this position is provided by Gullahorn
& Gullahorn (1963), in their investigation of returning American scholarship grantees. Their results show that younger student grantees had more intense and different troubles than older grantees after returning home. Previous Cross-cultural Experience
Previous overseas living experience influence cultural adjustment (Deutsch, 1970; Hull, 1978; Klineberg & Hull, 1979). A number of studies indicate that individuals who have more extensive experiences living in other foreign countries prior to their overseas assignment will experience less reentry stress (Gullahorn & Gullahorn, 1963). Martin (1984) suggests that this may be the case due to the influence of previous experience on expectations. Sojourners who have once returned the home culture will
anticipate some difficulty. Previous studies have not clarified the difference between previous overseas travelling experience and previous living experi-ence (at least more than one month). More research is needed to demon-strate and discover differences between overseas traveling experience and overseas living experience.
Host Country Variables
Length of Sojourn Experience and Degree of Interaction with Host Culture A number of researchers argue that individuals who adapt most suc-cessfully to their foreign culture experience greater reentry problems upon their return to their home culture (Sussman, 1986). The reason for this, according to Brislin and Van Buren (1974), may be that the longer a person is in a foreign country, the greater the likelihood the sojourner might adapt to the host country's patterns of thinking and behaving thus creating greater reentry stress and readjustment difficulties. Support is provided by Bennett et al., (1958). Their results reveal that the number of years returnees spent in foreign countries is positively related to reentry difficulties. The degree of sojourn experience will also influence the degree of interaction and in turn the degree of satisfaction for the sojourner (Brislin & Van Buren, 1974; Martin, 1982).
Value Change
Gama and Pedersen (1977) suggested that there are value conflicts between returned Brazilian scholars and their families. Changes in their perceptions and values may cause them to experience greater reentry stress and difficulties. Those sojourners who spent time with host nationals tended to experience less satisfaction with their life upon their return. Other researchers (Adler, 1976; Opubor, 1974; Gullahorn & Gullahorn, 1963; Uehara, 1986) also reported readjustment difficulties experienced by the returnees because of their value changes. However, empirical studies have
not yet investigated the exact nature of value changes.
Information about the Home Country Received While Abroad
Studies by Adler (1981) and Bennett et al., (1958) reported that sojourners who were kept informed about the home country while they were overseas had fewer readjustment problems. If the Japanese housewives often call their parents or write letters, they are more likely to be well-informed about Japan than those who don't write or hear about the country. This may reduce reentry shock.
Reentry Variables Children's Problems in Japan
What worries mothers most upon reentry are the problems of children' s education. Several researchers have found that compared to American women, contemporary Japanese mothers place greater emphasis on their relationships with their children than with their husbands (Vogel, 1961; Caudill and Weinstein, 1969). Furthermore, the Japanese mother is de-scribed as relying heavily on her children as they grow and develop for emotional rewards and vicarious gratification, particularly in terms of performance in school and in their jobs (Smith & Schooler, 1978). Children' s problems become mother's problems. The difficulty of returnee children' s catching up with classes and the inability of them to readapt to Japanese culture, language, and school system become serious issues for mothers to deal with (Goodman, 1990). More often, the ill-treatment of returnees is manifested through ostracism and rejection or, cruel taunting about their overseas experience (Nakatsu, 1979; Muro, JTW, 2 April1983; Osawa, 1986). It is not unusual for anyone returning home after a long absence, but especially, in Japan the effects are particular severe, resulting in outright alienation, murder and suicide (Robbins, DY, 18 March, 1984). On returning
to Japan, not only the children, but also their parents undergo reverse culture shock.
Gender Role Orientations and Marital Satisfaction
The study of gender role and marital satisfaction may offer valuable insights into reentry shock of Japanese housewives and their life satisfac-tion. Gender role orientations dictate family life, and the work place in a society, which proved to be the most significant aspect of diversity and a key factor in the degree of culture shock experienced (Verthelyi, 1995). Results of study reveal that the degree of acceptance, or rejection of the more traditional role as a homemaker (and mother) during the sojourn is the most important variable affecting the psychological well-being of the inter-national students' spouses (Verthelyi, 1995).
According to almost all observers, Japanese society has traditionally placed a high priority on the maternal role and has deemphasized the conjugal one (Devos, 1960; Blood, 1967; Smith & Schooler, 1978). The important characteristic of a good mother for Japanese women is putting her child's welfare ahead of her own (Smith & Schooler, 1978; lwao, 1993). Thus, various structural conditions of Japanese society affect women's acceptance of traditional attitudes and behaviors toward their maternal role (Smith & Schooler, 1978. However, during the long U.S. sojourn, Japanese mothers have chances of observing American couples and interact-ing with American mothers. They may adopt American women's role, which influences the process of readjustment at home.
Marital satisfaction is viewed as one aspect of overall marital adjust-ment (Spanier, 1976; Burr, 1973). Marital satisfaction is a feeling about one's marriage and may be defined as "the subjectively experienced content-ment or gratification with the marital situation as a whole" (Blurr, 1971, p. 369).
Research suggests that the dominant culturally-accepted Japanese definition of marital relationship downplays the importance of husband/ wife companionship and emphasizes the interdependence of mother and child (Smith & Schooler, 1978; lwao, 199). Previous researchers concluded that most Japanese mothers would not think of leaving their children at home to go out alone with their husbands (Blood, 1967).
However, the life in the U.S. brings changes to mothers. As significant others such as parents or close friends are not available there, couples have to help each other in order to survive overseas. Furthermore, if mothers cannot speak English, they have to depend on their husbands. Mothers have more chances of communicating with their husbands or going out with them than while they were at home, which strengthens the relationship with their husbands. Consequently, mothers' perception of marriage will change. After returning home, as their husbands are so busy that they lead different life from the U.S., mothers experience some gap between the two lives, which has an impact on their marriage. Thus, degree of mothers' marital satisfaction on reentry will influence reentry shock.
Hypotheses
Originally thirteen hypotheses were postulated for each dependent variable (reentry shock, problems in primary relationships, problems in daily functions). But based on the strength of correlation, the number of hypotheses for reentry shock (dependent variable #1) was reduced to eleven, the number of hypotheses for problems in primary relationships (dependent variable #2) was reduced to six, and the number of hypotheses for problems in daily functions (dependent variable #3) was reduced to twelve. The hypotheses for each dependent variable will be stated separately.
UI. Method Questionnaire
In order to survey the respondents and to test hypotheses, a seventeen-page questionnaire which consisted of 103 items was constructed. The subjects used in this study were Japanese housewives who had lived in the U.S. and returned to Japan. The questionnaires were sent to Japanese housewives with the cooperation from fifteen mothers' organizations in Japan such as Tokyo, Saitama, Kanagawa, Aichi, Shizuoka, Osaka, Hyogo and Fukuoka. Out of 340 questionnaires that were sent out, 263 completed questionnaires were returned. Response rate was 73%.
The questionnaire was designed in four parts: part one asked key information on mother, father and children. Part two consisted of 15 general questions about background information on mother and father. Part three contained the information about the life during the stay in the U.S. Part four consisted of questions about the reentry culture shock/ reentry problems of mothers, their relationship with husbands, children and friends, and the quality of life in Japan.
Measurement
The first task of the study was to examine whether or not Japanese housewives experienced reentry culture shock/reentry problems when they returned from having lived in the U.S. The second task was to discover some factors which may influence the reentry shock/reentry problems of Japanese housewives after a long sojourn in the United States.
Quality of Life Variable
The first question was about differences in the quality of life of respon-dents between the U.S. and Japan. If there are differences, we can be positive that mothers experience reentry shock after returning home after
a long sojourn in the U.S.
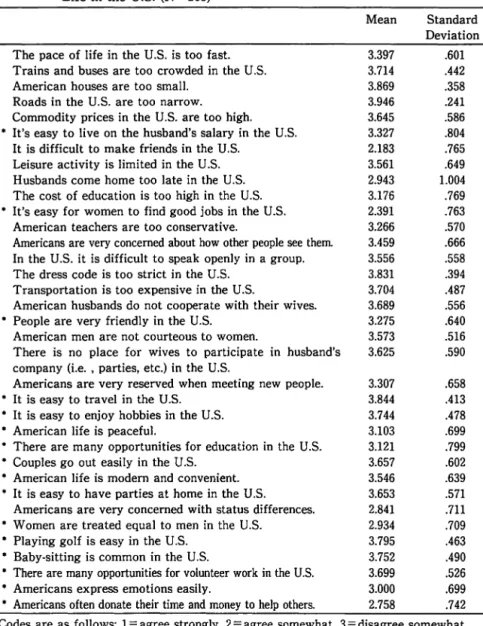
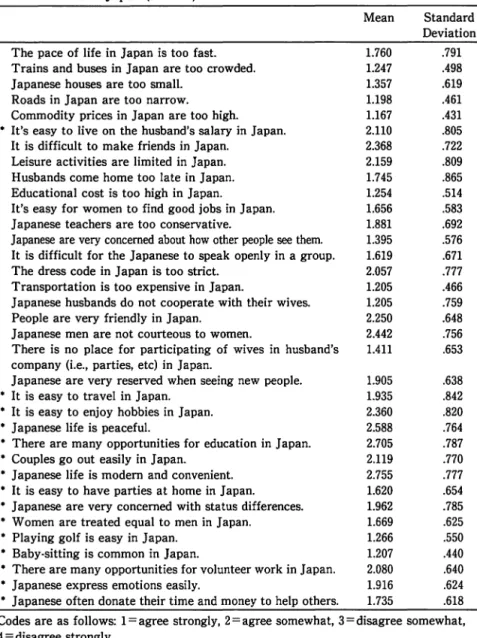
Thirty-five items were constructed to measure quality of life between the U.S. and Japan. A 4-point Likert scale from "agree strongly" to "disagree strongly" was used for the measurement. Alpha reliability of thirty-five items of quality of life in the U.S. was .80, while alpha reliability of thirty-five items of quality of life in Japan was .84. The principle component analysis yielded five factors: 1) gender relations, 2) cost of living, 3) leisure/hobbies/travel activities, 4) American/Japanese character/behav-ior, and 5) life U.S./Japan in general. Eigenvalue of each scale was more than 1.00.
Table 1 and table 2 report the means, standard deviations, and the reliability of the scale.
Dependent Variable (Reentry Shock and Reentry Problems)
*Reentry Shock (DV #1)
The second question addressed the experience of reentry shock. The seven items which are listed in Table 3 were drawn from previous study of students' reentry culture shock by Uehara (1986) and new items were generated for this study. Reentry shock is measured through seven items (feelings of anxiety, feelings of frustration, feelings of depression, feelings of loneliness, feeling of strangeness, feeling of missing the U.S., and physical health problems).
These items were measured based on self-reports by the participants. A four-point scale from "very often" to "never" was used to the measure-ment. Factor analysis on the seven-item scale of reentry shock generated a single-factor solution with an eigenvalue of 3.536 and Cronbach's alpha of .83. High scores on this scale reflect greater reentry shock. The seven items were summed to create a dependent variable called reentry shock (mean= 18.64: s.d. = 4.57).
Table 1 : Means and Standard Deviations for Items in Quality of Life in the U.S. (N=263)
The pace of life in the U.S. is too fast. Trains and buses are too crowded in the U.S. American houses are too small.
Roads in the U.S. are too narrow. Commodity prices in the U.S. are too high. • It's easy to live on the husband's salary in the U.S.
It is difficult to make friends in the U.S. Leisure activity is limited in the U.S. Husbands come home too late in the U.S. The cost of education is too high in the U.S. • It's easy for women to find good jobs in the U.S.
American teachers are too conservative.
Americans are very concerned about how other people see them. In the U.S. it is difficult to speak openly in a group. The dress code is too strict in the U.S.
Transportation is too expensive in the U.S.
American husbands do not cooperate with their wives. • People are very friendly in the U.S.
American men are not courteous to women.
There is no place for wives to participate in husband's company (i.e. , parties, etc.) in the U.S.
Americans are very reserved when meeting new people. • It is easy to travel in the U.S.
• It is easy to enjoy hobbies in the U.S. • American life is peaceful.
• There are many opportunities for education in the U.S. • Couples go out easily in the U.S.
• American life is modem and convenient. • It is easy to have parties at home in the U.S.
Americans are very concerned with status differences. • Women are treated equal to men in the U.S.
• Playing golf is easy in the U.S. • Baby-sitting is common in the U.S.
• There are many opportunities for volunteer work in the U.S. • Americans express emotions easily.
• Americans often donate their time and money to help others.
Mean 3.397 3.714 3.869 3.946 3.645 3.327 2.183 3.561 2.943 3.176 2.391 3.266 3.459 3.556 3.831 3.704 3.689 3.275 3.573 3.625 3.307 3.844 3.744 3.103 3.121 3.657 3.546 3.653 2.841 2.934 3.795 3.752 3.699 3.000 2.758 Standard Deviation .601 .442 .358 .241 .586 .804 .765 .649 1.004 .769 .763 .570 .666 .558 .394 .487 .556 .640 .516 .590 .658 .413 .478 .699 .799 .602 .639 .571 .711 .709 .463 .490 .526 .699 .742 Codes are as follows: !=agree strongly, 2=agree somewhat, 3=disagree somewhat, 4 =disagree strongly.
Alpha Reliability of the 35-item Scale= .800 • reversed i terns
Table 2 : Means and Standard Deviations for Items in Quality of Life in Japan (N
=
263)The pace of life in Japan is too fast. Trains and buses in Japan are too crowded. Japanese houses are too small.
Roads in Japan are too narrow. Commodity prices in Japan are too high. • It's easy to live on the husband's salary in Japan.
It is difficult to make friends in Japan. Leisure activities are limited in Japan. Husbands come home too late in Japan. Educational cost is too high in Japan.
It's easy for women to find good jobs in Japan. Japanese teachers are too conservative.
Japanese are very concerned about how other people see them. It is difficult for the Japanese to speak openly in a group. The dress code in Japan is too strict.
Transportation is too expensive in Japan.
Japanese husbands do not cooperate with their wives. People are very friendly in Japan.
Japanese men are not courteous to women.
There is no place for participating of wives in husband's company (i.e., parties, etc) in Japan.
Japanese are very reserved when seeing new people. • It is easy to travel in Japan.
• It is easy to enjoy hobbies in Japan. • Japanese life is peaceful.
• There are many opportunities for education in Japan. • Couples go out easily in Japan.
• Japanese life is modern and convenient. • It is easy to have parties at home in Japan. • Japanese are very concerned with status differences. • Women are treated equal to men in Japan.
• Playing golf is easy in Japan. • Baby-sitting is common in Japan.
• There are many opportunities for volunteer work in Japan. • Japanese express emotions easily.
• Japanese often donate their time and money to help others.
Mean 1.760 1.247 1.357 1.198 1.167 2.110 2.368 2.159 1.745 1.254 1.656 1.881 1.395 1.619 2.057 1.205 1.205 2.250 2.442 1.411 1.905 1.935 2.360 2.588 2.705 2.119 2.755 1.620 1.962 1.669 1.266 1.207 2.080 1.916 1.735 Standard Deviation .791 .498 .619 .461 .431 .805 .722 .809 .865 .514 .583 .692 .576 .671 .777 .466 .759 .648 .756 .653 .638 .842 .820 .764 .787 .770 .777 .654 .785 .625 .550 .440 .640 .624 .618 Codes are as follows: !=agree strongly, 2=agree somewhat, 3=disagree somewhat, 4=disagree strongly.
Alpha Reliability of the 35-item Scale= .842 • reversed items
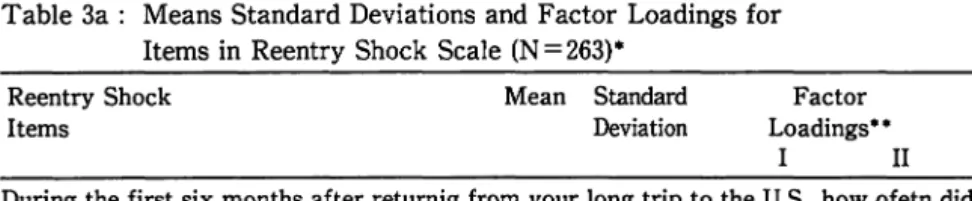
Table 3a : Means Standard Deviations and Factor Loadings for Items in Reentry Shock Scale (N=263)*
Reentry Shock Items Mean Standard Deviation Factor Loadings•• I II
During the first six months after returnig from your long trip to the U.S., how ofetn did you experience the following feelings? (Circle on choice for each item.)
1. Feeling of anxiety 2.745 0.965 .727 .142
2. Feeling of frustration 2.725 0.981 .815 .193
3. Feeling of depression 2.483 0.996 .843 .206
4. Feeling of loneliness 2.172 0.987 .752 .102
5. Feeling of strangeness 2.939 0.854 .740 .080
6. Feeling of missing the U.S. 3.433 0.684 .500 .193
7. Feeling of relaxation 2.255 0.726 .034 .897
8. Feeling of happiness 2.366 0.738 .130 .882
9. Physical health problems 2.137 1.021 .456 .030
• Codes are as follows: 4=very often, 3=occasionally, 2=rarely, !=never • • Cronbach's alpha for the 9-item scale is .804
Table 3b : Reentry Shock Scales (N = 263) Reentry Shock Items
Feeling of anxiety Feeling of frustration Feeling of depression Feeling of loneliness Feeling of strangeness Feeling of missing the U.S. Physical health problems
Alpha Reliability of the 7-item Scale= .826
Eigenvalue 3.536
Reentry Shock Item (positive) Eigenvalue
Feeling of relaxation Feeling of happiness
Alpha Reliability of the 2-item Scale= .778
1.637 Factor Loadings .692 .837 .865 .759 .743 .533 .442 Factor Loadings .905 .905
*Reentry Problems
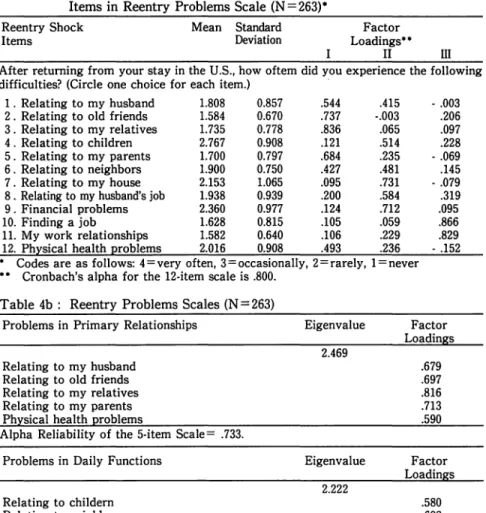
Another index measures the frequency that reentry problems occurred when Japanese housewives returned to Japan. Twelve items which are listed in Table 4 was constructed. A four-point scale from "very often" to "never" was used for the measurement. Cronbach's alpha for the twelve items was .80. A confirmatory factor analysis indicated three subscales: 1) problems in primary relationships, 2) problems in daily functions, and 3) job related problems. In this study, two subscales of reentry problems such as problems in primary relationships and problems in daily functions were used as dependent variable.
Subscale #1: Problems in Primary Relationships (DV #2)
Factor analysis of the five interpersonal relation items (relating to my husband, relating to old friends, relating to my relatives, relating to my parents and physical health problems) generated a single-factor solution with an eigenvalue of 2.469 and Cronbach's alpha of .73. The five items were summed to create a dependent variable called problems in primary relationships (mean= 8.84: s.d. = 2.80).
Subscale #2: Problems in Daily Functions (DV #3)
Factor analysis of the five items (relating to children, relating to neighbors, relating to my house, relating to my husband's job and financial problems) yielded a single-factor solution. Eigenvalue= 2.222. Cronbach's alpha for the scale was .68. The five items were summed to create a dependent variable called problems in daily functions (mean= l1.48: s.d. = 3.09). High scores on the reentry problems scale (problems in primary relationships and problems in daily functions) reflect greater reentry prob-lems.
Table 4a : Means, Standard Deviations and Factor Loadings for Items in Reentry Problems Scale (N=263)•
Reentry Shock Items Mean Standard Deviation Factor Loadings•• II ill
After returning from your stay in the U.S., how oftem did you experience the following difficulties? (Circle one choice for each item.)
1 . Relating to my husband 1.808 0.857 .544 .415
2. Relating to old friends 1.584 0.670 .737 -.003
3. Relating to my relatives 1.735 0.778 .836 .065
4. Relating to children 2.767 0.908 .121 .514
5. Relating to my parents 1.700 0.797 .684 .235
6. Relating to neighbors 1.900 0.750 .427 .481
7. Relating to my house 2.153 1.065 .095 .731
8 . Relating to my husband's job 1.938 0.939 .200 .584
9. Financial problems 2.360 0.977 .124 .712
10. Finding a job 1.628 0.815 .105 .059
11. My work relationships 1.582 0.640 .106 .229
12. Physical health problems 2.016 0.908 .493 .236
- .003 .206 .097 .228 - .069 .145 - .079 .319 .095 .866 .829 - .152 • Codes are as follows: 4=very often, 3=occasionally, 2=rarely, !=never • • Cronbach's alpha for the 12-item scale is .800.
Table 4b : Reentry Problems Scales (N = 263) Problems in Primary Relationships
Relating to my husband Relating to old friends Relating to my relatives Relating to my parents Physical health problems
Alpha Reliability of the 5-item Scale- .733. Problems in Daily Functions
Relating to childern Relating to neighbors Relating to my house Relating to my husband's job Financial problems
Alpha Reliability of the 5-item Scale= .680. Job Related Problems
Finding a job
My work relationships
Alpha Reliability of the 2-item Scale- .718.
Eigenvalue 2.469 Eigenvalue 2.222 Eigenvalue 1.576 Factor Loadin s .679 .697 .816 .713 .590 Factor Loadin s .580 .698 .656 .707 .684 Factor Loadin s .888 .888
Independent Variables
*
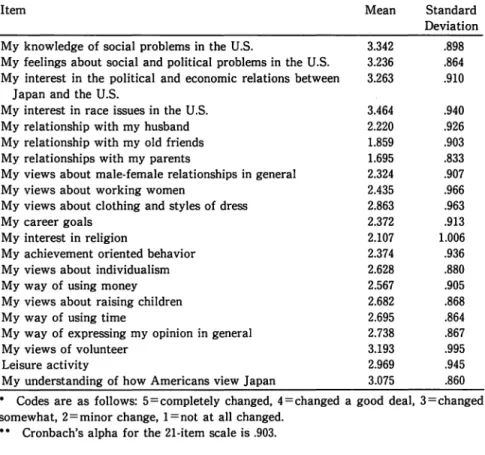
Value ChangeJapanese housewives' value change as a result of living abroad was operationalized by eighteen items. These items which are listed in Table 5 were constructed based on previous research (Condon & Y ousef, 1975): Stewart, 1975: Uehara, 1986). A five-point scale from "completely changed" to "not at all changed" was employed. The respondents were asked to measure the degree of their changing views about twenty-one basic value orientations in daily life.
Table 5a : Means, Standard Deviations for Items in Value Change Scale (N
=
263)*Item
My knowledge of social problems in the U.S.
My feelings about social and political problems in the U.S. My interest in the political and economic relations between
Japan and the U.S.
Mean 3.342 3.236 3.263 Standard Deviation .898 .864 .910
My interest in race issues in the U.S. 3.464 .940
My relationship with my husband 2.220 .926
My relationship with my old friends 1.859 .903
My relationships with my parents 1.695 .833
My views about male-female relationships in general 2.324 .907
My views about working women 2.435 .966
My views about clothing and styles of dress 2.863 .963
My career goals 2.372 .913
My interest in religion 2.107 1.006
My achievement oriented behavior 2.374 .936
My views about individualism 2.628 .880
My way of using money 2.567 .905
My views about raising children 2.682 .868
My way of using time 2.695 .864
My way of expressing my opinion in general 2.738 .867
My views of volunteer 3.193 .995
Leisure activity 2.969 .945
My understanding of how Americans view Japan 3.075 .860
• Codes are as follows: 5=completely changed, 4=changed a good deal, 3=changed somewhat, 2=minor change, 1=not at all changed.
Table 5b : Value Change Scales (N
=
263)Behavioral Adjustment (Value Change Subscale #1) My achievement oriented behavior My views about individualism My way of using money My views about raising children My way of using time
My way of expressing my opinion in general Leisure activity
Alpha Reliability of the 7-item Scale= .858.
Social Involvement (Value Change Subscale #2)
My knowledge of social problem in the U.S. My feelings about social and political problems in
the U.S.
My interest in the political and economic relations between Japan and the U.S.
My interest in race issues in the U.S.
My understanding of how Americans view Japan• Alpha Reliability of the 5-item Scale= .880. Alpha Reliability of the 4-item Scale= .913.
Gender Role Adjustment (Vale Change Subscale #3) My relationship with my husband My views about male-female relationships My views about working women
My views about clothing & styles of dress My career goals
My views of volunteer
Alpha Reliability of the 6-item Scale= .812.
Eigenvalue 3.796 Eigenvalue 3.436 Eigenvalue 3.136 Factor Loadings .728 .680 .675 .708 .804 .791 .758 Factor Loadings .905 .911 .887 .829 .561 Factor Loadings .631 .805 .799 .635 .794 .648
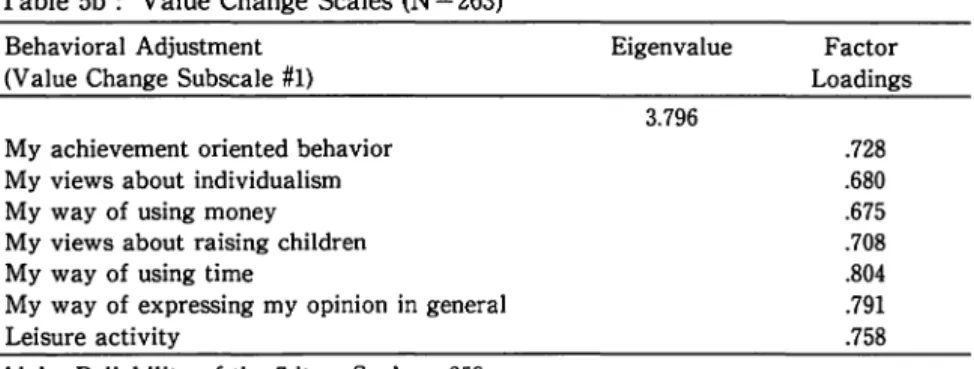
Cronbach's alpha for the twenty-one items was .90. A confirmatory factor analysis generated three subscales: 1} behavioral adjustment, 2} social involvement, and 3} gender role adjustment.
Subscale #1: Behavioral Adjustment
Factor analysis of seven-item subscale of behavioral adjustment gener-ated a single-factor solution with an eigenvalue of 3.796 and Cronbach's alpha of .86.
Subscale #2: Social involvement
Factor analysis of the five-item subscale of social involvement yielded a one-factor solution. Eigenvalue= 3.436. Cronbach's alpha for the scale was .88.
Subscale #3: Gender Role Adjustment
Factor analysis on this six item subscale of gender role adjustment generated a single-factor solution with an eigenvalue of 3.136 and Cronbach' s alpha of .81. High scores on the subscales of behavioral adjustment, social involvement and gender role adjustment reflect greater value change due to living in the U.S.
Previous research has suggested that change in the individual's value structure was the strongest predictor of reentry shock (Adler; Opubor, 1974; Gullahom & Gullahom, 1963; Uehara, 1986}, but the nature of these value changes have not been clarified or operationalized. In this study, the concept of value change will be refined and measured.
*Adjustment to Living in the U.S.
Adjustment to living in the U.S. was measured by the frequency of interaction with Americans: 1} the frequency of meeting American friends in the U.S. and 2} inviting Americans at home in the U.S. The frequency of meeting American friends was measured by a four-point Likert scale "very
often" "occasionally" "rarely" "never". Inviting Americans at home in the U.S. is a dummy variable coded 1 for yes. The magnitude of social relation-ships indicate the level of interpersonal interaction of a Japanese housewife.
*
Communication with the Home CountryCommunication with the family in Japan was used for the measure of connection to the home country while in the U.S. Respondent's communica-tion with family in Japan was measured by a single Likert scale ("about once a week", "once or twice a month", "once to five times a year", "not at all").
*
Children's Problems in japanChildren's problems in Japan was measured by two variables: 1) children' s adjustment to school after reentry, and 2) respondent's satisfaction with children's present educational situation at home. Children's adjustment to school after reentry was measured by the question, "Did your children easily (re)adjust to school after they returned to Japan?." This is a dummy variable coded 1 for yeas. Respondent's satisfaction with children's present educational situation was measured by the question, "Are you satisfied with your children's present educational situation?" This is a dummy variable coded 1 for yes.
*
Children's Americanization during the Stay in the U.S.Children's Americanization during the stay in the U.S. was measured by the question, "Do you find your children Americanized?" This is a dummy variable coded 1 for yes.
*
Gender Role OrientationsTable 6a : Means and Standard Deviations for Items in Gender Roles (N=263)
A husband is the head of the family.
• A husband should help with household chores.
Weekends are a period of rest for a husband, so he will not be expected to assist with cooking and housekeeping. To fit my life to my husband's is important.
I should be responsible for cooking and cleaning around the house.
I commit most of my own time and energy to children and home. Child rearing is a major responsibility for a wife.
The greatest gatisfaction for a woman comes from having a child. • My husband and I have equal rights in making decisions.
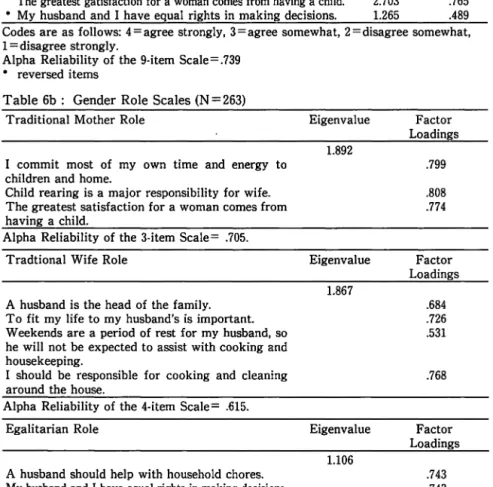
Mean 3.274 1.969 1.939 2.317 2.635 2.639 2.384 2.703 1.265 Standard Deviation .795 .676 .739 .736 .843 .749 .883 .765 .489 Codes are as follows: 4=agree strongly, 3=agree somewhat, 2=disagree somewhat, 1 =disagree strongly.
Alpha Reliability of the 9-item Scale= .739 • reversed items
Table 6b : Gender Role Scales (N = 263) Traditional Mother Role
I commit most of my own time and energy to children and home.
Child rearing is a major responsibility for wife. The greatest satisfaction for a woman comes from having a child.
Alpha Reliability of the 3-item Scale= .705. Tradtional Wife Role
A husband is the head of the family. To fit my life to my husband's is important. Weekends are a period of rest for my husband, so he will not be expected to assist with cooking and housekeeping.
I should be responsible for cooking and cleaning around the house.
Alpha Reliability of the 4-item Scale= .615. Egalitarian Role
A husband should help with household chores. My husband and I have equal rights in making decisions.
Eigenvalue 1.892 Eigenvalue 1.867 Eigenvalue 1.106 Factor Loadings .799 .808 .774 Factor Loadings .684 .726 .531 .768 Factor Loadings .743 .743
General Social Survey (Davis & Smith, 1985) and Yamada's study (1993). Respondents could respond by "strongly agree" to "disagree strongly." Cronbach's alpha for the nine-item scale was .74. A confirmatory factor analysis of nine items generated three gender role orientations: 1) tradi-tional wife role, 2) traditradi-tional mother role, and 3) egalitarian role. Factor analysis of the four-item scale of traditional wife role yielded a single factor solution with an eigenvalue of 1.867 and Cronbach's alpha of .62. Factor analysis of the three items of traditional mother role generated a one-factor solution with an eigenvalue of 1.892 and Cronbach's alpha of .71. Factor analysis of the two-item scale of egalitarian role generated a one-factor solution with eigenvalue of 1.106. The higher the score, the more the respondent is committed to the traditional women role.
*Marital Satisfaction
Marital satisfaction was measured by one Likert scale item: "How satisfied are you with your marital relationship in general?" The scores range from 4 (vary satisfied) to 1 (very dissatisfied).
Control Variables
Control variables include: mother's age, previous travel experience, previous overseas living experience, participation in the decision to live in the U.S., length of sojourn in the U.S., location of residence in the U.S., length of time after reentry, location of residence after return to Japan, employment status after reentry, and child reentry age.
Mother's age (mean=43.5, s.d.=5.76) is an interval-level variable measured in years: length of stay in the U.S. (mean=63.2, s.d.=30.98) and length of time after reentry (mean= 52.8 , s.d. = 40.64) are interval variables measured in months. Child's reentry age is an interval-level variable measured in years. We took into account in the calculation the first child's
age in this study (mean= 11.5, s.d. = 4.25).
Previous overseas traveling experience and overseas living experience are dummy variables coded 1 for yes; participation in the decision to live in the U.S. is a dummy variable coded 1 for yes; residence location in the U.S. and residence location after return to Japan are categorical variable. Employment status after reentry is a dummy variable coded 1 for yes.
IV. Results
ParticiPants
The sample consisted of 263 mothers who varied in age from 21 to 58 with a mean age of 43.5. Age distribution was mostly concentrated in the age groups of 35-39, 40-44, 45-49. In other words, 26.1% of the mothers (n = 69) were between the age of 20-39, 58% (n = 153) were between the age of 40-49, and 15.5% (n = 41) between the age of 50-59.
Husbands' age is higher than that of wives. Husbands' age varied from 30 to 61 with the mean of 46.1 Husbands' age is mostly concentrated in the 40s. 62 percent of men (n = 163) were in the age group of 40 to 49, followed by 22% of them (n=58) in the age group of 50·59, and 13.7% of them (n=36) in the age group of 30 to 39. The number of men in the age group of 60s was small (2.3%) (n=6). Regarding husbands' jobs, almost half (51.3%) (n=135) of them work for manufacturers/distributors/wholesalers followed by services (30.8%) (n=81), trading companies (14.1%) (n=37), and information services (1.1%) (n=3).
Most of the mothers had preschool and school-age children. There were only a few Japanese housewives without children. The total number of children (child 1, child 2 & child 3) on entry to the U.S. was 534. 49.8% of them were male; 50.2% were female. The majority of mothers had pre-schoolers and elementary school students: 64.6% (n = 345) of them were between the ages of 0 and 6; 29.2% (n = 156) of them were between 7 and 12
years old. The number of junior high and senior high school students was small: 4.9% (n=26) were between the ages of 13 and 15; 1.3% (n=7) of them were between the ages of 16 and 18.
On the reentry to Japan, the total number of children was five hundred twenty three. Half of them were elementary school students followed by preschoolers and junior high students: 50.3% (n = 263) of them were between the ages of 7 and 12; 23.9% (n = 125) of them were between the ages of 0 and 6 years old; 19.1% (n=100) of them were between ages of 13 and 15. The number of senior high school students was small: 6.7% of them (n=35) were between the ages of 16 and 18.
According to the data provided by Ministry of Education (1997) regard-ing the study of school- age students returnregard-ing from overseas, the sample of students is proportionally representative of the returning students popula-tion. Their data shows that 62.0% of them are elementary school children, 22.6% of them are junior high school students, and 15.4% of them are senior high school students. In our sample, 66.1% of students were elementary schoolers; 25.1% of them were junior high school students and 8.8% of them were junior high school students. Our sample underrepresents the number of senior high school students. The reason parents returned to Japan from the U.S. before their children reached school age (0-6) or during elementary school age (6-12) is to assure that overseas experience will not affect their children's education. If children return home after the age of 13, they usually experience adjustment problems which are likely to interfere with their performance on the entrance examinations which they must take to get into good universities.
The mothers had lived in almost all over the U.S., and in 30 States among 50 States. Seventy-four (28.1%) lived in California, forty-seven (17.9%) in New York, and twenty-five (9.5%) in New Jersey. Respondents who had lived in Illinois, Georgia, Michigan and Washington accounted for
18% of the sample, and the rest (27%) came from 23 States of the U.S. Regarding the length of stay in the U.S., the mean of the 1st sojourn was 52.2 months (s.d. = 26.00), 24.3% of the respondents had a second sojourn. The mean age of the second sojourn was 45.1 months (s.d. = 24.32). The total mean score of the 1st and 2nd sojourns was 63.2 months (s.d. = 30.98).
Regarding length of time between their return to Japan and the survey, 24 respondents (9%) had been back in Japan for 1-12 months, 41 mothers (16%) had been back for 12-24 months prior to this study. 39 respondents (15%) had been back for 2-3 years, 73 mothers (28%) had been back for 3-5 years, 48 mothers (18%) had been back for 5-7 years, and 38 mothers (14%) had been back in Japan for more than 7 years. The mean of the length of time since their return was 52 months (s.d.=40.64, range = 1-258).
Most of the respondents lived in Kanto area (Tokyo, Kanagawa, Chiba and Saitama) and Kinki area (Hyogo, Osaka, Kyoto). 64% of them lived in Kanto area, 24% lived in Kinki area, and 9% of them lived in Toukai-Koushin area (Aichi and Shizuoka). The primary reason for living in big cities was the availability of schools which accept returning students.
In Kanto area, 68 women (25.9%) were living in Kanagawa, 50 women (19%) in Tokyo, 28 women (10.6%) in Saitama and 21 women (8%) in Chiba. In Kinki area, 43 (16.3%) lived in Hyogo, followed by 14 women (5.3%) who lived in Osaka and 7 women (2.7%) lived in Kyoto. In Tokai-Koushin area, 23 women (about 8%) lived in Shizuoka and Aichi.
While the survey was not random and depended on the voluntary participation of returning mothers, the data provided by the Ministry of Education (1997) regarding students returning from overseas indicates that the sample are proportionally representative of the returning students' mothers population because most returning students live in Kanto, Kinki, and Tokai-Koushin area. Their study shows that 63.0% of students lived in Kanto, 13.4% lived in Kinki, and 11.5% lived in Toukai-Kousin area. The
sample slightly overrepresents mothers who lived in Kinki area, but is quite representative of returning mothers with regard to the geographical loca-tion of their residences.
In addition to this, our data is also in compliance with the JETRO 1995-96 survey. Based on the JETRO survey, of the 50 states, California, New York, Illinois, Georgia, New Jersey, Texas, Michigan, and Washington states accounted for 70% of the Japanese industries in the United States. Our data show that 75% of the sample (198 women) came from the above eight major states. Thus, in spite of the fact that our sample was based on voluntary participation, it is proportionally representative of the location where the returning mothers lived in the U.S.
Before going to the U.S., 70% of the respondents (184) had previous overseas travel experience, visiting foreign countries for sightseeing. On the other hand, the percentage of people who had lived in foreign countries for more than one month was small (22%). Major countries were U.S. and Europe (England, Germany, Belgium), Asia (Hong Kong, Singapore) and Brazil. The average months of living in foreign country was 32.2 months (s.d. = 3.12).
Most women had a high level of education. The mean of years of education for wives was 14.7 (s.d.
=
1.49). About 12.5 percent (33) are high school graduates, 4.9 percent (13) are vocational school graduate, 31.6 percent (83) are junior college graduates, 48.7 percent (128) are four-year college graduates and 1.5 percent (4) are graduate school graduates. The proportion of wives with higher level of education including junior, four-year college, and graduate schools reaches 81.8%. Compared with the age of higher education among Japanese women in general, 47.5% (junior college 24.6%, college 22.9%) which was released in 1995 by Ministry of Education, the average level of education in our sample is quite high.experience: part-time (9%) (n=24) and full-time (81%) (n=213). Because of their husbands' overseas assignments, all mothers in this study left their jobs. This indicates that Japanese housewives have the major responsibility for childbearing, child's education, and supporting their husbands overseas. There seems to be a societal practice that working wives quit their jobs and follow their husbands' new assignment when their husbands are transferred (Yamada, 1991).
Reentry Culture Shock/Reentry Problems and Its Predictors
This section will investigate two lines of inquiry and test .the hypoth-eses. In the first section, the differences in the respondent's quality of life between the U.S. and Japan is examined. A significant difference in quality of life between U.S. and Japan can be an indication that returnee mothers experienced reentry culture shock after returning home. In the second section, we will explore the relationship between reentry culture shock (or reentry problems) and its important variables. The third section will examine the primary factors influencing reentry culture shock/reentry problems and test the hypotheses.
Comparison between American and Japanese Life
In order to examine the differences in the quality of life "QOL" between the U.S. and Japan, a comparison between respondents' scores for American and Japanese life was made using a T-test. Any significant difference between the two QOL measures could be an indication that the respondents experienced reentry shock. T-tests provide the most powerful analysis in comparing mean scores for two groups of respondents and group means were used as a basis of comparison.
Table 7 : Difference of Quality of Life betwen U.S. and Japan
(USQ) (JSQ)
American Life Japanese Life
Factor Mean SD Mean SD t
Gender Relations 3.259 .341 1.840 .405 <.ooo•
Cost of Living 3.463 .426 1.434 .351 <.ooo•
Leisure/ Hobbies/ Travel 3.719 .329 1.868 .476 <.ooo•
Behavior/ Character 3.183 .319 1.857 .354 <.ooo•
Life General 3.469 .230 1.938 .277 <.ooo•
Overall Score 17.093 1.173 8.938 1.393 <.ooo•
Differences between USQ and 8.155 2.127
JSQ
• Differences in Means Significant at p<.001 (t·test)
Table 7 presents result of the T-test analysis. The result indicates that there was a statistically significant difference between the mean scores of respondents' American QOL and Japanese QOL. The difference in mean scores between the groups reflects the following factors: 1) gender relations, 2) cost of living, 3) leisure/hobbies/travel, 4) behavior/character and 5) life in general US/Japan, and all comparisons were statistically significant at p<.OOOl. The difference in overall U.S. QOL score and Japanese QOL score was also statistically significant at p<.OOOl. The results revealed the difference in the quality of life between the U.S. and Japan.
In order to identify potential independent variables, the Pearson Prod-uct Moment Correlation Coefficient test was performed between the depen-dent variable (reentry culture shock/reentry problems) and each indepen-dent variable. This test was chosen because the correlation reveals the direction and magnitude of the bivariate association between two variables. In order to find predictors for the dependent variable, the stepwise regres-sion analysis was conducted. Using stepwise procedure, the order of in-dependent variables in single steps from the best to worst contributions in relation to the explained variance in the criterion can be identified.
One rationale for selecting the variables rests upon the review of the literature, and the use of similar or identical measures in previous studies and the new measures that the researcher created. The other rationale rests on the observation that all variables are significantly correlated with our dependent variable reentry culture shock/reentry problems. In this section, the results of the multiple regression analysis of dependent variable (reentry culture shock/reentry problems) on predictors will be presented. Further-more, hypotheses of reentry shock and reentry problems will be tested respectively.
1. Reentry Shock (Dependent Variable #1) Explaining Variation in Reentry Shock
Table 8 presents average reentry shock scores for previous overseas travelling experience, previous overseas living experience, respondent's participation in the decision to move to the U.S., age, length of stay after return, and location of residence in the U.S.
As shown in Table 8, respondents who had previous overseas travel experience had greater reentry shock than those who didn't have overseas experience. The difference in reentry shock was statistically significant (p<.01). In other words, those who had previous overseas travelling experi-ence experiexperi-enced a social and cultural gap between the foreign and home country upon their return, which caused reentry shock.
However, those who had previous overseas living experience scored lower on the reentry shock scale than those who didn't (p<.001). These results were expected because those who had previous overseas living experience had realistic expectations on reentry. The finding was consis-tent with previous research. The returning sojourner who had reentered home culture previously would at least anticipate some difficulties (Martin, 1984: Rohrlich & Martin, 1991). This result supports Kim's (1988)
specula-Table 8 : Mean Reentry Shock Socores by Japanese Mothers Contingency Variable
Overall Mean score(N=263)* Standard Deviation
Range
Respondent Has Overseas Travel Experience: Yes
No
Respondent Has Overseas Living Experience: (> 1 mo): Yes
No
Respondent Participated in Decision to Live in the U.S.: Yes No Age 1. 21-39 2. 40-45 3. 46-58
Length of Time after Return 1. 0-1 yr.
2. 1-3 3. over 3
Location of Residence in the U.S.
I. East Coast 2. West Coast 3. Midwest or South Reentry Shock 18.635 4.571 7.00-28.00 19.411** 17.141** 16.613**. 19.225*•• 18.564 18.736 19.710 18.801 17.703 20.333 18.900 18.261 18.457 18.435 19.076 Difference in Means T-Tests for Reentry Shock Scale by Respondent's Age and Respon-dent's Length of Time Since Reentry
Age
Compared Groups 1/2
Lenght of Time after Return
Difference in Means Significant at p < .05 (t-test) •• Difference in Means Significant at p< .01 (t-test) ••• Difference in Means Significant at p< .001 (t-test)
1/3 2/3 1/2 1/3 2/3 Significance .203 .005** .092 .178 .039* .308
tion that sojourners who are prepared for change will experience greater ease of adaptation. The results also confirm earlier studies (Klinnberg &
Hull, 1979; Rohrlich, 1991; Uehara, 1986), and refine previous studies of past transition experience.
Mean scores for respondents who participated in the decision to live in the U.S. were lower than the mean score for respondents who didn't participate, but the difference in reentry shock was not significant. Mean scores for respondents' age groups showed that respondents aged 21-39 scored significantly higher on reentry shock than respondents aged 46-58 (p < .01). This means that since younger people are more adaptable than older people, younger people tend to experience greater reentry shock. This was consistent with previous research findings which stated that younger student scholarship grantees had more intense and difficult troubles than older grantees after returning home (Gullahorn & Gullahorn, 1963). Older individuals typically had greater and more diverse experiences which may assist them to more effectively readapt to home culture.
Mean scores for respondents' length of time after return indicate that respondents with length of time less than one year scored significantly higher than those with length of time more than three years (p< .05). The longer the length of time after return, the greater the sojourner's readapta-tion to the home country's patterns of thinking and behaving; thus decreas-ing reentry shock over time.
Mean scores for respondents' location of residence in the U.S. showed that those who lived in the Midwest or South scored higher than those who lived on the West coast or East coast, but the difference in reentry shock was not significant. Since there are so many people living on the East coast and West coast, their degree of adjustment may be not high. That reduces reentry shock.
OLS Regression Analysis
Table 9 presents the effect of predictors on reentry culture shock. Table 9: OLS Regression of Reentry Shock on Predictors
(One-tailed t tests) (N
=
204)Predictors DV = Reentry Shock
Age
Child Reentry Age
Length of Time after Return Current Employment Status Prev. Overseas Travel Experience Prev. Overseas Living Experience ( < 1 mon.) Value Change in the U.S.:
Behavioral Adjustment Social Involvement Gender Role Adjustment
Inviting Americans at home in the U.S. Child is Americanized.
Comm. with family in Japan during the sojourn Child readjustment to school in Japan Respondent' s satisfaction with child edu-cation in Japan Marital Satisfaction Intercept R ·square Adjusted R-square •p<.05, .. p<.01, •••p<.001 Full Model b B .132 .150 .. 121 .. 108 .. 014 .. 112 -1.362 .. 136 .. 1.089 .108* -1.653 .. 155** .240 .23o••• .. 018 .. 015 .111 .096 -1.312 . .087 .485 .052 -1.717 . .148 .. -1.523 . .155** -2.795 .. 302 ... .. 362 .. 077 17.567 .395 .348 b = U nstandardized coefficient B =Standardized coefficient
Reduced Model b B -1.221 .. 122* 1.387 .138 .. -1.976 .. 186*** .300 .288 ... -1.308 .. 166** -1.433 .. 145 .. -2.905 .. 313*** 19.727 .371 .349
Using one-tailed tests of significance was appropriate because direction was predicted. Both full and reduced models (stepwise regression) present standardized coefficients. Regression coefficients reveal that fifteen in-dependent variables together account for 39.5% of the variance in reentry culture shock. The reduced model saves seven predictors [current
employ-ment status, previous overseas travel experience, previous living overseas experience, behavioral adjustment due to living in the U.S., communication with family in Japan during the sojourn in the U.S., child (re)adjustment to school after reentry, and respondent's satisfaction with child's education in Japan], which account for about 37% of the variance.
By far the most significant predictors were mothers' satisfaction with child's education on reentry (beta
=
-.313, p<.001), students' (re)adjustment to school in Japan (beta = -.145, p<.01), behavioral adjustment due to living in the U.S. (beta = .288, p<.001). The results indicate that mothers who were not satisfied with the child's education in Japan experienced signifi-cantly greater reentry shock than those who were satisfied with the child' s education. Child's (re)adjustment to school had a significant direct effect on reentry shock (beta = -.145, p< .01). The findings revealed that mothers whose daughters/sons had difficulty readjusting to a school on reentry experienced greater reentry shock. The above data demonstrate that children's problems were a major headache for returning mothers. When their children could not adjust to school after reentry or mothers were not satisfied with their children's education in Japan, mothers were worried, which made them frustrated and resulted in reentry shock.Among the dimensions of value change, behavioral adjustment (value change subscale #1) was a significant predictor for reentry shock. The more behavioral adjustment due to living in the U.S., the greater the reentry shock they encountered. The results also indicated that their behavioral adjustment about achievement oriented behavior, individualism, using money, raising children, using time, expressing opinions, and leisure activity were significantly associated with reentry shock. Social involvement (value change subscale #2) and gender role adjustment (value change subscale #3) had no significant direct effect on reentry culture shock.
significant effect on reentry culture shock (beta
=
-.166, p<
.01). The more communication with the family in Japan during the sojourn in the U.S., the less the reentry shock.Of our control variables, current employment status, previous overseas travelling experience, and previous overseas living experience had signifi-cant direct effects on reentry culture shock.
Mothers who were not employed after reentry experienced greater reentry shock (beta
=
-.122, p<.05). This was expected considering that about 70% of mothers in the sample were not currently employed after returning home, even though 90% of the mothers had working experience before going to the U.S. Work provides people with an area for social interaction (Winton, 1995). If they are not employed, they lose chances for meeting and interacting with people who have shared interests and goals. Furthermore, mothers may lose the opportunity to satisfy their fulfillment through work. When mothers who worked equally with their husbands or on their own find that they are not allowed to work or cannot reach the same level of participation that they used to have, their frustration becomes high. The findings were consistent with previous studies which found that mother's employment was positively related to her self-concept, and marital satisfaction (Gass, 1959; Nye, 1963c; Feld, 1963; Birnbaum, 1971; Railings & Nye, 1979). When mothers want to work, but are not employed, they are most dissatisfied (Mirowskey and Ross, 1986; Segura, 1994). Mothers who had previous working experience but were not employed after reentry get frustrated. Unemployment contributes to loss of identity. They cannot answer the question, "Who am I?, What do I do?" They were more dissatisfied and tended to decrease their sense of self-esteem and mastery, which in turn increased depression (Mirowskey & Ross, 1986). More impor-tantly, mothers' unemployment also results in lack of a source of income which makes it difficult for them to manage the family budget.Furthermore, one of the major problems for women wishing to continue their careers or get a new job upon reentry is that their curriculum vitae or work resumes have a gap for the number of years they have been abroad (Piet-Pelon & Hornby, 1992). As mothers learn that their overseas experi-ence is not taken into consideration when applying to a job because they quit their previous job due to the husband's overseas assignment, they get more frustrated and experience greater reentry shock.
Mothers with previous overseas travelling experience reported greater reentry shock (beta = .138, p
<
.01), but those with previous overseas living experience reported less reentry shock (beta = -.186, p<
.001). Transitory overseas travel does not reduce reentry culture shock, while overseas living experience does reduce reentry shock.Marital satisfaction, child's Americanization, adjustment to living in the U.S. (inviting Americans at home in the U.S.), mothers' age, child's reentry age, and length of time after return had no impact on reentry shock. The adjusted R-square indicated that the reduced model accounted for about 35% of the variance in reentry culture shock.
Hypotheses Testing for Reentry Shock
Originally thirteen hypotheses were postulated. But based on the strength of correlation, the number of hypotheses was reduced to eleven: four background demographic variables, four for host country variables, and three for reentry variables.
Hypotheses are as follows:
1 . The younger the age at which mothers travel to the United States, the more their reentry shock.
2 . The more previous overseas experience, the less the reentry shock. a) The more previous overseas travel experience, the less the reentry
b) The more previous overseas living experience, the less the reentry shock.
3 . The greater the frequency of interaction with Americans, the more the reentry shock.
4 . The greater the change in basic values, the more the reentry shock. a) The more behavioral adjustment, the more the reentry shock. b) The more social involvement, the more the reentry shock. c) The more gender role adjustment, the more the reentry shock. 5 . The more communication with the home country while in the U.S., the
less the reentry shock.
6 . The longer the length of time after return, the less the reentry shock. 7 . The more Americanized Japanese children become in the U.S., the more
reentry shock.
8 . The easier children's (re)adjustment to school after reentry, the less the reentry shock.
9 . The more satisfied with the children's education after returning home, the less the reentry shock.
10. Mothers who are not employed after return are likely to experience more reentry shock than those who are employed.
11. The more satisfied with marriage, the less the reentry shock.
To test the eleven hypotheses, the zero-order multiple regressional analy-sis was employed. Multiple regression analyanaly-sis was selected as a powerful technique to analyze the relationship between a dependent variable (reentry shock) and a set of independent variables (eleven important factors). The zero-order regressional method was chosen simply because this study was an ·exploratory one and any hierarchy among the independent variables could not be assumed before the test. Table 9 presents the results of the regressional analysis (See the full model).
Hypothesis 2 predicted a significant negative relationship between previous overseas experience and reentry shock. Previous overseas experi-ence were divided into two: previous overseas travel experiexperi-ence and previ-ous overseas living experience. The results of the regression analysis showed that previous overseas travel experience (H2a) was significantly and positively related to reentry shock (beta= .108, p<.05). However, this hypothesis was not supported. The regression coefficients revealed that previous overseas living experience (H2b) was significantly and negatively related to reentry shock (beta= -.155, p < .01). Thus, hypothesis 2b was significantly supported by the data, suggesting that the more previous overseas living experience, the less the reentry shock.
Hypothesis 4 predicted that value change would be positively related to reentry shock. A confirmatory factor analysis generated three subscales of value change: a) behavioral adjustment, b) social involvement, and c) gender role adjustment. The regression coefficients showed that behavioral adjust-ment after living in the U.S. (H4a) was significantly and positively correlat-ed with reentry shock (beta= .230, p<.001). Thus, hypothesis 4a (behavioral adjustment) was significantly supported by the data, suggesting that the more behavioral adjustment, the more the reentry shock. However, the results of regression analysis revealed that social involvement (beta= -.015, n.s.) and gender role adjustment (beta= .096, n.s.) were not significant. Hypothesis 4b and Hypothesis 4c were not supported.
Hypothesis 5 predicted a negative relationship between communication with the home country during the sojourn and reentry shock. The regres-sion coefficients revealed that communication with family in Japan during the sojourn was significantly and negatively associated with reentry shock (beta= -.148, p<.Ol). Hypothesis 5 was significantly supported by the data, suggesting that the more communication with the home country while in the U.S., the less the reentry shock.
Hypothesis 8 [child (re)adjustment to school in Japan] was hypothes-ized to be significantly and negatively associated with reentry shock. The regression analysis revealed that child's (re)adjustment to school in Japan was significantly and negatively related to reentry shock (beta= -.155, p< .01). Thus, hypothesis 8 was supported, suggesting that the easier child (re)adjustment to school after reentry, the less the reentry shock.
Hypothesis 9 predicted a negative relationship between mothers' satis-faction with children's education in Japan and reentry shock. The regres-sion coefficients showed that mother's satisfaction with children's education in Japan was significantly and negatively correlated with reentry shock (beta= -.302, p < .001). Thus, hypothesis 9 was supported by the data, suggesting that the more satisfaction with child's education in Japan, the less the reentry shock.
Hypothesis 10 predicted a significant negative relationship between current employment status and reentry shock. The regression coefficients show that current employment status is negatively and significantly as-sociated with reentry shock (beta= -.136, p < .01). Hypothesis 10 was supported. It suggests that mothers who are not employed after return are likely to experience more reentry shock than those who are employed.
The multiple regression analysis did not support H1 (age) (beta= .150, n.s.), i.e., the younger the age at which mothers travel to the United States, the more their reentry shock. The regression analysis also did not show support for hypothesis 3 (the frequency of interaction with Americans) (beta= -.087, n.s.), i.e., the greater the frequency of interaction with Americans, the more the reentry shock. The regression analysis also provided no support for H6 (length of time after returning home) (beta= ·.112, n.s.), the longer the length of time after return home, the less the reentry shock. The multiple regression analysis did not support hypothesis 7 (child's Americanization) (beta= .052, n.s.), i.e., the more Americanized
Japanese children become in the U.S., the more reentry shock. The results of regression analysis also provided no support for hypothesis 11 (marital satisfaction) (beta= ·.077, n.s.), i.e., the more satisfied with marriage, the less the reentry shock.
2. Reentry Problems (Problems in Primary Relationships) (Dependent Variable #2)
Explaining Variation in Problems in Primary Relationships
Table 10 presents average scores for problems in primary relationships by previous overseas travel experience, previous living experience, respon-dent's participation of decision to live in the U.S., and length of sojourn in the U.S. As demonstrated in Table 10, respondents who had previous overseas travelling experience scored significantly higher on problems in primary relationships than those who didn't have overseas travelling experi-ence (p<.05). Respondents who had overseas living experiexperi-ence scored lower than those who didn't have. The difference was not significant. Those who traveled overseas for a short period of time tended to be exposed to and influenced by foreign cultures, which may affect interpersonal relations upon reentry.
Mean scores for problems in primary relationships for respondents who lived in the U.S. for two to four years were higher than those who lived there for over four years; the difference was statistically significant (p< .05). These results were contrary to the previous research which stated that those who lived in the foreign country for a long time were more likely to have reentry shock (or reentry problems). This is partly because the wives of Japanese corporate sojourners in the U.S. do not necessarily interact with Americans on a daily basis, compared with husbands and foreign students, which reduces mothers' degree of integration into Amer-ican culture. Also, previous measures of reentry shock are different from