Bilateral tariff rates in international trade
: finished goods versus intermediate goods
著者
Hayakawa Kazunobu
権利
Copyrights 日本貿易振興機構(ジェトロ)アジア
経済研究所 / Institute of Developing
Economies, Japan External Trade Organization
(IDE-JETRO) http://www.ide.go.jp
journal or
publication title
IDE Discussion Paper
volume
304
year
2011-08-01
INSTITUTE OF DEVELOPING ECONOMIES
IDE Discussion Papers are preliminary materials circulated to stimulate discussions and critical comments
Keywords: Gravity; Finished Goods Trade; Intermediate Goods Trade JEL classification: F10; F15
* Bangkok Research Center, Japan External Trade Organization, Thailand, ([email protected])
IDE DISCUSSION PAPER No. 304
Bilateral Tariff Rates in International Trade:
Finished Goods versus Intermediate Goods
Kazunobu HAYAKAWA*
August 2011
Abstract
In this paper, we examined back-and-forth international transactions through tariff reduction by estimating modified gravity equations for finished goods and intermediate goods separately. Our main findings are as follows. Exports of finished machinery products are negatively associated with not only the importer’s tariff rates on finished machinery products but also the exporter’s tariff rates on machinery parts. Similarly, exports of machinery parts are negatively associated with not only the importer’s tariff rates on machinery parts but also the exporter’s tariff rates on finished machinery products. These results imply that tariff reduction in only one production process in an industry has the potential to drastically change the magnitude of trade in the whole industry.
The Institute of Developing Economies (IDE) is a semigovernmental, nonpartisan, nonprofit research institute, founded in 1958. The Institute merged with the Japan External Trade Organization (JETRO) on July 1, 1998.
The Institute conducts basic and comprehensive studies on economic and related affairs in all developing countries and regions, including Asia, the Middle East, Africa, Latin America, Oceania, and Eastern Europe.
The views expressed in this publication are those of the author(s). Publication does not imply endorsement by the Institute of Developing Economies of any of the views expressed within.
INSTITUTE OF DEVELOPING ECONOMIES (IDE), JETRO 3-2-2, WAKABA,MIHAMA-KU,CHIBA-SHI
CHIBA 261-8545, JAPAN
©2011 by Institute of Developing Economies, JETRO
No part of this publication may be reproduced without the prior permission of the IDE-JETRO.
1. Introduction
In the recent wave of globalization, international vertical division of labor among production stages has grown rapidly worldwide and has increased the number of back-and-forth international transactions. One well-known example of production process-wise vertical division of labor is automobile production in the US–Mexico nexus. Cross-border production sharing between the US and Mexico has been accompanied by back-and-forth intra-firm transactions between headquarters in the US and their assembly plants in Maquila, Mexico. The Western Europe (WE)–Central and Eastern Europe (CEE) nexus is also an example. Indeed, exports of finished machinery
products from CEE to WE have experienced a rapid increase.1 As is known regarding
“Factory Asia” (Baldwin, 2006), international production and distribution networks in Asia would be the most outstanding example in terms of magnitude of production and trade through such division of labor. These networks have developed dramatically particularly in the machinery industries since the 1990s. The production process-wise vertical division of labor is one of the most prominent features in recent production patterns.
In the academic field, the development of the production process-wise vertical division of labor has motivated theoretical studies to explore the explosive increase in back-and-force international transactions. The well-known framework of the vertical division of labor is fragmentation theory, which was first proposed by Jones and Kierzkowski (1990). Fragmentation of production processes takes place when (i) production costs can be substantially reduced by the division of labor and (ii) the costs of service links connecting production blocks are not prohibitively high. In line with these mechanics of fragmentation, Amiti (2003) demonstrates theoretically that the mechanics of fragmentation plays the role of an industrial dispersion force and drastically changes industrial distribution in the finished goods sector and the intermediates goods sector through the input-output relationship between these sectors. It shows that the dramatic reduction of trade costs creates an agglomeration of the finished goods sector and the intermediate goods sector in different countries resulting in an explosive increase in trade in the two kinds of goods between these countries. Furthermore, Yi (2003) demonstrates that, as the number of separable production stages increases, the magnitude of trade increase through the reduction of trade costs rises explosively.
My empirical analysis in this paper is to closely examine the back-and-forth relationship in international fragmentation. As theoretical studies demonstrate, trade in
finished goods and intermediate goods are mutually related based on an input-output relationship. If a country increases its imports of intermediate goods, the country may increase its exports of finished goods to the source countries of the intermediate goods. In other words, a shock to intermediate goods imports in a country will also affect that country’s exports of finished goods. However, to my best knowledge, few studies have empirically examined the inter-relationship between trade in finished goods and intermediate goods. Existing empirical studies investigate the extent of international fragmentation, the role of factor price differentials on international fragmentation, the impact of international fragmentation on economic variables such as wages, and so on.2 On the other hand, our analysis takes a perspective different from existing studies, namely the mechanics of the inter-relationship between the finished goods trade and the intermediate goods trade.
Specifically, this paper sheds light on the role of tariff rates. We estimate modified gravity equations for finished goods and intermediate goods separately, by using worldwide data on bilateral tariff rates and trade in finished goods and intermediate goods. The usual analysis on the relationship between trade and tariff rates is to explore whether or not exports of finished goods (intermediate goods) are negatively associated with importers’ tariff rates on finished goods (intermediate goods). In this paper, in addition to this customary analysis, we further examine how a country’s exports of finished goods are related to its own tariff rates on imports of intermediate goods from the destination country of the finished goods. If a production process-wise vertical division of labor develops between two countries, reduction of intermediate goods’ tariff rates lowers the production cost for finished goods and thus increases the exports of finished goods to the country that exports intermediate goods. Also, we examine whether or not a country’s exports of intermediate goods are related to its tariff rates on imports of finished goods from the destination country of the intermediate goods.
The remainder of this paper is organized as follows. The next section provides the theoretical framework underlying our gravity equations. The empirical strategy for estimating the equations is explained in Section 3, and the regression results are reported in Section 4. Finally, Section 5 presents our conclusion.
2
These studies include Ando (2006), Baldone et al, (2001), Bonham et al. (2007), Egger and Egger (2002, 2003a, 2003b), Feenstra (1998), Gorg (2000), Hanson et al. (2005), Hummels et al. (1998, 2001), Kimura et al. (2007), Hayakawa and Kimura (2009), Ng and Yeats (2001), and Swenson (2000). The special volume “Outsourcing and Fragmentation: Blessing or Threat” in International
2. Empirical Framework
In this section, we provide an empirical framework for the analysis of the relationship in finished goods and intermediate goods between trade and tariff rates. Specifically, we employ the gravity equation for this analysis. In international economics, the “gravity equation” has been considered as the most powerful empirical tool in investigating the determinants of bilateral trade values. Its estimation always presents us with an excellent empirical fit. Relying on such properties, a large number of scholars have employed the gravity equation for investigation of bilateral trade. In addition, there are now a variety of theoretical models supporting the gravity formulation (see, for example, Combes et al. 2008: 127). In short, the gravity equation is a powerful tool from both theoretical and empirical points of view.
The traditional gravity equation has logs of importer’s and exporter’s GDPs and a log of distance between trading partners:
ln Tij = β0 + β1 ln GDPi + β2 ln GDPj + β3 ln Distanceij + εij.
Here, Tij represents bilateral goods exports of country i to country j. This gravity equation is often extended as follows:
ln Tij = β0 + β1 ln GDPi + β2 ln GDPj + β3 ln Distanceij + β4 Contingencyij + β5 Languageij + β6 Colonyij + εij. (1) “Contingency” takes unity if two countries share a national border and takes zero otherwise. “Language” is a dummy variable taking unity if a language is spoken by at least 9% of the population in both countries and takes zero otherwise. “Colony” takes unity if two countries have had colonial relationship in the past and takes zero otherwise.
As mentioned above, it is well known that this gravity equation can be supported by various kinds of theoretical models. In particular, under the usual assumptions in horizontal differentiation models (e.g., the CES utility function), Anderson and van Wincoop (2003) derive the following gravity equation (equation (9) on page 175):
σ τ − Π = 1 j i ij W j i ij P y y y x . (2) Here,
(
)
(
σ)
( σ) θ τ − −∑
≡ Π 1 1 1 j ij j j i P ,(
(
)
)
( σ) σθ τ − −∑
Π ≡ 1 11 i ij i i j P , and θj ≡ yj yW .country i, iceberg trade costs from countries i to j, and world nominal income, respectively. σ denotes the elasticity of substitution among varieties. Π and P are price indices and are also called “multilateral resistance” terms.
Although this model focuses on finished goods, the gravity equation can be applied to trade in intermediate goods. Assuming similar settings for the intermediate goods sector to the horizontal differentiation models above for the finished goods sector, as in Amiti (2003), we can obtain qualitatively the same formulation as equation (2) for trade in intermediate goods. In the case of gravity formulation in intermediate goods, yi and yj are the total production value of intermediate goods and the total expenditure on those goods, respectively. Π and P are price indices for intermediate goods. Thus, we can basically apply the gravity equation to the intermediate goods trade.
Taking the logs in equation (2), we obtain:
(
)
ij(
)
i(
)
j j i W ij y y y P x ln ln ln 1 1 ln 1ln ln = + + + −σ τ + σ − Π + σ − .Under the assumption that trade costs are a function of geographical distance, linguistic commonality, border contingency, and colonial relationship, in the case of the finished goods trade, this equation can be rewritten as
ln Tij = β0 + β1 ln GDPi + β2 ln GDPj + β3 ln Distanceij + β4 Contingencyij + β5 Languageij + β6 Colonyij + β7 ln Πi + β8 ln Pj + εij. (3) In the case of the intermediate goods trade, GDP might be not a good proxy for y.
Compared with traditional equation (1), this theory-based equation includes multilateral resistance terms, namely ln Πi and ln Pj. In order to control these terms, we follow the method proposed by Feenstra (2002), which replaces multilateral resistance variables with importer and exporter dummies. Thus, the gravity equation can be shown as
ln Tij = β0 + β3 ln Distanceij + β4 Contingencyij + β5 Languageij
+ β6 Colonyij + ui + uj + εij. (4) The inclusion of importer and exporter dummy variables forces us to drop importer and exporter GDPs. Moreover, due to their inclusion, we do not need to bother with the choice of proxy variables for not only multilateral resistance but also y in the case of the intermediate goods trade. In other words, we can avoid suffering bias due to their measurement error.
We modify the above gravity equation in certain ways. First, as mentioned so far, we regress it for the finished goods trade and the intermediate goods trade separately. Second, trade costs are assumed to further depend on bilateral tariff rates. These two
kinds of modification present us the following two gravity equations: ln Xsr = α1 ln (1+FTariffsr) + α2 ln Distancesr
+ α3 Languagesr + α4 Colonysr + α5 Contingencysr + us + ur + εsr and (5) ln Zsr = β1 ln (1+ITariffsr) + β2 ln Distancesr
+ β3 Languagesr + β4 Colonysr + β5 Contingencysr + vs + vr + ηsr. (6) Here, Xsr and Zsr indicate country s’s exports of finished goods and intermediate goods to county r, respectively. FTariffsr and ITariffsr are the tariff rates of country r on finished and intermediate goods produced in country s, respectively.
Our last modification is for conducting two-dimensional analysis between trade and tariff rates. Specifically, we regress the following equations:
ln Xsr = γ1 ln (1+FTariffsr) + γ2 ln (1+ITariffrs) + γ3 ln Distancesr + γ4 Languagesr + γ5 Colonysr + γ6 Contingencysr + us + ur + εsr and (7) ln Zsr = γ7 ln (1+FTariffrs) + γ8 ln (1+ITariffsr) + γ9 ln Distancesr
+ γ10 Languagesr + γ11 Colonysr + γ12 Contingencysr + vs + vr + ηsr. (8) Each equation includes bilateral tariff rates on both finished goods and intermediate goods. Notice that in each equation, the direction of tariff rates is different between these two kinds of goods. For example, the gravity equation for finished goods exports of country s to country r includes country r’s tariff rates on finished goods from country s and country s’s tariff rates on intermediate goods from country r. This equation is based on the expectation that reduction in the latter kind of tariff rates lowers the (consumer) price of intermediate goods from country r in country s and thus increases country s’s exports of finished goods to country r through the increase in intermediate goods input in country s. Similar arguments could be applied to the gravity equation for the intermediate goods trade. In short, these equations examine the validity of the input-output relationship in bilateral trade flow through tariff rates.
3. Data Issues
This section first presents the data sources of our variables and then gives an overview of trade and tariff rates on finished goods and intermediate goods.
3.1. Data Sources
Industries must be carefully chosen to obtain data that allows for differentiation of the finished goods and intermediate goods sectors. Our focus is placed on the machinery industries including industrial machinery, electric machinery, transport equipment, and precision machinery. In these industries, harmonized system (HS) codes are separately
available for both downstream and upstream sectors (Kimura and Obashi, 2010). Using these codes, we can classify HS 6-digit-level products into finished machinery products and machinery parts. Thus, by aggregating the HS 6-digit-level trade data on each kind of product drawn from the UN Comtrade database, we obtain bilateral trade values in finished machinery products and in machinery parts separately among 69 countries (see the appendix) during the period 2000-2008. The source of “Distance,” “Contingency,” “Language,” and “Colony” is the CEPII website.
Our data source for tariff rates is the World Integrated Trade Solution (WITS),34 particularly TRAINS raw data. In addition, some other sources are used for identifying exact tariff schemes for individual trading partners.5 In particular, we need to make a list of member countries of the WTO and each RTA. Also, GSP beneficiaries are different across importers. Information on the WTO and RTAs is obtained from the WTO website. We use the “Regional Trade Agreements Information System” for obtaining the RTA member list.6 As for GSP beneficiaries, we used several documents available on the UNCTAD website in addition to official documents on the national custom’s website of each country.7
While the list of these countries is mostly available for one specific year in each country, these countries may change over time, i.e., graduating from being a GSP beneficiary. Therefore, we may undercount/overcount GSP beneficiaries.
It is worth noting further three points. First, the version of Harmonized System (HS) is different across years in each country. In order to construct a tariff database comparable across years, we convert all HS versions (HS1996, HS2002, and HS2007)
to HS1992 using the HS conversion tables available from the UNSD.8
As a result, our background database of bilateral tariff rates is constructed at the 6-digit level of HS1992. Second, we put the latest rates available in the past into missing data. For example, if tariff data are missing in 2000 and 2001 during the period of 1996-2006, we use the rates in 1999 for those in 2000 and 2001. Third, we treat non-ad valorem
3
http://wits.worldbank.org/WITS/
4
The WITS is now the most powerful software developed by the World Bank, United Nations Conference on Trade And Development (UNCTAD), International Trade Center (ITC), United Nations Statistical Division (UNSD), and the WTO. This database includes tariff, para-tariff, and non-tariff measures at the national tariff line level by origin for more than 200 countries.
5
We assume that all firms use the tariff schemes with the lowest rates though some firms may be forced to use higher general tariff rates such as MFN rates because it is necessary to incur some kind of fixed costs for the use of preferential tariff schemes (Demidova and Krishna, 2008).
6 http://rtais.wto.org/UI/PublicMaintainRTAHome.aspx 7 http://www.unctad.org/Templates/Page.asp?intItemID=1418&lang=1 8 http://unstats.un.org/unsd/trade/conversions/HS%20Correlation%20and%20Conversion%20tables.
tariff rates simply as missing. Also, for simplicity, we use the lower rates for mixed tariff rates, though these treatments underestimate tariff rates to some extent.
We aggregate 6-digit-level tariff rates into the tariff rates of the finished machinery and machinery parts sectors by the simple average of 6-digit-level products categorized into those sectors in the above HS codes (Kimura and Obashi, 2010). Our focus on the machinery industries obviously decreases the magnitude of the above-mentioned underestimation through our treatment of non-ad valorem tariff rates and mixed tariff rates because these rates are mostly set in other industries, particularly the non-manufacturing industries. As a result, our database of bilateral tariff rates becomes (unbalanced) panel data of 69 countries and nine years (2000-2008).
3.2. Overview of the Machinery Trade and Tariff Rates
In this subsection, we provide an overview of the machinery trade and tariff rates. In order to examine time-series changes, in this subsection, we use balanced panel data. The sample countries included are also listed in the appendix.
Table 1 shows the trade values of finished machinery products and machinery parts according to continent/region. There are three noteworthy points. First, finished machinery (total and intra-regional) exports have experienced a more-than-double increase in all regions, except in America. In particular, the increase in total Asian exports of finished machinery products is outstanding from 400 billion US$ in 2000 to 919 billion US$ in 2008. Second, as well as the case of finished machinery products, a more-than-double increase in machinery parts exports can be observed in almost all regions. In particular, Asia turns out to be the largest exporter of machinery parts. Unlike in other regions, moreover, exports of machinery parts in Asia are larger than those of finished machinery products. Third, again, a significant increase in total imports of both kinds of products can be detected. Contrary to the case of exports, however, the major importer of finished machinery products is America in addition to Europe. But Asia plays a significant role as importer of machinery parts in 2008.
=== Table 1 ===
Table 1 also reports the shares of intra-regional exports and imports in the case of both finished machinery products and machinery parts. The share of intra-regional exports rises in most regions (particularly in Asia) for both kinds of products. Particularly in Europe, the share of intra-regional exports is rather high (more than 70%) for both kinds of machinery products. These facts may indicate the creation of
trade blocks in each region of the world, particularly in Asia. On the other hand, the share of intra-regional imports rises for both types of products in Asia and Europe, but not in America. This fact in America indicates that America plays the more important role as importer of machinery products from the world. Also, in Asia and Europe, the high shares of not only intra-regional exports but also intra-regional imports of machinery parts imply the active intra-regional vertical division of labor.
Next, we start to examine the tariff rates on finished machinery products and machinery parts. The averages of bilateral tariff rates of all sample pairs of finished machinery products and machinery parts are depicted in Figure 1. It shows their similar trend and magnitude between finished machinery products and machinery parts and further, their steady decreases from 2000 to 2008. The average tariff rates on machinery parts are a little lower than those on finished machinery products (known as “tariff escalation”), except in 2004. During the sample period, the average rates on both finished machinery products and machinery parts decreased by half: around 7.5% in 2000 to around 4.3% in 2008. Figures 2 and 3 show the rankings of the average bilateral tariff rates on finished machinery products and machinery parts for 2008, respectively. There are few differences in the rankings between these two kinds of products. More than half of the sample countries have average tariff rates of less than 5% on both types of products. Well-known champions in openness, namely Hong Kong and Singapore, following Switzerland, Georgia, Japan, and the member counties of the European Union (EU), are ranked first. Roughly, the less developed countries are also the less open countries in terms of bilateral tariff rates.
=== Figures 1-3 ===
Table 2 shows the inter- and intra-continental/regional tariff rates in the years 2000 and 2008. Taking a look at intra-regional tariff rates, i.e., “Within Region,” we can see that Europe has had rather low tariff rates on both types of products. Particularly in 2008, those tariff rates in Europe are less than 1% (notice that the Pacific region includes only Australia and New Zealand). The “To Outside Region” column shows the tariff rates applied when each region exports to outside. America and Asia face the almost same level of tariff rates on both types of products against outside regions as intra-regional tariff rates. On the other hand, while the tariff rates on both types of products against outside regions are lower than the intra-regional tariff rates in Africa, Europe has faced much higher tariff rates than the level of intra-regional tariff rates when exporting to outside countries. The “From Outside
Region” column indicates the tariff rates applied to countries outside each region. From this column, we can see “regional block”; inter-regional tariff rates are mostly higher than intra-regional tariff rates. However, inter-regional tariff rates in Europe are rather low.
=== Table 2 ===
4. Empirical Results
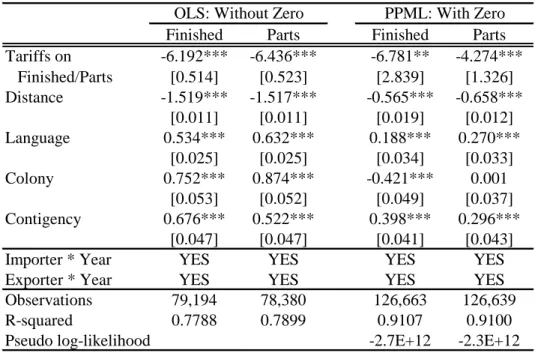
In this section, we empirically examine how bilateral tariff rates on finished machinery products and machinery parts are associated with those trade values by estimating the above-specified gravity equations. Table 3 shows the results of equations (5) and (6). In the “Without Zero” column, we exclude observations with zero-valued trade in finished goods or intermediate goods. The usual gravity variables (namely, variables other than tariff rates) have significant coefficients with expected signs in both types of equations. A greater geographical distance between two countries decreases bilateral trade values in finished and intermediate goods. Linguistic commonality, former colonial relationship, and sharing of a national border enhance these trade values. Also, the coefficients of these gravity variables have almost the same magnitude between finished and intermediate goods. The coefficients of tariff rates, which are one of our main interests, are negatively significant for both finished and intermediate goods. Thus, we can say that higher tariff rates discourage bilateral trade in the case of both finished and intermediate goods. The absolute value of these coefficients is almost same between the case of finished goods and the case of intermediate goods.
=== Table 3 ===
In the above estimation, we found the almost same magnitude of tariff effect between trade in finished goods and intermediate goods. From a theoretical point of view, the coefficient of tariff rates is related directly to the elasticity of substitution among varieties (σ). That is, if we assume the following trade cost function in (2),
( )
ij(
ij)
(
ij) (
ij)
(
ij)
ij Dis ce Contingency Language Colony Tariff
t =exp ⋅ tan 1⋅exp 2 ⋅exp 3 ⋅exp 4 ⋅ 1+
0 α α α α α , equation (4) is rewritten as
ln Tij = β0 + β3 ln Distanceij + β4 Contingencyij + β5 Languageij
Then, β9 is equal to 1-σ. Thus, the above estimates indicate that the elasticity is estimated to be 7 for both finished machinery products and machinery parts. Head and Ries (2001) and Hanson (2005) obtain estimates of σ ranging between 7 and 11 and
between 5 and 8, respectively. Anderson and van Wincoop (2004) conclude that σ is
likely to be in the range of 5–10. Thus, our magnitudes of elasticity are in line with those obtained in the literature.
In the recent literature on gravity, zero-valued trade appears as a hot issue. In our case, around 30% of country pairs have zero-valued trade. To naturally incorporate zero-valued trade into our sample, we estimate the above gravity equations using the Poisson pseudo-maximum likelihood (PPML) estimation technique, which is proposed by Silva and Tenreyro (2006). It enables us to estimate a gravity model that includes zero trade because the dependent variable is not the log of trade but the actual trade value. Furthermore, since independent variables are entered in logs, their coefficients can be still interpreted as elasticities.9 The results are reported in the “With Zero” column. The sign of almost all coefficients is the same as before, though the coefficients of “Colony” are not consistent with our expectation. In some variables, we can see a somewhat larger difference in the magnitude of coefficients between finished and intermediate goods. In particular, while the magnitude of tariff rates on finished goods rises, the magnitude of tariff rates on intermediate goods decreases. As a result, estimates of the elasticity of substitution turn out to be 8 in finished machinery products and 5 in machinery parts, which are reasonable magnitudes according to the literature.
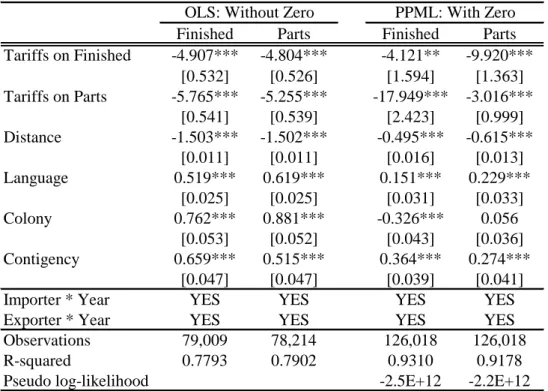
Next, we introduce bilateral tariff rates on other types of goods. The results of equations (7) and (8) are reported in Table 4. We focus on the case of zero-valued trade (i.e., PPML). There are three noteworthy points. First, the results of the coefficients of the usual gravity are unchanged compared with those in the “With Zero” column in Table 3. Second, in each equation, both kinds of tariff rates have significantly negative impacts, as is consistent with our expectation. That is, the exports of finished machinery products are negatively associated with not only the importer’s tariff rates
9
Another approach, which is proposed by Helpman, Melitz, and Rubinstein (2008). This is the extended technique of the Heckman two-step estimation. The first-step estimation examines the probability that two countries have positive trade values, and the second-step estimation is restricted to country pairs with positive trade and then examines its magnitude taking the results of the first-step estimation into account. While the PPML assumes that the zero trade does not have anything special in spite of its systematic reason, this method succeeds in accounting for the zero trade issue while taking the selection mechanics of trade into account. However, since we do not have good “excluded” variables available for our large sample (69 countries and nine years), which
on finished machinery products but also the exporter’s tariff rates on machinery parts. Similar arguments could be applied in the context of bilateral trade in machinery parts. In short, we find an interdependent relationship through tariff rates between trade in finished goods and intermediate goods. Third, interestingly, in the case of both finished machinery products and machinery parts, imports are more sensitive to the partner’s tariff rates on the other type of goods than to its own tariff rates on the type of goods concerned. In other words, we can say that there exists rather a strong interdependent relationship through tariff rates between trade in finished goods and intermediate goods.
=== Table 4 ===
5. Concluding Remarks
In this paper, we examined the back-and-forth relationship in international transactions through tariff reduction between finished goods and intermediate goods. To do this, we estimate modified gravity equations for worldwide trade in finished goods and intermediate goods separately. Our main findings are as follows. Exports of finished machinery products are negatively associated with not only the importer’s tariff rates on finished machinery products but also the exporter’s tariff rates on machinery parts. Similarly, exports of machinery parts are negatively associated with not only the importer’s tariff rates on machinery parts but also the exporter’s tariff rates on finished machinery products. In particular, we find a rather strong interdependent relationship through tariff rates between trade in finished goods and intermediate goods.
These results have important policy implications; policy on trade in one type of goods also may have significant impacts on trade in the other type of goods. For example, the policy of tariff reduction on intermediate goods may result in increasing not only the imports of intermediate goods but also the exports of finished goods. In particular, exports of finished goods may increase more significantly than imports of intermediate goods. This implies that tariff reduction in only one production process in an industry has potential to drastically change the magnitude of trade in the whole industry. As a result, we can say that in the case of tariff removal, it is important for policy makers to take the input-output relationship in international trade into account in order to avoid unexpected consequences of trade policy.
Appendix: Sample Countries
Region Country Region Country Africa Benin Asia Armenia Africa Botswana Asia Bahrain Africa Burkina Faso Asia Bangladesh Africa Burundi Asia Brunei Darussalam Africa Cameroon Asia Cambodia Africa Cape Verde Asia China* Africa Central African Republic Asia Georgia* Africa Cote d'Ivoire* Asia Hong Kong* Africa Djibouti Asia India* Africa Egypt Asia Indonesia* Africa Gabon Asia Israel* Africa Gambia Asia Japan* Africa Ghana* Asia Jordan* Africa Guinea Asia Korea* Africa Kenya* Asia Kuwait Africa Lesotho Asia Kyrgyzstan Africa Madagascar* Asia Macau (Aomen) Africa Malawi* Asia Malaysia* Africa Mali* Asia Maldives* Africa Mauritania Asia Nepal Africa Mauritius* Asia Oman* Africa Morocco* Asia Pakistan Africa Mozambique* Asia Philippines* Africa Namibia Asia Qatar Africa Niger Asia Saudi Arabia* Africa Nigeria Asia Singapore* Africa Rwanda Asia Sri Lanka Africa Senegal Asia Thailand* Africa South Africa* Asia United Arab Emirates Africa Swaziland Asia Viet Nam* Africa Tanzania, United Rep. of* Europe Albania*
Africa Togo Europe Belgium and Luxembourg* Africa Tunisia Europe Bulgaria
Africa Uganda* Europe Croatia Africa Zambia* Europe Cyprus Africa Zimbabwe Europe Czech Republic* America Antigua and Barbuda Europe Denmark America Argentina* Europe Estonia America Barbados Europe Finland* America Belize* Europe France* America Bolivia* Europe Germany* America Brazil* Europe Greece* America Canada Europe Hungary* America Chile* Europe Iceland* America Colombia Europe Ireland* America Costa Rica* Europe Italy* America Cuba Europe Latvia* America Dominica Europe Lithuania* America Dominican Republic Europe Luxembourg*
America Ecuador* Europe Macedonia (the former Yugoslav Rep. of) America El Salvador* Europe Malta*
America Grenada* Europe Moldova, Rep.of* America Guatemala* Europe Netherlands* America Guyana* Europe Norway America Honduras Europe Poland* America Jamaica Europe Portugal* America Mexico* Europe Romania* America Nicaragua* Europe Slovakia America Panama Europe Slovenia America Paraguay* Europe Spain* America Peru* Europe Sweden* America Saint Kitts and Nevis* Europe Switzerland* America Saint Lucia Europe Turkey* America Saint Vincent and the Grenadines Europe Ukraine* America Suriname Europe United Kingdom* America Trinidad and Tobago* Pacific Australia* America United States of America* Pacific Fiji America Uruguay* Pacific New Zealand* America Venezuela* Pacific Papua New Guinea
References
Amiti, M., 2005, Location of Vertically Linked Industries: Agglomeration versus Comparative Advantage, European Economic Review, 49(4): 809-832.
Ando, M., 2006, Fragmentation and Vertical Intra-industry Trade in East Asia, North
American Journal of Economics and Finance, 17(3): 257-281.
Ando, M. and Kimura, F., 2007, Fragmentation in Europe and East Asia: Evidences from International Trade and FDI Data, In: Ruffini, P.B., Kim, J.K. (Eds.).
Corporate Strategies in the Age of Regional Integration, Edward Elgar, 52-76.
Arndt, S. W., and Kierzkowski, H., 2001, Fragmentation: New Production Patterns in
the World Economy, Oxford: Oxford University Press.
Baldwin, R., 2006, Managing the Noodle Bowl: The Fragility of East Asian Regionalism, CEPR Discussion Papers, No. 5561.
Anderson, J. E. and van Wincoop, E., 2003, Gravity with Gravitas: A Solution to the Border Puzzle, American Economic Review, 93(1): 170-192.
Anderson, J. E. and van Wincoop, E., 2004, Trade Costs, Journal of Economic
Literature, 42: 691–751.
Baldone, S., Sdoagati, F., and Tajoli, L., 2001, Patterns and Determinants of International Fragmentation of Production: Evidence from Outward Processing Trade between the EU and Central Eastern European Countries,
Weltwirtschaftliches Archiv, 137(1): 80-104.
Combes, P.-P., Mayer, T., and Thisse, J.-F., 2008, Economic Geography, Princeton University Press.
Deardorff, A., 1998, Determinants of Bilateral Trade: Does Gravity Work in a Neoclassical World?, In: Jeffrey A. Frankel, (Eds.), The Regionalization of the
World Economy, University of Chicago Press: 7-28.
Demidova, S. and Krishna, K., 2008, Firm Heterogeneity and Firm Behavior with Conditional Policies, Economics Letters, 98: 122-128.
Egger, H. and Egger, P., 2002, How International Outsourcing Drives up Eastern European Wages, Weltwirtschaftliches Archiv, 138(1): 83-96.
Egger, H. and Egger, P., 2003a, Outsourcing and Skill-Specific Employment in a Small Economy: Austria after the Fall of the Iron Curtain, Oxford Economic Papers,
55(4): 625-643.
Egger, H. and Egger, P., 2003b, The Determinants of EU Processing Trade, World
Economy, 28(2): 147-168.
Economy, Journal of Economic Perspectives, 12(4): 31-50.
Feenstra, R., 2002, Border Effects and the Gravity Equation: Consistent Methods for Estimation, Scottish Journal of Political Economy, 49(5): 491-506.
Gorg, H., 2000, Fragmentation and Trade: US Inward Processing Trade in the EU,
Weltwirtschaftliches Archiv, 136(3): 403-422.
Hanson, G., 2005, Market Potential, Increasing Returns, and Geographic Concentration,
Journal of International Economics, 67: 1–24.
Hanson, G., Mataloni, R., and Slaughter, M., 2005, Vertical Production Networks in Multinational Firms, Review of Economics and Statistics, 87: 664-678.
Hayakawa, K. and Kimura, F., 2009, The Effect of Exchange Rate Volatility on International Trade in East Asia, Journal of the Japanese and International
Economies, 23(4): 395-406.
Head, K. and Ries, J., 2001, Increasing Returns versus National Product Differentiation as an Explanation for the Pattern of US-Canada Trade, American Economic
Review, 91: 858–876.
Helpman, E., Melitz, M., and Rubinstein, Y., 2008, Estimating Trade Flows: Trading Partners and Trading Volumes, Quarterly Journal of Economics, 123(2): 441-487.
Hummels, D., Ishi, J., and Yi, K-M., 2001, The Nature and Growth of Vertical Specialization in World Trade, Journal of International Economics, 54(1): 75-96.
Hummels, D., Rapoport, D., and Yi, K-M., 1998, Vertical Specialization and the Changing Nature of World Trade, Economic Policy Review, 4(2): 79-99.
Jones, R., and Kierzkowski, H., 1990, The Role of Services in Production and International Trade: A Theoretical Framework, In: R. Jones and A. Krueger (Eds.), The Political Economy of International Trade: Essays in Honor of Robert
E. Baldwin, Oxford: Basil Blackwell: 31-48.
Kimura, F. and Obashi, A., 2010, International Production Networks in Machinery Industries: Structure and Its Evolution, Papers DP-2010-09, Economic Research Institute for ASEAN and East Asia.
Kimura, F., Takahashi, Y., and Hayakawa, K., 2007, Fragmentation and Parts and Components Trade: Comparison between East Asia and Europe, North American
Journal of Economics and Finance, 18: 23-40.
Ng, F. and Yeats, A., 2001, Production Sharing in East Asia: Who does What for Whom, and Why?, In L. K. Cheng and H. Kierzkowski (Eds.), Global
Production and Trade in East Asia, Boston: Kluwer Academic Publishers:
63-109.
Silva, S. and Tenreyro, S., 2006, The Log of Gravity, Review of Economics and
Statistics, 88(4): 641-658.
Swenson, D., 2000, Firm Outsourcing Decisions: Evidence from U.S. Foreign Trade Zones, Economic Inquiry, 38(2): 175-89.
Yi, K-M., 2003, Can Vertical Specialization Explain the Growth of World Trade?,
Table 1. Intra- and Inter-regional Trade in Machinery Industry
(A) (B) (C) (D) (A)/(C) (B)/(D) (E) (F) (A)/(E) (B)/(F)
2000 2008 2000 2008 2000 2008 2000 2008 2000 2008 Africa Finished 0.5 1.9 2.4 9.7 19% 19% 11.7 40.2 4% 5% Parts 0.2 0.9 2.4 7.3 9% 13% 5.9 19.8 3% 5% America Finished 96 149 214 338 45% 44% 340 579 28% 26% Parts 96 112 251 312 38% 36% 279 397 34% 28% Asia Finished 122 312 400 919 30% 34% 222 522 55% 60% Parts 217 581 420 963 52% 60% 349 819 62% 71% Europe Finished 351 728 493 1,000 71% 72% 513 1,070 68% 68% Parts 253 562 371 797 68% 70% 402 827 63% 68% Pacific Finished 0.7 1.5 4.0 8.6 19% 17% 26.0 65.8 3% 2% Parts 0.4 0.8 3.4 6.3 11% 12% 12.9 23.6 3% 3% Total Imports (Billion US$) Share of Intra-regional Imports (%)
Intra-regional Trade Total Exports
(Billion US$) (Billion US$)
Share of Intra-regional Exports (%)
Table 2. Inter- and Intra-regional Tariff Rates in the Machinery Industry 2000 2008 2000 2008 2000 2008 Africa Finished 10 5 7 4 11 7 Parts 11 6 6 3 12 8 America Finished 10 5 7 4 10 6 Parts 9 4 7 4 10 6 Asia Finished 9 5 7 4 9 6 Parts 9 5 7 4 9 6 Europe Finished 2 0.3 10 6 3 1 Parts 2 0.2 10 6 3 1 Pacific Finished 2 0.0 8 5 2 2 Parts 2 0.0 8 5 3 2
Within Region (%) To Outside Region (%) From Outside Region (%)
Source: Author’s calculation based on the World Integrated Trade System (WITS)
Notes: The “Within Region” column indicates intra-regional tariff rates; the “To Outside Region” column reports the tariff rates applied when each region
Table 3. Basic Results of Gravity
Finished Parts Finished Parts
Tariffs on -6.192*** -6.436*** -6.781** -4.274*** Finished/Parts [0.514] [0.523] [2.839] [1.326] Distance -1.519*** -1.517*** -0.565*** -0.658*** [0.011] [0.011] [0.019] [0.012] Language 0.534*** 0.632*** 0.188*** 0.270*** [0.025] [0.025] [0.034] [0.033] Colony 0.752*** 0.874*** -0.421*** 0.001 [0.053] [0.052] [0.049] [0.037] Contigency 0.676*** 0.522*** 0.398*** 0.296*** [0.047] [0.047] [0.041] [0.043]
Importer * Year YES YES YES YES
Exporter * Year YES YES YES YES
Observations 79,194 78,380 126,663 126,639
R-squared 0.7788 0.7899 0.9107 0.9100
Pseudo log-likelihood -2.7E+12 -2.3E+12
OLS: Without Zero PPML: With Zero
Table 4. Results of Extended Gravity
Finished Parts Finished Parts
Tariffs on Finished -4.907*** -4.804*** -4.121** -9.920*** [0.532] [0.526] [1.594] [1.363] Tariffs on Parts -5.765*** -5.255*** -17.949*** -3.016*** [0.541] [0.539] [2.423] [0.999] Distance -1.503*** -1.502*** -0.495*** -0.615*** [0.011] [0.011] [0.016] [0.013] Language 0.519*** 0.619*** 0.151*** 0.229*** [0.025] [0.025] [0.031] [0.033] Colony 0.762*** 0.881*** -0.326*** 0.056 [0.053] [0.052] [0.043] [0.036] Contigency 0.659*** 0.515*** 0.364*** 0.274*** [0.047] [0.047] [0.039] [0.041]
Importer * Year YES YES YES YES
Exporter * Year YES YES YES YES
Observations 79,009 78,214 126,018 126,018
R-squared 0.7793 0.7902 0.9310 0.9178
Pseudo log-likelihood -2.5E+12 -2.2E+12
OLS: Without Zero PPML: With Zero
Figure 1. Trend in the World Average Tariff Rates for Machinery Goods (%) 4 5 6 7 8 2000 2001 2002 2003 2004 2005 2006 2007 2008
Finished Machinery Products
Machinery Parts
Figure 2. Ranking of Average Tariff Rates for Finished Machinery Products in 2008 (%) 0 5 10 15 20 25 H on g K on g Si ng apo re Sw itze rl an d Jap an G eor gia Cz ec h R epubl ic H ung ar y La tv ia Li thua ni a M al ta Po la nd Ro m an ia Be lg ium a nd L ux em bo ur g Fi nl an d Fr an ce G er m an y G re ece Ir el an d Ita ly Lux em bo ur g N et her la nd s Po rt ug al Sp ai n Sw ed en U ni te d K ing do m Tu rk ey Ice la nd U nit ed S ta tes of A m er ic a M aur iti us A lb an ia Sou th A fr ica A ust ra lia N ew Zea la nd M old ov a, R ep .of Is ra el Pe ru El S al va do r Cos ta R ica N ica ra gu a Ch ile G uat em al a Ph ili pp in es M al ay si a O ma n Sa udi A ra bi a M or occo Bo liv ia U kr ai ne Indo ne si a Tr ini da d a nd To ba go Kor ea U ga nda Ke nya Ta nz ani a, U ni te d R ep. o f M ex ic o U ru gu ay Par ag uay G ha na A rg en tin a Tha ila nd Ecu ad or Sa int K itt s a nd N ev is G uy ana Jor da n Vi et N am G re na da Be lize M oz am bi que M al aw i M al i Cot e d 'Iv oir e Ve nez uela Za mb ia Chi na Indi a M ad ag as car Br az il Ma ld ive s
Figure 3. Ranking of Average Tariff Rates for Machinery Parts in 2008 (%) 0 5 10 15 20 25 30 H on g K on g S ing ap o re S w itz er la n d G eo rg ia Ja p an B el g iu m a nd L u x em b o u rg C ze ch R ep u b li c F inl an d F ran ce G er m an y G reec e H un ga ry Ire la n d Ita ly L atv ia L it h ua ni a L ux em b o ur g M alt a N et h er la n ds P ol and P or tu g al R o m an ia S pa in S w ed en U ni te d K in g d o m T u rk ey Ice lan d U n ite d S ta te s o f A m er ic a E l S alv ad o r N ic ar agu a Co st a Ri ca G u at em al a A lb ani a N ew Z ea lan d M o ld o va , R ep .of P eru S o u th A fr ic a A u str al ia Is ra el M au ri tiu s P h il ip p in es Ch il e In do n es ia T ri n id ad a n d T o b ag o U kr ai n e M ala y si a M ex ico Om an S au di A ra b ia E cu ad o r K o rea T h ai lan d B o liv ia V iet N am S ain t K it ts a n d N ev is G u y an a C h in a B el ize G re n ad a P ar ag u ay In d ia K en ya U ga nd a M o za m b iqu e G ha na T an zan ia , U n it ed R ep . o f U ru g u ay M o ro cco V en ezu el a C o te d 'I v o ir e M ali M ad ag as car A rg en ti n a M ala w i Z am b ia Jo rd an B raz il M ald iv es