Integrated Hazard and Risk Maps Using
Analytical Hierarchy Process Considering Land
Use and Climate Change Issues in Lao PDR
著者
PHRAKONKHAM SENGPHRACHANH
学位授与機関
Tohoku University
学位授与番号
11301甲第19297号
I
Doctoral Dissertation
Dissertation Title
Integrated Hazard and Risk Maps Using Analytical Hierarchy
Process Considering Land Use and Climate Change Issues in Lao
PDR
PHRAKONKHAM SENGPHRACHANH
Department Civil and Environmental Engineering
Graduate School of Engineering
TOHOKU UNIVERSITY
II
ACKNOWLEFGEMENTS
First and foremost, I am grateful to my advisor Professor So Kazama and Assoc. Prof. Dr. Daisuke Komori, for their supervision on our research, gave me the guidance and opportunity to be part of his research group in Hydro-Environmental System Laboratory and an excellent chance for the financial support under Japanese Government Scholarship (Monbukagakusho) from Ministry of Education, Culture, Sports, Science and Technology, The Environment Research and Technology Development Fund of the Ministry of the Environment, Japan, Advancing Co-design of Integrated Strategies with Adaptation to Climate Change (ADAP-T) of JST/JICA, SATREPS, which sustained my cost of living during the Doctoral degree fulfillment at the Graduate School of Civil Engineering, Tohoku University.
I would like to express my sincere and appreciation to the other member of the examination committee, Professor Hitoshi Tanaka and Associate Professor Makoto Umeda who evaluated my work and given many comments to improve the dissertation.. I am extremely grateful to all member in Hydro-Environmental System Laboratory, Department of Civil Engineering, Tohoku University, who helped and supported me during my stay in Japan. They had spent time to bring me to places in Japan and given me a valuable experience with Japanese language and culture.
Lastly, I would like to express my gratitude to my family, who gave me the great chance to study in Japan, funding support, merciful guidance and the best encouragement. I also would like to express my gratefulness to my wife (Soliya Sopha) and my un-born daughter for their support and understanding during my pursuit of Ph.D degree
III
Integrated Hazard and Risk Maps Using Analytical Hierarchy Process
Considering Land Use and Climate Change Issues in Lao PDR
ABSTRACT
:In recent decades, many floods have occurred in Laos. To reduce the impacts and losses from flood events, it is important to understand the magnitude of each flood and the area it could potentially impact. Land use change and climate change have played significant roles, and it is important to understand the impacts of flooding. Landslides are another hazard that can occur after flooding. Therefore, flood hazard mapping serves as an important tool for decision-makers to identify sensitive areas. We have developed an integrated hazard map based on a combination of five hazard maps, including flood, land use change, landslide climate change impact to flood and climate change impact to landslide hazard maps. The analytical hierarchy process (AHP) is a tool for multi-criteria decision making. This method used the AHP as a tool to combine the different hazard maps into an integrated hazard map. The AHP is used to provide the relative weights of each hazard map. It is necessary to understand the relative importance of each hazard map, and this can be done by using the pairwise comparison matrix to compare their significance. The value of each row in a pairwise comparison was determined based on the judgment of experts. The result shows that the areas around southern and northern Laos have a high hazard value. Then, we compared our result with the historical record to validate our study.
Risk mapping serves as an important tool for decision-makers to identify sensitive areas. We propose integrated risk maps based on integrated hazard maps and land use categories. The integrated hazard maps consist of five hazard maps, i.e., flood, land use change, landslide, climate change leading to floods and climate change leading to landslides.. The vulnerabilities are discussed based on each hazard and the land use data, which are classified into 3 categories: urban areas, agricultural areas and paddy fields. The results show that the areas in the southern (12 billion USD) and central regions (16 billion USD) of Lao PDR sustain the highest damage cost in the 2100s under representative concentration pathway (RCP) 8.5.
IV
Contents
ACKNOWLEFGEMENTS ... II ABSTRACT: ... III List of Figure ... VI List of Table ... X CHAPTER 1: INTRODUCTION ... 1 1.1. Research context ... 11.1.1. Flood and landslide situation in Laos ... 1
1.1.2. Impact of land use change ... 2
1.1.3. Impact of climate change ... 3
1.2. Objective of study ... 4
1.3. Organization of dissertation ... 6
CHAPTER 2: LITERATURE REVIEW ... 8
2.1 Concept of integrated hazard and hazards in study area ... 8
2.1.1 Integrated hazard ... 8
2.1.2 Analytical Hierarchy Process ... 9
2.1.3 Hazards in Lao PDR ... 11
2.2. Integrated risk ... 18
2.3. Significance of this study ... 20
CHAPTER 3: STUDY AREA AND DATA SOURCES ... 21
3.1 Study area ... 21
3.1.1 Location and topography ... 21
3.1.2 Climate ... 25
3.1.3 Land use ... 26
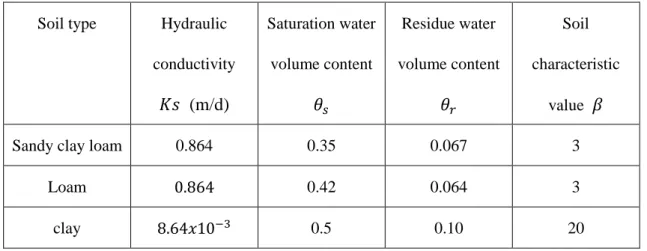
3.1.4 Soil type ... 30
3.2 Data sources ... 31
3.2.1 Meteorological and hydrological data ... 31
3.2.2 Digital elevation model and GIS data ... 33
3.2.3 Future scenario data ... 33
CHAPTER 4: METHODOLOGY ... 37
4.1 Outline of method ... 37
4.2 Flood hazard ... 37
4.3 Landslide hazard ... 40
4.4 Land use change hazard ... 44
V
4.6 Hazard index ... 46
4.6.1 Flood hazard index classification ... 46
4.6.2 Land slide hazard index classification ... 48
4.7 Analytical Hierarchy Process (AHP) ... 49
4.8 AHP-based integrated hazard ... 56
4.9 Risk assessment ... 57
4.10 Cost-benefit analysis ... 58
4.11 Inverse Weight Distance ... 59
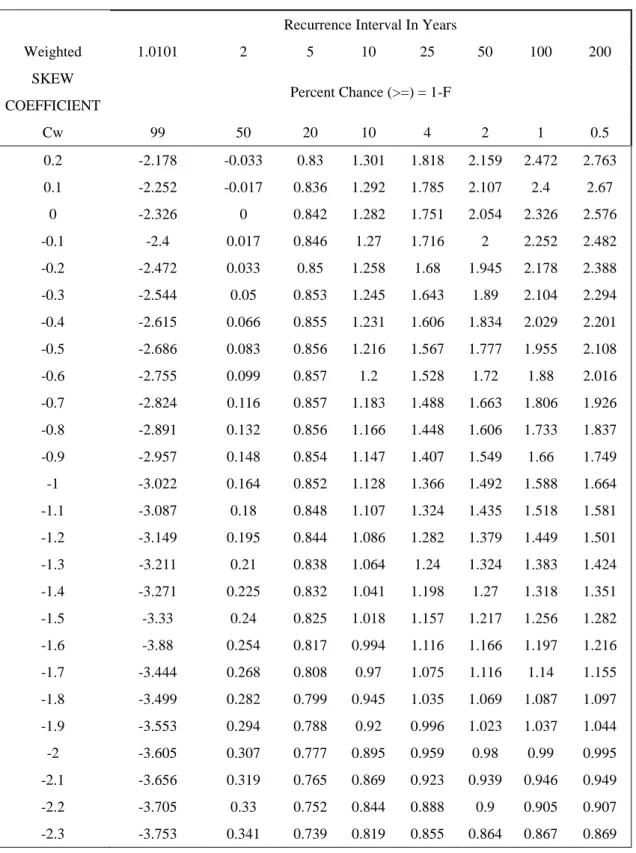
4.12 Log Pearson type III ... 60
4.13 Model performance indicator ... 63
CHAPTER 5: ASSESSMENT OF INDIVIDUAL MAP AND INTEGRATED HAZARD MAPS ... 65
5.1 Introduction ... 65
5.2 Results ... 67
5.2.1 Flood hazard map ... 67
5.2.2 Landslide hazard map ... 69
5.2.3 Land use change hazard map ... 71
5.2.4 Climate change hazard map ... 73
5.2.5 Integrated hazard map ... 79
5.2.6 Validation ... 82
5.3 Discussion ... 90
CHAPTER 6: ESTIMATION OF SPATIAL RISK FOR MULTI HAZARD AND ADATATION MEASURE FOR REDUCE DAMAGE COST IN LAO PDR ... 124
6.1 Introduction ... 124
6.2 Results ... 125
6.2.1 Damage cost form flood risk map ... 125
6.2.2 Damage cost from landslide risk map ... 127
6.2.3 Damage cost form land use change risk map ... 127
6.2.4 Damage cost form climate change hazard risk map ... 130
6.2.5 Integrated risk map ... 135
6.2.6 Adaptation measure to reduce damage costs ... 138
6.3 Discussion ... 145
CHAPTER 7: CONCLUSIONS AND RECOMMENDATIONS ... 183
VI
List of Figure
Figure 1-1 Schematic of the dissertation context 7
Figure 3-1 Location and Topography of Lao PDR 21
Figure 3-2 Lao PDR’s Provinces map 22
Figure 3-3 Annual rainfall of Lao PDR 26
Figure 3-4 Land use type of Lao PDR 27
Figure 3-5: Rice price map of Lao PDR 28
Figure 3-6: Agricultural production price map of Lao PDR 29
Figure 3-7 Soil type of Lao PDR 30
Figure 3-8 100 year return period rainfall in Lao PDR 32
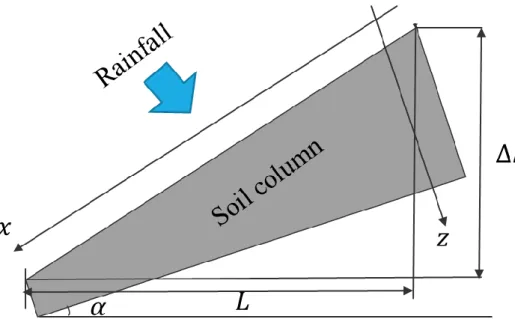
Figure 4-1 Schematic diagram for infiltration analysis to obtain the hydraulic gradient
41
Figure 4.2 Flood depth-velocity relationship to hazard index 47
Figure 4.3 Flood depth-hazard index relationship 47
Figure 4-4 Flood depth and hazard index relationship curve 47
Figure 5-1 Flood hazard map and flood historical events 68
Figure 5-2 Landslide hazard map and landslide historical events 70
Figure 5-3 Land use change hazard map 72
Figure 5-4 Flood hazard maps with the ensemble average of heavy rainfall from the 7 GCMs that used data under the RCP2.6, RCP4.5 and RCP8.5 scenarios
75
Figure 5-5 Percentage of flood hazard area in Lao PDR: (1) near future and (2) far future
76
Figure 5-6 landslide hazard maps with the ensemble average of heavy rainfall from the 7 GCMs that used data under the RCP2.6, RCP4.5 and RCP8.5 scenarios
77
Figure 5-7 Percentage of landslide hazard area in Lao PDR: (1) near future and (2) far future
78
Figure 5-8 Integrated hazard maps with the ensemble average of heavy rainfall from the 7 GCMs that used data under the RCP2.6, RCP4.5 and RCP8.5 scenarios
80
Figure 5-9 Percentage of integrated hazard area in Lao PDR: (1) near future and (2) far future
VII
Figure 5-10 Rainfall station in Lao PDR 84
Figure 5-11 Comparison of observed and simulated discharges in 3 basins (Jan.1 to Dec.31, 2000).
85
Figure 5-12 Comparison of flood and land slide historical event to integrated hazard map of scenario RCP 2.6 time period of near future
89
Figure 5-13 Future flood hazard maps for 100 years return period under scenario of (a) RCP 2.6, (b) RCP 4.5 and (c) RCP 8.5 during near future period also the difference of hazard index between (d) RCP 4.5 and RCP 2.6 and (e) RCP 8.5 and RCP 4.5
99
Figure 5-14 Comparison of rainfall between 3 scenarios: (a) RCP 2.6, (b) RCP 4.5 and (c) RCP 8.5 during near future also the difference of rainfall between (e) RCP 4.5 and RCP 2.6 scenario and (e) RCP 8.5 and RCP 4.5 scenario
102
Figure 5-15 Future flood hazard maps for 100 years return period under scenario of (a) RCP 2.6, (b) RCP 4.5 and (c) RCP 8.5 during far future period also the difference of hazard index between (d) RCP 4.5 and RCP 2.6 and (e) RCP 8.5 and RCP 4.5
103
Figure 5-16 Comparison of rainfall between 3 scenarios: (a) RCP 2.6, (b) RCP 4.5 and (c) RCP 8.5 during far future also the difference of rainfall between (e) RCP 4.5 and RCP 2.6 scenario and (e) RCP 8.5 and RCP 4.5 scenario
104
Figure 5-17 Future landslide hazard maps for 100 years return period under scenario of (a) RCP 2.6, (b) RCP 4.5 and (c) RCP 8.5 during near future period also the difference of hazard index between (d) RCP 4.5 and RCP 2.6 and (e) RCP 8.5 and RCP 4.5
108
Figure 5-18 Future landslide hazard maps for 100 years return period under scenario of (a) RCP 2.6, (b) RCP 4.5 and (c) RCP 8.5 during far future period also the difference of hazard index between (d) RCP 4.5 and RCP 2.6 and (e) RCP 8.5 and RCP 4.5
111
Figure 5-19 Integrated hazard maps for 100 years return period under scenario of (a) RCP 2.6, (b) RCP 4.5 and (c) RCP 8.5 during near future period also the difference of hazard index between (d) RCP 4.5 and RCP 2.6 and (e) RCP 8.5 and RCP 4.5
116
VIII
scenario of (a) RCP 2.6, (b) RCP 4.5 and (c) RCP 8.5 during far future period also the difference of hazard index between (d) RCP 4.5 and RCP 2.6 and (e) RCP 8.5 and RCP 4.5
Figure 6-1 Damage cost/year of flood hazard risk map in Lao PDR 124
Figure 6-2 Damage cost/year of landslide hazard risk map in Lao PDR 126
Figure 6-3 Damage cost of land use change risk map in Lao PDR 127
Figure 6-4 Damage cost of climate change impact to flood risk map for RCP 2.6, 4.5 and 8.5 for near future (2050s) and far future (2100s) in Lao PDR
130
Figure 6-5 Damage cost of climate change impact to land slide risk map for RCP 2.6, 4.5 and 8.5 for near future (2050s) and far future (2100s) in Lao PDR
131
Figure 6-6 Comparison of total damage cost of flood, land use change and climate change impact to flood risks in Lao PDR
132
Figure 6-7 Comparison of total damage cost of landslide and climate change impact to landslide risks in Lao PDR
132
Figure 6-8 Damage cost of integrated risk map for RCP 2.6, 4.5 and 8.5 for near future (2050s) and far future (2100s)
135
Figure 6-9 Comparison of total damage cost from integrated risks in Lao PDR
136
Figure 6-10 Relocation cost of agricultural area 138
Figure 6-11 Relocation cost of paddy field 139
Figure 6-12 B/C ratio with discount rates (𝑟 = 0.05 and 0.1) in the case of relocation from agricultural and paddy field with RCP 2.6 scenario for the intergrated risk map
140
Figure 6-13 6-12 B/C ratio with discount rates (𝑟 = 0.05 and 0.1) in the case of relocation from agricultural and paddy field with RCP 4.5 scenario for the intergrated risk map
141
Figure 6-14 6-12 B/C ratio with discount rates (𝑟 = 0.05 and 0.1) in the case of relocation from agricultural and paddy field with RCP 8.5 scenario for the intergrated risk map
142
Figure 6-15 Future flood risk maps under scenario of (a) RCP 2.6, (b) RCP 4.5, (c) RCP 8.5, the difference of hazard index between (d) RCP 4.5 and RCP 2.6 scenario, and (e) RCP 8.5 and RCP 4.5 scenario during near future
153
Figure 6-16 Future flood risk maps under scenario of (a) RCP 2.6, (b) RCP 4.5, (c) RCP 8.5, the difference of hazard index between (d) RCP 4.5 and RCP 2.6 scenario, and (e) RCP 8.5 and RCP 4.5 scenario during far future
IX
Figure 6-17 Future landslide risk maps under scenario of (a) RCP 2.6, (b) RCP 4.5, (c) RCP 8.5, the difference of hazard index between (d) RCP 4.5 and RCP 2.6 scenario, and (e) RCP 8.5 and RCP 4.5 scenario during near future
161
Figure 6-18 Future landslide risk maps under scenario of (a) RCP 2.6, (b) RCP 4.5, (c) RCP 8.5, the difference of hazard index between (d) RCP 4.5 and RCP 2.6 scenario, and (e) RCP 8.5 and RCP 4.5 scenario during far future
164
Figure 6-19 Integrated risk maps under scenario of (a) RCP 2.6, (b) RCP 4.5, (c) RCP 8.5, the difference of hazard index between (d) RCP 4.5 and RCP 2.6 scenario, and (e) RCP 8.5 and RCP 4.5 scenario during near future
170
Figure 6-20 Integrated risk maps under scenario of (a) RCP 2.6, (b) RCP 4.5, (c) RCP 8.5, the difference of hazard index between (d) RCP 4.5 and RCP 2.6 scenario, and (e) RCP 8.5 and RCP 4.5 scenario during far future
X
List of Table
Table 3-1 List of Global Climate Models (GCMs) used in this study 36
Table 4-1 Properties of soil types used for infiltration analysis 44
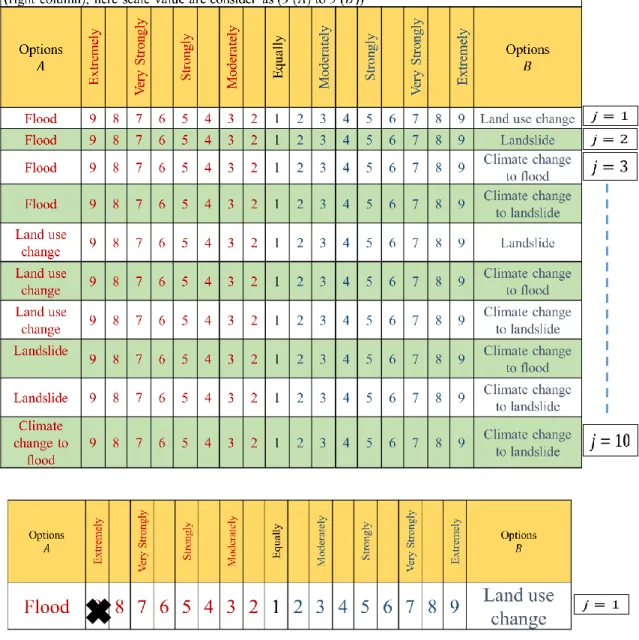
Table 4-2 Questionnaire of preference for AHP approach. 51
Table 4-3 Result of pairwise comparison from questionnaires 52
Table 4-4 AHP pairwise comparison matrix (𝑫𝑖,𝑘) 53
Table 4-5 Pairwise comparison matrix, with the weight of each criteria 54
Table 4-6 Random index (𝑅𝑖) used to compute consistency ratio. 55
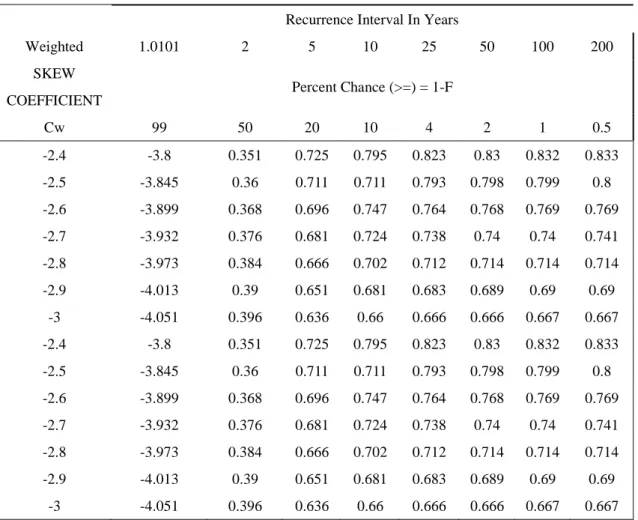
Table 4-7 Frequency Factors K for Gamma and log-Pearson Type III Distributions (Haan, 1977)
61 Table 5.1 Nash-Sutcliffe efficiency (𝐸) and 𝑅2 of all station in Laos from
(Jan.1 to Dec31, 2000)
83
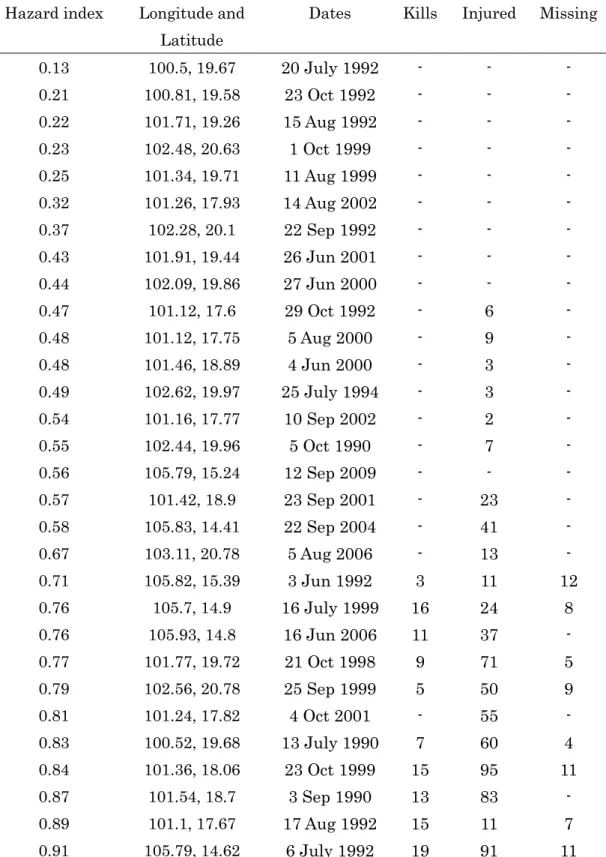
Table 5-2 Comparison between flood hazard results with 100 years return period and historical flood events occurrence in Lao PDR
86
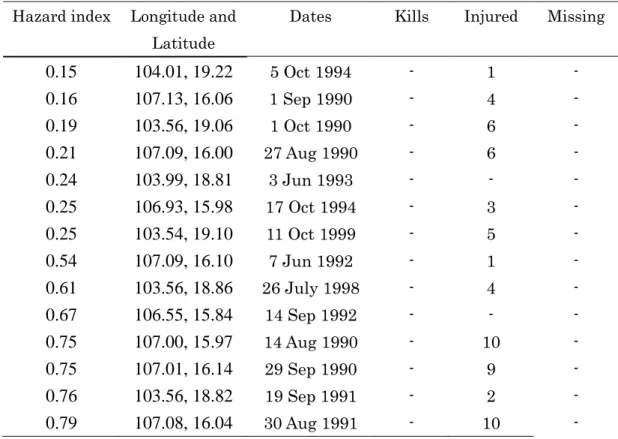
Table 5-3 Comparison between land slide hazard results with 100 years return period and historical land slide events occurrence in Lao PDR
87
Table 5-4 Percentage of high and very high hazard area from flood hazard map in each province
91
Table 5-5 Percentage of high and very high hazard area from landslide hazard map in each province
93
Table 5-6 Percentage of high area from land use change impact to flood hazard map in each province and percentage of increase from current flood hazard map
95
Table 5-7 Percentage of very high area from land use change impact to flood hazard map in each province and percentage of increase from current flood hazard map
96
Table 5-8 Percentage of very high hazard area from climate change impact to flood hazard map under near future scenario in each province and percentage of increase between RCP 4.5 and RCP 2.6
100
Table 5-9 Percentage of very high hazard area from climate change impact to flood hazard map in each province under near future scenario and percentage of increase between RCP 8.5 and RCP 4.5
101
Table 5-10 Percentage of very high hazard area from climate change impact to flood hazard map under far future scenario in each province and
XI
percentage of increase between RCP 4.5 and RCP 2.6
Table 5-11 Percentage of very high hazard area from climate change impact to flood hazard map under far future scenario in each province and
percentage of increase between RCP 8.5 and RCP 4.5
106
Table 5-12 Percentage of very high hazard area from climate change impact to landslide hazard map under near future scenario in each province and percentage of increase between RCP 4.5 and RCP 2.6
109
Table 5-13 Percentage of very high hazard area from climate change impact to landslide hazard map in each province under near future scenario and percentage of increase between RCP 8.5 and RCP 4.5
110
Table 5-14 Percentage of very high hazard area from climate change impact to landslide hazard map under far future scenario in each province and percentage of increase between RCP 4.5 and RCP 2.6
112
Table 5-15 Percentage of very high hazard area from climate change impact to landslide hazard map in each province under far future scenario and percentage of increase between RCP 8.5 and RCP 4.5
113
Table 5-16 Percentage of very high hazard area from integrated hazard map under near future scenario in each province and percentage of increase between RCP 4.5 and RCP 2.6
117
Table 5-17 Percentage of very high hazard area from integrated hazard map in each province under near future scenario and percentage of increase between RCP 8.5 and RCP 4.5
118
Table 5-18 Percentage of very high hazard area from integrated hazard map under far future scenario in each province and percentage of increase between RCP 4.5 and RCP 2.6
120
Table 5-19 Percentage of very high hazard area from integrated hazard map in each province under far future scenario and percentage of increase between RCP 8.5 and RCP 4.5
121
Table 6-1 Total damage cost from flood risk areas in each province. 146 Table 6-2 Total damage cost from land use change impact to flood risk areas
in each province.
148
Table 6-3 Total damage cost from landslide risk areas in each province 150
Table 6-4 Total damage cost from climate change impact to flood risk map in each province and percentage of increase between RCP 4.5 and 2.6
XII
scenario during near future
able 6-5 Total damage cost from climate change impact to flood risk map in each province and percentage of increase between RCP 8.5 and 4.5 scenario during near future
155
Table 6-6 Total damage cost from climate change impact to flood risk map in each province and percentage of increase between RCP 4.5 and 2.6 scenario during far future
157
Table 6-7 Total damage cost from climate change impact to flood risk map in each province and percentage of increase between RCP 8.5 and 4.5 scenario during far future
158
Table 6-8 Total damage cost from climate change impact to landslide risk map in each province and percentage of increase between RCP 4.5 and 2.6 scenario during near future
162
Table 6-9 Total damage cost from climate change impact to landslide risk map in each province and percentage of increase between RCP 8.5 and 4.5 scenario during near future
163
Table 6-10 Total damage cost from climate change impact to landslide risk map in each province and percentage of increase between RCP 4.5 and 2.6 scenario during far future
165
Table 6-11 Total damage cost from climate change impact to landslide risk map in each province and percentage of increase between RCP 8.5 and 4.5 scenario during far future
166
Table 6-12 Total damage cost from integrated risk map in each province and percentage of increase between RCP 4.5 and 2.6 scenario during near future
171
Table 6-13 Total damage cost from integrated risk map in each province and percentage of increase between RCP 8.5 and 4.5 scenario during near future
172
Table 6-14 Total damage cost from integrated risk map in each province and percentage of increase between RCP 4.5 and 2.6 scenario during far future
174
Table 6-15 Total damage cost from integrated risk map in each province and percentage of increase between RCP 8.5 and 4.5 scenario during far future
175
Table 6-16 Percentage of relocatable area from agricultural and paddy field in each province and percentage of decrease between RCP 2.6 and RCP4.5 scenario with discount rate (𝑟 = 0.05)
179
Table 6-17 Percentage of relocatable area from agricultural and paddy field in each province and percentage of decrease between RCP 4.5 and RCP 8.5 scenario with discount rate (𝑟 = 0.05)
XIII
Table 6-18 Percentage of relocatable area from agricultural and paddy field in each province and percentage of decrease between RCP 2.6 and RCP4.5 scenario with discount rate (𝑟 = 0.1)
181
Table 6-19 Percentage of relocatable area from agricultural and paddy field in each province and percentage of decrease between RCP 4.5 and RCP 8.5 scenario with discount rate (𝑟 = 0.1)
182
LIST OF ABBREVIATIONS
AHP Analytical Hierarchy Process CDF Cumulative Distribution Function DEM Digital Elevation Map
GCMs General Circulation Models GHG Green House Gas
GIS Geographic Information System GoL Government of Laos
HWSD Harmonized World Soil Database IDW Inverse Disctince Weight
RCP Representative Concentration Pathway SU Soil Unit
XIV
∆𝐻 variation of depth (m)
∆𝑡 time interval of flow direction (d)
∆𝑥 mash interval of flow direction (m)
𝑟𝑒 precipitation (m/d)
𝐵 width of flow path (m)
𝑄 flow rate (m3/d)
ℎ water depth (m)
𝐼 gradient slope
𝑛 manning roughness coefficient (d/m1/3)
Rin amount of infiltration (m/d)
ka infiltration coefficient (d-1)
𝑠 apparent storage level (m)
𝑞 outflow level of base flow (m/d)
𝐿𝑝 probability of a landslide
ℎ𝑦𝑑𝑟𝑜 hydraulic gradient
𝑟𝑒𝑙𝑖𝑒𝑓 relative relief (m)
𝜃 water volume content
𝑉𝑥 velocity in the horizontal (m/d)
𝑉𝑧 velocity in vertical direction (m/d)
𝐾 unsaturated hydraulic conductivity (m/d)
ℎℎ total hydraulic head (m)
𝜓 hydraulic pressure head (m)
𝛼 Slope angle (degree)
𝐿𝑥 grid size in horizontal (m)
𝐿𝑧 grid size in vertical (m)
𝐶 specific moisture capacity
𝐾𝑠 saturated hydraulic conductivity (m/d)
𝛽 soil characteristic value
𝜃𝑟 residual water volume content
𝜃𝑠 saturation water volume content
𝜓0 initial pressure (m)
𝜓′ saturated pressure (m)
XV
𝑧𝑔𝑐𝑚 precipitation from GCMs before bias correction
(m/d)
𝐶𝐷𝐹𝑔𝑐𝑚 Cumulative Distribution Function (CDF) of 𝑧𝑔𝑐𝑚
𝐶𝐷𝐹0−1 inverse CDF of observed rainfall
𝑅𝑒𝑙𝑗 relative important of pairwise 𝑗th (𝑗 =1, 2, …10)
𝐴𝑚,𝑗 element response from questionnaire from option
A (𝑗 =1, 2, …10)
𝐵𝑚,𝑗 element response from questionnaire from option
B (𝑗 =1, 2, …10)
𝒘𝑖 weight priority of each criteria (𝑖 = 1, 2,…., 𝑁)
𝑚 Number of samples from questionnaire
𝐶𝑅 consistency ratio
𝐶𝐼 consistency index
𝑅𝑖 random index
𝜆𝑚𝑎𝑥 maximum eigenvalue
𝑫𝑖,𝑘 a pair-wise comparison matrix (𝑘 =
1, 2, … . , 𝑁), (𝑖 = 1, 2, … . , 𝑁)
𝑁 number of criteria
𝐴𝐻𝑃𝑥̅,𝑧̅ℎ𝑎𝑧𝑎𝑟𝑑 𝑖𝑛𝑑𝑒𝑥 hazard index value in each grid after integrated 𝐻𝐼𝑥̅,𝑧̅,𝑓𝑙𝑜𝑜𝑑
hazard index value of coordination of 𝑥̅
(vertical) and 𝑧̅ (horizontal) from 𝑓𝑙𝑜𝑜𝑑 hazard map
(𝑥̅ = 1, 2,…..,𝑥𝑥̅̅̅; 𝑧̅ = 1, 2, … . . , 𝑧𝑧̅̅̅)
𝐻𝐼𝑥̅,𝑧̅,𝑙𝑎𝑛𝑑 𝑢𝑠𝑒 𝑐ℎ𝑎𝑛𝑔𝑒
azard index value of coordination of 𝑥̅ (vertical) and 𝑧̅ (horizontal) from
𝑙𝑎𝑛𝑑 𝑢𝑠𝑒 𝑐ℎ𝑎𝑛𝑔𝑒 hazard map (𝑥̅ = 1, 2,…..,𝑥𝑥̅̅̅; 𝑧̅ = 1, 2, … . . , 𝑧𝑧̅̅̅)
𝐻𝐼𝑥̅,𝑧̅,𝑙𝑎𝑛𝑑𝑠𝑙𝑖𝑑𝑒 azard index value of coordination of 𝑥̅ (vertical) and 𝑧̅ (horizontal) from 𝑙𝑎𝑛𝑑𝑠𝑙𝑖𝑑𝑒 hazard map (𝑥̅ = 1, 2,…..,𝑥𝑥̅̅̅; 𝑧̅ = 1, 2, … . . , 𝑧𝑧̅̅̅)
𝐻𝐼𝑥̅,𝑧̅,𝑐𝑙𝑖𝑚𝑎𝑡𝑒 𝑐ℎ𝑎𝑛𝑔𝑒 𝑡𝑜 𝑓𝑙𝑜𝑜𝑑
azard index value of coordination of 𝑥̅ (vertical) and 𝑧̅ (horizontal) from
𝑐𝑙𝑖𝑚𝑎𝑡𝑒 𝑐ℎ𝑎𝑛𝑔𝑒 𝑡𝑜 𝑓𝑙𝑜𝑜𝑑 hazard map (𝑥̅ = 1, 2,…..,𝑥𝑥̅̅̅; 𝑧̅ = 1, 2, … . . , 𝑧𝑧̅̅̅)
XVI
𝐻𝐼𝑥̅,𝑧̅,𝑐𝑙𝑖𝑚𝑎𝑡𝑒 𝑐ℎ𝑎𝑛𝑔𝑒 𝑡𝑜 𝑙𝑎𝑛𝑑𝑠𝑙𝑖𝑑𝑒
azard index value of coordination of 𝑥̅ (vertical) and 𝑧̅ (horizontal) from
𝑐𝑙𝑖𝑚𝑎𝑡𝑒 𝑐ℎ𝑎𝑛𝑔𝑒 𝑡𝑜 𝑙𝑎𝑛𝑑𝑠𝑙𝑖𝑑𝑒 hazard map (𝑥̅ = 1, 2,…..,𝑥𝑥̅̅̅; 𝑧̅ = 1, 2, … . . , 𝑧𝑧̅̅̅) 𝑥𝑥
̅̅̅ number of grid in vertical of hazard map ( all of
hazard map have equal number of grid in vertical)
𝑧𝑧
number of grid in horizontal of hazard map ( all of hazard map have equal number of grid in horizontal)
𝐷𝐶𝑥 damage cost in x area (USD/km2), x is either
agricultural or paddy field,
𝐷𝐶𝑢𝑟𝑏𝑎𝑛 damage cost in an urban area (USD/km2)
𝐻𝐶 asset value of house content (USD/km2)
𝐺𝐷𝑃 total gross domestic product (billions USD)
𝑃𝑜𝑝 population in millions
𝑇 period over the project is analyzed (year)
𝑟 discount rate
𝑇𝐵 total benefits from the project from start of
project until end (USD)
𝑏𝑒𝑛𝑒𝑓𝑖𝑡 project benefit (USD/year)
𝑇𝐶 total costs of project (USD)
𝐶𝑜𝑠𝑡𝑠 𝑜𝑓 𝑎𝑑𝑎𝑝𝑡𝑎𝑡𝑖𝑜𝑛
𝑚𝑒𝑎𝑠𝑢𝑟𝑒 cost for adaptation (USD/year)
𝐵 𝐶⁄ ratio of costs and benefits
𝑅2 coefficient of determination
𝑂𝑖𝑎
𝑖𝑎th observed data for the element being evaluated
(𝑖𝑎 = 1, 2,…., 𝑛𝑛)
𝑂̅ mean value of observed data
𝑦𝑖𝑎 𝑖𝑎
th simulated data for the element being
evaluated (𝑖𝑎 = 1, 2,…., 𝑛𝑛)
𝑦̅ mean value of simulated data
𝑛𝑛 number of evaluated data
𝐸 Nash-Sutcliffe efficiency
𝑍𝑝 estimation value for location 𝑝
XVII
𝑑𝑖𝑏 Euclidean distance between estimated location to
𝑖𝑏th sample point location (𝑖𝑏 = 1, 2,….., M)
𝑀 the number of sample points
𝑝𝑤 distant exponent power
𝐹𝑇𝑟,𝐶𝑠 logarithm of predicted input data at return period
𝑇𝑟
𝐹̅ average of input data logarithms
𝐾𝑇𝑟,𝐶𝑠 function of the skew coefficient (𝐶𝑠) and return
period 𝑇𝑟
𝐶𝑠 skew coefficient
𝑇𝑟 return period (year)
𝑆𝐹 standard deviation of input data logarithms
𝐹𝑖𝑐 logarithm of input data (𝑖𝑐 =1, 2, 3…., 𝑓)
𝑓 number of input data
𝑋𝑖𝑑 (𝑖𝑑 = 1, 2, 3…., 𝑡𝑔) is 𝑖𝑑th probability grid data
of land slide hazard map (from smallest to largest probability)
𝑡𝑔 total number of grid from hazard map
𝑋𝑚𝑒𝑎𝑛 mean of probability grid data
𝑋𝑖𝑑1, 𝑋𝑖𝑑2, 𝑋𝑖𝑑3 and 𝑋𝑖𝑑4 (𝑖𝑑1 = 1,2,3, … 𝑐𝑙1) , 𝑖𝑑2 = 𝑐𝑙1 + 1, 𝑐𝑙1 +
2, … . . , 𝑐𝑙2) , (𝑖𝑑3 = 𝑐𝑙2 + 1, 𝑐𝑙2 + 2, … , 𝑐𝑙3) , (𝑖𝑑4 = 𝑐𝑙3 + 1, 𝑐𝑙3 + 2, … . . , 𝑡𝑔)
Group 1, 2, 3 and 4 data, respectively which divided from 𝑋𝑖𝑑 data
𝑐𝑙1, 𝑐𝑙2 and 𝑐𝑙3 Break point in 𝑋𝑖𝑑 data
𝑋𝑐𝑙𝑎𝑠𝑠1, 𝑋𝑐𝑙𝑎𝑠𝑠2, 𝑋𝑐𝑙𝑎𝑠𝑠3 and 𝑋𝑐𝑙𝑎𝑠𝑠4 mean of probability grid data from group 1,2 3 and 4, respectively
1
CHAPTER 1: INTRODUCTION
1.1. Research context
1.1.1. Flood and landslide situation in Laos
The Mekong River is the largest river basin in the Southeast Asia, and is shared by the six countries of China, Myanmar, Thailand, Cambodia, Vietnam and Laos. In the last decade a lot of researches have been done research in Mekong River especially its flood component are expected to have significant impacts on several keys functions of the river but none of those researches are focus on the flood risk index in Laos.
Floods are among the most dangerous natural hazards. Flooding can happen anywhere, and sometimes, it is unavoidable. The economy, people’s livelihood and the infrastructure of many countries around the world have been affected by flooding (Golian et al., 2010). Lao People’s Democratic Republic (or Lao PDR) suffers from flooding every year. Lao PDR is a developing country located in Southeast Asia. The country’s people depend heavily on agriculture and natural resources for their livelihood. Currently, the water supply system in the country is not well distributed, particularly in rural areas. Therefore, most people living in rural areas are resettled downstream of dams and irrigation areas (Baird and Shoemaker, 2007). Changes in land use, such as decreases in forest density, can lead to increases in flood magnitude (Jongman et al., 2012; Winsemius et al., 2016). The Laos PDR have experienced a range of floods of different magnitudes and duration. Particularly in three consecutive years from 1994 to 1996, the flood were large and disastrous. In the last decade flood have occurred on greater scale and more
2
frequently, leading to an increasing number of casualties and further compromising flood security and livelihood in rural area. According to Government of Laos (GoL) since 2000, large scale flooding has occurred in Laos PDR in 2000, 2002, 2005, 2008, 2009 and 20011. While in previous years a single major food event could be identified, in 2013 the country experienced continuous heavy rain affecting villages and crops at various levels, and this year was marked by a series of flood events affecting people across country. The rain led to floods and landslide, those disasters destroyed and severely damaged to village infrastructures such as road, irrigation systems the flood events were caused by different weather systems, occurred in different location at different time (starting in July and end in October), in total 12 out of 17 provinces, and 52 out of 145 districts, it also impact to huge area of agriculture land, paddy field which is the most is directly impact to the standard living for a majority of Laos people living in agriculture sector and its significant resource for our economic growth and for sustainable development.
1.1.2. Impact of land use change
Forest also has a significant role on the water resource, it can store water in rainy season and delay water discharge from upper basin to reach lower basin. As a landlocked country, the Laos is endowed with abundant natural resources, relative to many other Asian countries, especially water, forests, and minerals. However, the forest cover has declined from 70 percent of the total land area in 1940 to 41.5 % in 2002. The most basic factors for decline of forest are widespread poverty and rapid population increase amongst the rural population; as a results, obliges to practice forms of cropping resulting in destruction of forest. The government has been engaged in systematic campaigns to
3
reduce and eventually eradicate swidden cultivation and opium cultivation though poverty eradication. Therefore, it is important to understand the impact from deforestation to the flooding, which that we can identify regions that will have significant effect to the flood.
1.1.3. Impact of climate change
Climate change increases the intensity of rainfall and more rainfall events happen, it is means for the risk of flooding. However, it is varied widely from location to location depend on the studied hydrological climatic area. In this study, we focus on the hydrological system in Laos. Now a days, the hydrological regime of the country change significantly, seasonal changes of precipitation considerably affect the hydrological regime and induce important impact on the water resource, and this could have a significant impact to the hydropower production, irrigation and also increase water related risks for instance flood; many of researchers believe that increasing in a number of hydrological extreme events such as flood, landslide and so on are happened because of climate change (Hirabayashi et al., 2008; IPCC, 2007). River flood are generated differently in different geographic environmental. They may be generated by intense rainfall exceeding the infiltration capacity of soil, or by rain falling on saturated ground; when floods area largely generated by intense rainfall and antecedent conditions area not relevant then changes in flood characteristics area strongly influenced by changes in the frequency of intense rainfall. However floods may be generated by the melting of snow; since, no snow fall in Laos, this study will not include snow factor in climate change factor. Therefore, by knowing how change in extreme rainfall affect the distribution of
4
water at a regional scale is significant to the impact from climate change to flooding, which was one major objective of this study.
In recent years, many researchers have conducted global studies on the impact of climate change on the water cycle and its effect on people’s livelihood (Adeloye et al., 2013; Parmesan and Yohe, 2003a; Westra et al., 2014). However, there have been only a few assessments and analyses for predictions on the country’s environmental impacts when considering possible climate changes. According to the Intergovernmental Panel on Climate Change (IPCC) report, Southeast Asia will suffer from increasing flood frequency in the future (IPCC, 2007). General Circulation Models (GCMs) have been developed to study future climate scenarios and the associated impacts, and they help support strategies and mitigation plans to address the effect of climate change
1.2. Objective of study
The effects of hazards on an area could be in either a single or multiple forms. In the last decade, the uses of multi-hazard assessment focusing on all scales have been considered in several studies (Cutter et al., 2000; Marzocchi et al., 2012; Sendai Framework, 2015; Sullivan-Wiley and Short Gianotti, 2017). However, exhaustive data are required in most assessments. Recently, geographic information systems (GIS) have been used as a tool for such assessment. This is an effective tool for handling large amounts of spatial data, assimilating data from several sources and undertaking analyses (Fernández and Lutz, 2010; Kazakis et al., 2015). In contrast, the tool is ineffective in performing multi-criteria analyses, and hence, it is not appropriate for executive or managerial purposes. For criteria supervision, a combination of GIS and
multi-5
criteria decision analysis (MCDA) is essential. Many studies have indicated the applicability of GIS for MCDA flood hazard maps. One of the most common MCDA methods is the analytic hierarchy process. This approach is appropriate because it offers precise results, and it is used for studying hazards in several studies (Kazakis et al., 2015; Stefanidis and Stathis, 2013). In recent development, flow accumulation, slope, elevation, land use, and rainfall intensity have been used as GIS-based map information to map flood hazards using AHP and GIS (Gigović et al., 2017). According to the Sendai Framework (2015), it is important to pay more attention to risk analysis. Single risk analysis addressing single hazards provides information about only an individual risk in a specific location; however, in a specific location, more than a single hazard can occur. For example, in mountainous areas, landslides and floods can occur together. Therefore, the integration of the risk assessment of these hazards is necessary. Phrakonkham (2019) estimated the hazards in Lao PDR due to landslides, floods, land use change to floods, climate change leading to floods and landslides, and integrated hazard maps; the results were used in the analysis of the negative consequences of these hazards in this article.
The main objective of this study was to propose a new approach to integrated risk maps to detect subtle areas on the national scale, for which there are limited data available. This modelling method combined several maps of hazards, i.e., land use change, climate change and flooding. As a priority weighting function for the maps, AHP was deployed. Furthermore, analyzing the distribution pattern of hazard and risk for both individual and integrated maps. Both individual and integrated risk maps were used to provide the damage costs from the risk to the land use area (urban, paddy, and agriculture). The integrated risk maps can be apply in adaptation measure for risk reduction or combine with future development plan to identify suitable location for development.
6
1.3. Organization of dissertation
This dissertation is consist with seven chapters. Chapter 1 provides the overview of this thesis. Current situation of flooding, what is happened in recent decade. Following it, the impact of climate change and deforestation to the hydrological cycle in Lao PDR. The objective to solve the encountered problem statements. The research frameworks used to achieve the prescribed objective in this study. Chapter 2 presents the report of the former researches in flood, landslide, land use change, climate change and risk. Chapter 3 provide the fundamental details of the study area beginning with the location, topography and continue to forest and climate change situation. All necessary required data for input, such as land use, soil types, hydrological, meteorological and GIS data as well as the data sources are described in this chapter. Chapter 4 consists of a set of mathematical models and conceptual of hydrological distributed model for simulate runoff are given in this chapter. Following it, calibration and validation of the model and its applications to the study area were clearly explain. Chapter 5 focus on the analysis of individual hazard maps such as flood, land use change, land slide and climate change leading to flood and landslide. In addition, decision making method for integrated those hazard maps together and explain the methodology to validation of the hazard maps. Chapter 6 focuses on analysis of risk and cost from multi hazard impact in Lao PDR for both present condition and future impact from climate change. Additionally, an adaptation measure to reduce damage cost from integrated risk map had been analysis. Chapter 7, summary of the main finding, scientific contribution and their practical implications are discussed as well as the recommendations for the further research (Figure 1-1).
7
Figure 1-1 Schematic of the dissertation context
Ch apte r 1 & 2 Ch apte r 3&4 Ch apte r 5 Ch apte r 6
Analyse hazard area from individual and integrated hazard map
Ch
apte
r
8
CHAPTER 2: LITERATURE REVIEW
2.1 Concept of integrated hazard and hazards in study
area
2.1.1 Integrated hazard
Generally, integrated hazard is mean that we integration multi-hazards into a single system for joint evaluation (Carpignano et al., 2009; Marzocchi et al., 2009). Basically, it considering the characteristic of each hazard such as probability, magnitude and frequency. The challenge for integrated hazard or multi-hazard is that each hazard have their own characteristic and different method to analyse them and their magnitude also measured in different way and using different units (Carpignano et al., 2009). Accordingly, reference unit of each hazard become a problem for comparison of multi-hazard.
Moran et al ( 2004) presented the methodology for integrated multi hazard namely avalanches and rock falls. The aim of this study is to assessment the risk potential of natural hazard in lacking of hazard zoning. The study used a worst case scenario as the common basis of hazards, therefore the potential impact areas of each hazard can be compared and jointly. The classification was scale in 4 classes as low, moderate, high and extra high. Instead of used maximum of overlap classes, they used mean of overlap classes to represent the classification of integrated hazard for example in one area avalanches have high hazard and rock falls have low hazard the integrated map will classification that area as moderate hazard area.
9
identify potential affected areas from multi-hazard in the same time. The potential affected area cover all high population areas that can be exposed to multi-hazard. Instead of used classification scheme, they proposed hazard weight method for integration of multi-hazard. The hazard weights were determine by their impact on humans and economic.
Phrakonkham (2017) used the equal weight method to integrated multi-hazard. The study aim to provide integrated map that consist with flood, land slide, land use change and climate change to flood. The results shown good correlation between the simulation map and historical events. Using equal weight for integration is possible but basically all hazard not equally importance. The weight of each hazard have a significant impact on the integrated hazard map. Moreover, damage from individual hazard and integrated hazard map to economic have not discuss in the study yet. Therefore, methodology for integration multi hazard risk map is necessary.
2.1.2 Analytical Hierarchy Process
Previous studies have presented many methodologies to integrate multi-hazard such as using classification scheme or provide weighting for each hazard. However, none of the studies have taken consideration of natural abilities of human to sense, adapt, or modify their environment to avoid danger which is the human perception of risk as individual and the public perception of risk as communities or group. A stakeholder involvement in the study will provide advantages to both researchers and stakeholders. The stakeholders will have opportunities to share their vision, needs and knowledge on the hazards. They could also assist in reducing conflicts and increasing the cooperation
10
in the future. The objective of this study is to provide the integrated hazard risk map in using stakeholder’s judgement to retrieve weighting of each hazard. There are several multi criteria decision making methods to solve multiple conflicts among independent criteria when evaluating multi hazard risk map. For instance, Multi Attribute Utility Theory (MAUT) (Keeney and Raiffa, 1993) is an expected utility theory that can decide the best course of action in a giving problem by assigning a utility to every possible consequence and calculating the best possible utility. The drawback of this method is the requirement of huge amount of input in every step of procedure (Konidari and Mavrakis, 2007). Simple Additive Weight (SAW) (Fishburn, 1967) is established based on a simple addition of scores that represent the goal achievement under each criteria, multiplied by the particular weight. The disadvantage of SAW is the estimation weight does not always reflect the real situation, (Qin et al., 2008). Technique for Order Preference by Similarity to Ideal Solutions (TOSIS) (Hwang and Yoon, 1981) is an approach to identify an alternative which is closed to ideal solution and farthest to negative ideal solution in a multi-dimensional space. The drawback of this method is the difficulty to weight criteria and keep consistency of judgement, especially with additional criteria (Behzadian et al., 2012). Analytical Hierarchy Process (AHP) (Saaty, 1994) uses a pairwise comparison to compare the relative significance between criteria designed from the stakeholder’s judgement. The disadvantage of this method is the expert knowledge dependency. Although, AHP requires data to properly perform pairwise comparisons, but it is not nearly as data intensive as MAUT. Among various multi criteria decision making methods, AHP’s property is in line with our study objective. Furthermore, AHP is recognized as a multi-criteria method that is incorporated into GIS-based procedures for determining suitability (Parry et al., 2018; Prakash, 2003). Pourkhabbaz et al (2014) used AHP in GIS
11
environment with the aim of choosing the suitable location for agriculture land use. Gigović et al (2017) presented a reliable GIS-AHP methodology for hazard zone mapping of flood prone area in urban areas. In the study, firstly six factors that reverent to hazard of flood in urban area were considered. Then, the hazard zone mapping was compared with historical flood events for validation. From the results, the GIS-AHP hazard map proves a good correlation between high hazard area of the map and historical event of flood. The results of this study provided a good basis for developing a system for hazard management. Ramya et al (2019) analysed suitable location for industrial development by using GIS, AHP and Technique for Order Preference by Similarity to Ideal Solution (TOSIP). In this study, various type of criteria, for example near major road, far from agriculture, paddy field, river (flood prevention) etc, were used. As a result, most suitable locations for industrial can be highlighted. Based on research studies mentioned above, it could be concluded that AHP is an effective and powerful tool to analyze, structure and prioritize complex problems considering expert judgment on various aspects. Therefore, the AHP is chosen for the studies of the integration multi hazard risk mapping.
2.1.3
Hazards in Lao PDR
2.1.3.1 Flood
Flood is one of the most dangerous hazard in the world. Major of flood events in Asia and Pacific region are cause by the heavy rainfall from Monson (Mikkelsen et al., 1999). According to Westra (2014), Pattern of rainfall over space and time. Moreover, the pattern of rainfall is changing due to the climate change and the rating of changing is
12
varied depending on the geographic location (Trenberth et al., 2003).
Mostly, flood can be classified to 4 types by location of occurrence and what cause flood to happen. River flood occurs when the amount of water flow are exceed the capacity of river channel. It is usually happen in rainy season. Coastal flood occurs in coastal area when the ocean water flow are strong and the water surge over coastal areas. Normally it is happen because of storm, offshore low pressure, sea wave that occurs because of earthquake or underwater volcanic. Urban flood occurs from heavy rainfall and runoff water in urban area exceed discharge capacity. Urban flood can be more serious than river flood in term of flood depth. Mostly, paved road in urban area is the main factor that cause the high flood depth. Runoff water cannot infiltrate to underground or discharge channel because of the paved road have less absorbing ability. Flash floods occur when a large amount of water flood within short period of time. Normally it occurs locally and suddenly without or with little warning. Flash floods could happen due to immoderate rainfall or a sudden release of water from a dam. Flood mapping is a tool for risk management. It is use to defined concern areas which are risk to flooding. Flood maps are powerful tool for support flood hazard management. The map can provided several of flood attributes such as flood velocity and flood depth. The flood hazard map can adjust its requirement and classification depends on the purpose of the study.
Many researches have been study about the flood hazard, they want to understand the behaviour, magnitude and occurrence of flood (Di Baldassarre and Montanari, 2009; Crispino et al., 2015; Horritt and Bates, 2001; Patro et al., 2009; Poretti and De Amicis, 2011). Even thought, flood hazard map can provide useful information on the potential inundation area, many uncertainties still remain in flood hazard map. Mostly of uncertainties in flood hazard map come from accuracy of data for example
13
rainfall data, geological data and model parameter. In recent decade, numerous studies has been discuss and identified the source of uncertainties from flood hazard map (Bales and Wagner, 2009; Domeneghetti et al., 2013; Dottori et al., 2016; Jung et al., 2013). Nevertheless, it is still impossible to remove all of the uncertainties due to the lack of many factor such as knowledge, technology, times and cost. Rainfall runoff model are classified as lumped and distributed model based on the model parameters. According to Devia et al (2015) lumped model, the entire river catchment is considering as a single unit where spatial variability is neglect and the output are generated without considering the spatial process; distributed model is divide the entire catchment into small unit, therefore the parameter, input and output data can vary spatially. In this study, we used distributed hydrological model proposed by Kashiwa et al (2010) and adapted to use in Lao PDR by Phrakonkham (2017). Phrakonkham (2017) assessed the flood hazard map in Lao PDR by using distributed hydrological model, the hazard map can illustrated distribution of potential flood hazard area throughout whole country.
2.1.3.2 Land slide
Landslide is one kind of natural disaster, it is occurs because of the mass movement of debris flow or rock and sliding under the influence of gravity. Additional, landslide usually occurs when rainfall around steep slope area such as mountainous area. Hence, rainfall and slope gradient can be consider as significant factor for occurrence of landslide. In Lao PDR many ethnic groups are living in mountainous area. Their livelihood is depend on agriculture and livestock. When landslide occurs, their productivity is greatly damaged which create huge economic loss to them. Therefore, we consider landslide
14
hazard into our study, in order to analyse potential impact area and damage cost from landslide. Based on Shirole et al (2017), the impact of landslide can be very serious including the loss of people live, destruction to household and income resource of people who live near those area such as agriculture, pond, paddy field and forest. Based on Orlowsky et al (2012) stability of slope can be influence by different phenomena. When the slope is unstable is lead to the landslide. The influence that cause unstable slope including precipitation, change of temperature, earthquake and actions of human such as construction. Collison et al (2000) proposed coupling methodology between GIS and slope stability model to investigate the impact of rainfall on landslide frequency and evaluate factor safety in hillslope area. In addition, according to White and Singham (2012) have analyse sensitivity of slope failure model to various rainfall pattern. According to results, average rainfall is the significant indicator to trigger landslide. Based on those studies clearly shown that rainfall is a significant factor to trigger landslide. Furthermore, in shallow slope rainfall can cause delay of slope failure (Zhang et al., 2019).
In order to evaluate landslide hazard, they are mainly two approach deterministic and statistical approach. Many studies aim to compare and evaluated the assessment of land slide hazard from both mentioned approach (Aleotti and Chowdhury, 1999; Calcaterra et al., 1998; Lee et al., 2008). Deterministic approaches are based on analysis of slope stability and the drawback of this method are ground conditions need to be uniform for the whole study area and the land slide type that occurred in the study area need to be known (Dai et al., 2001). For the statistical approach, it is consider as indirect hazard mapping method. The statistical approach used statistical determination of various variables that have triggered landslide hazard event in the past and this approach is possible to use for large area (Refice and Capolongo, 2002). Ono (2011) have studies
15
about rainfall-induced landslide by used Shallow landslide instability model. The model consider rainfall as a triggering factor of landslide. The studied have consider two events of landslide events in Thailand as a case study. The model shows the good accuracy of safety factor in those areas with it can explain the high potential of shallow landslide in each area. Kawagoe (2010) used probabilistic model based on multiple logistic regression analysis to evaluate the frequency of landslide hazard in Japan. From the results of this study shows some significant physical parameters such as hydraulic gradient, relieve energy and geological parameters which these parameters are considered to be influent to the occurrence of landslide. Therefore, in this study we use statistical approach to evaluate landslide hazard probability in our study area.
2.1.3.3 Land use change
According to many studies (Huntington, 2006; Li et al., 2009) land cover variability have influent to hydrological flow which has effect to the fluctuation of surface stream flow. The fluctuation of surface stream flow can lead to natural disaster such as flood. In order to prevent and avoid damage from natural disaster to our human community, it is necessary to examine the impact of land use change such as forest area and expand of urban on natural disaster. Based on Macklin and Lewin (2003) magnitude and frequent of flooding may be increase due to the land use change. In small-medium scale river basin, land use is play a significant role in either of reducing or amplifying the serve of flooding. In Lao PDR the decreasing of forest become serious problem in nation scale. Deforestation results from clearing forestland for shifting cultivation and removing logs for industrial use and fuel. The volume of logs removed for industrial purposes increased
16
by around 70 percent between 1975-1977 and 1985-1987, to about 330,000 m3. Between 1980 and 1989, the volume of logs removed for fuel to about 3.7 million m3 and only about 100,000 m3 were removed for industrial purposes. By 1991 these volumes had increased to approximately 3.9 million m3 and 106,000 m3, respectively. Following the introduction of the New Economic Mechanism in 1994, decentralization of forest management to autonomous forest enterprises at the provincial level encouraged increased exploitation of forests. At the central and provincial levels, autonomous forest enterprises area responsible for forest management. Timber resource has been commercially exploited on a small scale since the colonial period and are an important source of foreign exchange. In 1988 wood products accounted for more than half of all export earnings. In 1992 timber and wood products were almost one-third of the total principle exports. Another reason for the decreasing of forest density is swidden agriculture, most farmers employ one of two cultivation systems: wet field paddy system, practices primarily in the plains and valleys, or the swidden cultivation system, practiced primarily in the hills. These systems are not mutually exclusive among Laotian in areas remote from major river valleys, swidden cultivation was practiced by approximately one million farmers in 1990, who grew mostly rice on about 40 percent of the total land area planted to rice.
17
2.1.3.4 Climate change
Based on Intergovernmental Panel on Climate Change (IPCC, 2007), recently many greenhouse gases such as carbon-di-oxide, methane and nitrous oxide have been increased. In addition, the growth rate of these greenhouse gases are increase every year which is influent to pattern of precipitation around the world. Climate change has potential impact to natural disaster frequency such as flood, landslide, drought and etc. In order to understand potential changing of climate pattern, climate data from Global Climate Models (GCMs) were used. These models provides future projection of future climatic conditions such as rainfall intensity, wind velocity and greenhouse gases concentration. GCMs data is provided in big spatial resolution (80-300 km grid size). Therefore, it is required a preparation (downscale) before it can be used for smaller scale such as regional or catchment scale. Downscaling is a method for get better spatial resolution of GCM output. Methodology for downscale GCM data can be classify into two methods. First method is dynamic downscaling, it is use high resolution regional simulations for reanalysis data to produce regionalised climate information. Second method is statistical downscaling. It is based on relationships between local climate factor such as rainfall, temperature, wind velocity and large scale predictors.
Dankers and Feyen (2008) assess influent of climate change to future flood hazard in Europe. They have concluded, by the end of this century discharge level from many rivers in European will increase for both of magnitude and frequency. However, few rivers will have decrease of discharge level such as rivers of northeast Europe region. Mirza et al (2011) indicated as it is highly that climate change will influent to monsoon precipitation and it is lead to increase of frequency, magnitude and extend of flood hazard
18
in south Asia such as Bangladesh, India and Pakistan. Also the damage to agriculture, human live and infrastructure will increase in the future. Bouwer (2010) investigate change of flood risk due to climate change and its damage cost. Change of future precipitation and socioeconomic change such as land use change and increase of value asset were consider for assess the damage cost from future flood risk. They concluded that the climate change will increase the damage cost from flood risk around 35 – 170 % by 2040 in Netherland. Sidle and Ochiai (2006) evaluation climate change variables that will triggering landslide hazard. They concluded that increasing of air temperature and precipitation in seasonal were the most interrelated climate variables that will triggering landslide hazard. Ciabatta (2016) investigated the impact of climate change to occurrence of landslide in Italy by using PRESSA model develop by Central Italy. The model based on relationship between rainfall and soil moisture condition (Ponziani et al., 2012). They concluded that the increase in the occurrence of landslide hazard is related to increase of rainfall intensity.
2.2. Integrated risk
Integrated risk or multi-hazard risk is a result from integrated hazard combine with vulnerability. Integrated risk is a development of integrated hazard. Integrated hazard map is focuses on potential impact areas from serval hazards. It is can use for decrease the probability of occurrence and intensity of hazards. Integrated risk map is emphasizes on risk, risk is the combination of the probability of occurrence of a hazard and its negative consequences or vulnerability (UNISDR, 2009). The aim of integrated risk is to have a holistic view of the total impact by mapping and assessing the expected loss from the
19
occurrence of various hazards on social, economic and human life (Komendantova et al., 2014). Grieving et al (2006) presents indices-based integrated hazard combine with vulnerability index to calculate integrated risk. Delphi process method was used to obtain weight of all hazards. The Delphi process is based on a structured process for obtain and synthesizing knowledge from people in study area by questionnaire. The vulnerability is generate from two indicator hazard exposure and coping capacity, equally weight were used for integrated two indicator into vulnerability. Both of integrated hazard and vulnerability were subdivides into five classes. Subsequently, integrated hazard and vulnerability’s classes were summed up to generate integrated risk. Tate, Cutter and Berry (2010) develop a GIS based integrated risk methodology. The objective of this study is to presents GIS based technique that simple for generate mapping of hazard risk. The map is applicable in a screening process to identification of highly risk area. The GIS based technique implemented are not complex and the required input data publicly available. Many studies have used GIS based to calculate integrated risk by aggregating many hazard risk together for instance Wipulanusa et al (2009) discusses aggregation of drought risk and flood risk by overlapping each integrated risk map. Bell and Glade (2004) presents the integrated risk from snow avalanche debris flow and rock fall by created overlaying each integrated risk map with equal weight. Based on previous study, most of method for integrated risk is calculated by aggregating each risk map with equal weight.
20
2.3. Significance of this study
The existing studies on multi hazard risk mapping are mainly focus on aggregating all individual hazard risk with equal weight, sum of hazard index from individual hazard or using frequency of occurrence for each hazard to decide the weigh, which does not sufficiently reflect the various impacts of different hazards present in the same area. In addition, those studies have not consider participation of stakeholders. In this study, we take into account the stakeholders opinion by comparison of each individual hazard to find the importance of each hazard. The importance of each individual hazard was determined by AHP method. Future more, AHP is a method that attempts to imitate human rationality for decision making by using the experiences and perception from the stakeholders and experts. It offers organization of knowledge, simplifies structures for understanding the issue and consistency, and involves human logic and intuition as well as experiences. In addition, the pairwise comparisons help stakeholders and expert to focus their judgment on each comparison criteria. Each criterion has a certain value that represents a judgment of the likelihood of its scale of importance to others. The integrated hazard risk map based on AHP can identify potential distributed of hazard and risk areas across the country. In addition, the integrated map can provide the preliminary results for distribution pattern of hazard and risk areas, also the damage cost from the potential risk area can be estimated. Moreover, the integrated map can use as support tool for mitigation strategies, future development planning or adaptation measure for decrease hazard area or reduce damage cost of hazard risk.
21
CHAPTER 3: STUDY AREA AND DATA
SOURCES
3.1 Study area
3.1.1 Location and topography
3.1.1.1 Location
22
23
The Laos PDR, or Laos, is situated in the middle of South East Asia. The country is landlocked, so it has no direct access to the sea and has common borders with China, Vietnam, Cambodia, Thailand and Myanmar. The country is located in the Center of the Indochinese peninsula, located between Longitude 100 to 108 degree East and latitude 14 to 23 degree North, with a total area of 236,800 km2 with Mekong river flows through almost 1,900 km of Lao territory from the North to the south and it’s form a natural border with Thailand on over 800 km. In addition, Laos PDR can divide into 3 regions. These regions are determined by the Lao government, namely, southern, central and northern (Figure 3-1). Future more, Lao PDR is divided into 16 provinces and one capital Vientiane Capital city as shown in Figure3-2
3.1.1.2 Topography
The country is dived into three distinct regions – mountains, plateaus and plains along the Mekong region. The mountain and plateaus make up three quarter of the total area especially in the area of the North and South-East. Northern Laos is dominated by rough mountain, jungle and agricultural areas. The plain region is located along the Mekong River and forms the other quarter of the country. Most of the western boarder of Laos is demarcated by the Mekong River, which is an important mainstream for transportation. The Mekong fall at the end of southern part of Laos prevent access to the sea, but cargo boats still can travel along the entire length of the Mekong in Laos during the most of the years. Smaller power boats and pirogues provide an important role for transportation on many of the tributaries of the Mekong.
24
country and the similarities of Laos and northeast Thai society from people to local language, which reflect the close contact that has existed across the river for centuries. Prior to the twentieth century, Laotian kingdoms and principalities encompassed areas on both sides of the Mekong, and Thai control in the late nineteenth century extended to the left bank. Although the Mekong was established as a boarder by French colonial forces, travel from one side to the other side has been significantly limited only since the establishment of the Laos in 1975.
The eastern border with Vietnam extends for 2,130 km mostly along the crest of the Annamite Chain, and serves as physical barrier between the Chinese-influenced culture of Vietnam and the Indianized states of Laos and Thailand. These mountains areas sparsely populated by tribal minorities who traditionally have not acknowledged the border with Vietnam any more than lowland Laotian have been constrained by the Mekong river border with Thailand. Thus ethnic minority populations are found on both Laotian and Vietnamese side of the frontier. Because of their relative isolation, contact between these groups and lowland Lao has been mostly confined to trade. Laos shares its short border of southern with Cambodia and ancient Khmer ruin at What Pho other southern locations attest to the long history of contact between the Laos and the Khmer, in the north, Laos is bounded by a mountainous border with china and shares long Mekong river boarder with Myanmar.
25
3.1.2 Climate
3.1.2.1 Temperature
Lao PDR is a tropical country and it have a tropical monsoon climate. Lao PDR have two season year as rainy season start from May through October and dry season from November to April. The highest temperature in Lao PDR is close to 40 degree C in April. The lowest temperature is around 10 degree C from December to January. In the Northern sky is often cloudy so the sunshine is very low lead to the temperature in this area is lowest when compare to central and southern area. In the central-southern area the temperature slightly higher than northern during December to January.
3.1.2.2 Rainfall
Rainfall in Lao PDR is influents by the monsoon winds that have a seasonal character. Normally, annual rainfall in Lao PDR is around 1200 to 2200 mm/year in plain area and in mountainous area of northern and southern region annual rainfall can exceed 3000 mm/year. The rainy season in Laos start from May through October, rainfall peak happen in August to September (Figure 3-3). During this time flood events occurs in many areas.